Human Capital
disclosure on
MASTER
THESIS WITHIN: Business Administration NUMBER OF CREDITS: 30 hp
PROGRAMME OF STUDY: Civilekonomprogrammet AUTHOR: Carl Azelius & David Johansson
JÖNKÖPING May 2019
A study on ownership structure and human capital
disclosure in Sweden and Norway
i
Master Thesis in Business Administration
Title: Human Capital disclosure on LinkedIn - A study on ownership structure and human capital disclosure in Sweden and Norway
Authors: Carl Azelius and David Johansson Date: 2019-05-20
Key terms: Human Capital disclosure, LinkedIn, Ownership structure, Agency theory, Legitimacy theory
Abstract
Background: Human capital disclosure is a widely examined topic by scholars, previous
studies has mainly focused on annual reports and companies webpages. However, during the last decade, social media has grown in importance and it represent a new way for companies to interact with stakeholders. The increased interactivity provided by social network sites have made it one of the most important communication tools for companies to interact with
stakeholders. One of the larger social media, LinkedIn has received little attention by researchers, only one previous study has investigate human capital disclosure on LinkedIn. Previous research has examined different corporate disclosure in connection to ownership structure.
Purpose: The purpose of this study is to investigate the relationship between ownership
structure and human capital disclosure made by companies in Sweden and Norway via LinkedIn.
Method: This study is conducted with a quantitative methodology, investigating a sample of
150 companies from Sweden and Norway. Human capital disclosure on LinkedIn are analysed through a content analysis and a regression analysis to test the hypothesis in this study.
Conclusion: The results confirm the hypothesis that a negative relationship exists between
ownership concentration and the level of human capital disclosure via LinkedIn. This is in line with previous research; however, this study shows that companies in a more digitalized environment disclose more HC information.
ii
Table of Contents
1.
Introduction ... 1
1.1 Background ... 1 1.2 Problem ... 2 1.3 Purpose ... 3 1.4 Outline ... 42.
Literature Review and Theoretical Framework ... 5
2.1 HC Disclosure ... 5
2.2 LinkedIn ... 10
2.3 Ownership concentration and HC disclosure ... 12
3.
Method ... 16
3.1 Measure Independent and control variables ... 17
4.
Findings ... 23
4.1 Descriptive statistics ... 23 4.2 Pearson correlation ... 25 4.3 Regression analysis ... 26 4.4 Multicollinearity ... 285.
Analysis ... 29
5.1 Ownership structure ... 295.2 Correlation and regression analysis ... 30
5.3 Multicollinearity ... 32
6.
Conclusion ... 33
7.
Discussion ... 34
iii
Tables
Table 1 - List of HC and IC literature ... 6
Table 2 - Sample distribution ... 16
Table 3 - Definitions of variables ... 18
Table 4 - Definitions of items ... 19
Table 5 - Descriptive statistics of variables ... 23
Table 6 - Descriptive statistics of Ownership structure ... 24
Table 7 - Company type of the largest shareholder ... 24
Table 8 - Disclosure items divided into country level ... 24
Table 9 - Disclosure for individual items ... 25
Table 10 - Pearson correlation table ... 26
Table 11 - Regression Model 1 ... 27
Table 12 - Regression Model 2 ... 28
Equations
Equation 1 - LinkedIn_HCDisc – calculation of companies HC disclosure .. 20Appendix
Appendix 1 – List of sample companies ... 451
1. Introduction
1.1 Background
The relationship between companies and their stakeholders, investor relations, has previously only been done through a section on thecompanies´ webpages and the annual reports. This format, while informative, is typically static, and does not allow active, real-time communication between investors and corporations (Von Alberti-Alhtaybat & Al-Htaybat, 2016). Over the last decade, social media and social network sites have had a significant impact on how companies interact with individuals and other stakeholders (Pisano, Lepore, & Lamboglia, 2017). Social network sites represent a new wave of internet applications and sites, built on interactive Web 2.0 technology (Kaplan & Haenlein, 2010). Web 2.0 are defined as platforms or sites, which have functions that allow users to interact, collaborate and generate content, instead of being a passive viewer (Kaplan & Haenlein, 2010).
The increased interactivity provided by social network sites have made it one of the most important communication tools to provide information (Miller & Skinner, 2015). The main communication channels when companies want to share information with shareholders and capital markets are social media platforms like Facebook, Instagram and LinkedIn (Miller & Skinner, 2015). It has changed the way companies, in a more effective manner, can capture the attention of potential shareholders and other stakeholders (Von Alberti-Alhtaybat & Al-Htaybat, 2016).
Previous research has shown that social media has had greater scope than conventional online media, which according to Luo, Zhang and Duan (2013), creates greater value and might reduce information asymmetry. Among the largest social network sites, LinkedIn is a site with another approach than for example Facebook and Twitter. The focus of LinkedIn, from a company´s perspective, is to connect with professionals and potential future employees (LinkedIn Corporation, 2019; Bonsón & Bednárová, 2013).
In interactions on LinkedIn, the focus is on non-financial disclosure, mainly human capital (HC) (Pisano et al., 2017). For example, working environment, education and
2
knowledge becomes an important matter on LinkedIn (Pisano et al., 2017).According to Heery and Noon (2017), the definition of HC is
The stock of knowledge, skills, and abilities that determine the labour productivity of an individual. Investment in human capital through education and training can increase the stock, and such investment is one of the sources of economic growth. (Heery & Noon, 2017).
A key factor in the value-creation process of a company for shareholders is HC information (Chen & Lin, 2003). Companies disclose HC information to stakeholders in order to motivate decisions regarding financial capital and to explain the link between HC and company performance (Pisano et al., 2017).
HC has been a highly investigated topic, and in order to understand HC disclosure, it has often been investigated in a context with corporate governance (Prado-Lorenzo, Gallego-Alvarez, & Garcia-Sanchez, 2009; Patelli & Prencipe, 2007; Maury & Pajuste, 2005). The ownership structure of a company is a corporate governance mechanism, especially when a high level of ownership concentration exists (Connelly, Hoskisson, Tihanyi, & Certo, 2010). What type of disclosure is another factor affected by ownership structure in a company (Chau & Gray, 2002). Furthermore, previous research has examined different corporate disclosure in connection with ownership structure and how companies have adapted their disclosures in social media (Hidalgo, Garcìa-Meca, & Martìnez, 2011; Eng & Mak, 2003; Chau & Gray, 2002; Luo et al., 2013). To explain the corporate governance mechanism and corporate disclosures, previous research has found two prominent theories, agency theory and legitimacy theory (Cerbioni & Parbonetti, 2007; Bonsón & Bednárová, 2013).
1.2 Problem
Previous research in the area of HC disclosure on social network sites have widely been examined during the last decade (Cuozzo, Dumay, Palmaccio, & Lambardi, 2017). The focus has been on Facebook and Twitter, whereas LinkedIn has received little attention within this research area (Pisano et al., 2017). The study made by Pisano et al. (2017) is the only research that has investigated the relationship between corporate ownership
3
structure and HC disclosure on LinkedIn. However, their study only investigated companies in the southern Europe.
Comparing countries in the southern part of Europe with countries in the Nordic part of Europe, there are differences in how well developed in digitalization the countries are. Sweden stands as leader in the use of digital technology and has the highest value added produced by the information and communication technology among OECD countries (OECD, 2018). The Nordic countries, Sweden and Norway, have a strategy called “industry 4.0” with the aim to enhance the integration of digital technology (Belényesi, 2015).
Since the Nordic countries are more digitalized than southern Europe countries this report will investigate and seek to understand how ownership concentration affect the level of HC disclosure in more digitalized countries. This study will therefore contribute to existing literature in the area of corporate disclosure and ownership structure on LinkedIn. According to agency theory, companies with high ownership concentration will disclose less information, since a large shareholder typically has the information they need (Cormier, Magnan, & Van Velthoven, 2005).
1.3 Purpose
This paper consists of two purposes. The first purpose is to investigate HC disclosure made by companies in Sweden and Norway via LinkedIn. Analysing LinkedIn pages by these companies leads to the second purpose, which is to investigate the relationship between human capital disclosure and ownership concentration in the Swedish and Norwegian market. Therefore, the hypothesis for this report will be:
H1: A negative relationship exists between ownership concentration and the level of HC disclosure via LinkedIn.
This paper will contribute to existing research that focus on other medias. LinkedIn is a social media, which has had low research attention. Only one previous paper has had LinkedIn as the major focus area, when investigate human capital disclosure. Therefore, this study will provide a deeper understanding of how companies use LinkedIn. From
4
those insights, companies could then grade their own disclosures and improve their management of different corporate disclosures on social media.
1.4 Outline
The chapters in this study are structure in the following way. The next chapter consist of previous research and literature regarding HC disclosure, LinkedIn and ownership concentration. In the same chapter, theoretical background connected to these topics are presented. The next chapter explains the sample selection and method. This is followed the presentation of the findings and result of regression analysis. Finally, the last three chapters consist of the analysis, conclusion and discussion.
5
2. Literature Review and Theoretical Framework
2.1 HC Disclosure
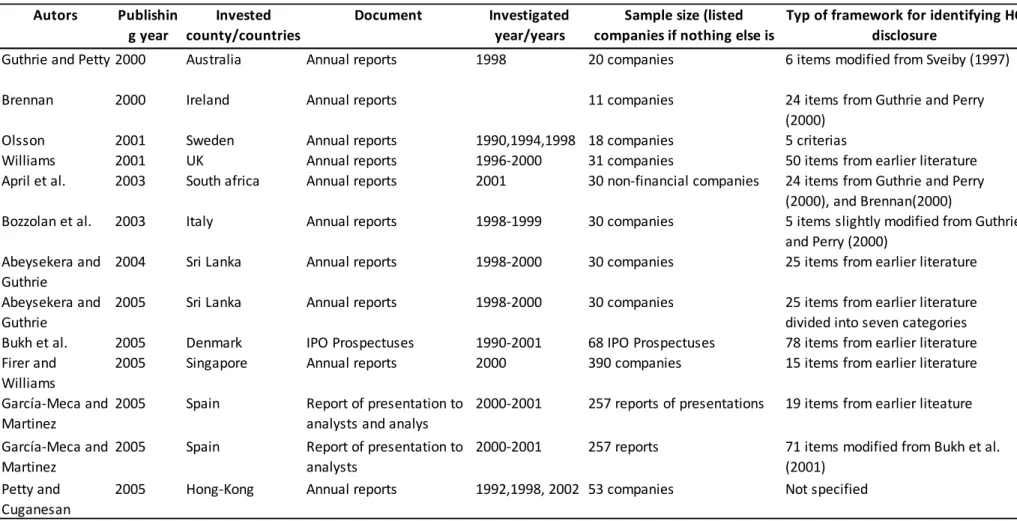
To understand the value of a company, market value and book value are two ways to valuate a company. The difference between those values has previously been difficult for managers of a company to understand and explain. Goodwill (i.e. trademarks and patents) was therefore used to explain this difference (Bart, 2001). However, in the late 1990s, goodwill was not considered sufficient and new factors explaining the differences were recognized, which were identified as intellectual capital assets (IC) (Brennan & Connell, 2000; Bozbura, 2004). Sveiby (1997) categories IC into three components, individual competence (i.e HC, employees´ capacity to act in a variety of situations to create both tangible and intangible assets), internal structure (i.e intellectual property, models, procedure created by employees but owned by the firm) and external structure (i.e relationships with customers and suppliers). Previous research states that HC is important and a value component of the three IC categories, and is consistently considered a key component in the value-creation process of a company (Bozbura, 2004; Claver-Cortes, Zaragoza-Saez, Molina-Manchon, & Ubeda-Garcia, 2015; Chen & Lin, 2003; Chen & Lin, 2004; Gamerschlag, 2013; Massingham, Nguyet Que Nguyen, & Massingham, 2011; Petty & Guthrie, 2000). The disclosed HC information has been limited, even though researchers has pushed companies to gather knowledge about their HC (Chen & Lin, 2004; Milost, 2007). This would generate more accurate accounting statements and value employees’ contribution at an appropriate level (Chen & Lin, 2004; Milost, 2007). Early research within IC and HC has led to a variety of models, with the aim to complement the information by financial reports, by making previous unknown intangibles visible and measurable (Ordonez de Pablos, 2002). Example of those models includes Kondrad Group´s Invisible Balance Sheet (Sveiby & Annell, 1989), Sveiby´s intangible Assets Monitor (Sveiby, 1997),The Scandia Navigator (Edvinsson & Malone, 1997), the Balanced Scorecard (Kaplan & Norton, 1992) and IC-Index (Roos, Roos, Dragonetti, & Edvinsson, 1997).
6 Table 1 - List of HC and IC literature
Autors Publishin g year Invested county/countries Document Investigated year/years
Sample size (listed companies if nothing else is
stated)
Typ of framework for identifying HC disclosure
Guthrie and Petty 2000 Australia Annual reports 1998 20 companies 6 items modified from Sveiby (1997) Brennan 2000 Ireland Annual reports 11 companies 24 items from Guthrie and Perry
(2000) Olsson 2001 Sweden Annual reports 1990,1994,1998 18 companies 5 criterias
Williams 2001 UK Annual reports 1996-2000 31 companies 50 items from earlier literature April et al. 2003 South africa Annual reports 2001 30 non-financial companies 24 items from Guthrie and Perry
(2000), and Brennan(2000)
Bozzolan et al. 2003 Italy Annual reports 1998-1999 30 companies 5 items slightly modified from Guthrie and Perry (2000)
Abeysekera and Guthrie
2004 Sri Lanka Annual reports 1998-2000 30 companies 25 items from earlier literature Abeysekera and
Guthrie
2005 Sri Lanka Annual reports 1998-2000 30 companies 25 items from earlier literature divided into seven categories Bukh et al. 2005 Denmark IPO Prospectuses 1990-2001 68 IPO Prospectuses 78 items from earlier literature Firer and
Williams
2005 Singapore Annual reports 2000 390 companies 15 items from earlier literature García-Meca and
Martinez
2005 Spain Report of presentation to analysts and analys reports
2000-2001 257 reports of presentations 19 items from earlier liteature García-Meca and
Martinez
2005 Spain Report of presentation to analysts
2000-2001 257 reports 71 items modified from Bukh et al. (2001)
Petty and Cuganesan
7 Table 1 - List of HC and IC literature
Autors Publishin g year Invested county/countries Document Investigated year/years
Sample size (listed companies if nothing else is
stated)
Typ of framework for identifying HC disclosure
Bozzolan et al. 2006 Italy, UK Annual reports 60 companies 22 items fron Guthrie and Petty (2000)
Olivieira et al. 2006 Portugal Management reports and Chairman letters
2003 56 companies 10 items from earlier literature Cerbioni and
Parbonetti
2007 European countries
Operating and financial reviews
2002-2004 54 Biotech companies 5 items modified from Sveiby (1997) Sujan and
Abeysekera
2007 Australia annual reports 2004 20 companies 7 items from Guthrie et al. (1999) White et al. 2007 Australia Annual reports 2005 96 biotech companies 708 items from Bukh et al. (2005) Abeysekera 2008 Sri Lanka Annual reports 2001-2002 30 companies 25 items from earlier literature
divided into seven categories Li et al. 2008 UK Annual reports 2004-2005 100 companies 25 items from earlier literature Singh and Van
der Zahn
2008 Singapore IPO Prospectuses 1997-2006 444 IPO companies 81 items from earlier literature Whiting and
miller
2008 New Zeeland Annual reports 2003 70 companies 18 items from Guthrie et al. (2004) Cormier et al. 2009 Canada Websites 2005 131 companies 16 items from earlier literature Kahn and Kahn 2010 Bangladesh Annual reports 2007-2010 32 manfacturing and service
companies
20 items from earlier literature Cinquini et al. 2012 Italy Sustainability reports 2005-2006 37 companies 24 indicators grouped in 4 items from
earlier literature
Husein et al. 2012 Malaysia Annual reports 2008 30 companies 50 indicators grouped in 8 items from earlier literature
8 Table 1 - List of HC and IC literature
Autors Publishin g year Invested county/countries Document Investigated year/years
Sample size (listed companies if nothing else is
stated)
Typ of framework for identifying HC disclosure
Lin et al. 2012 Taiwan Annual reports 2006 660 companies 40 keywords modified from Vergauwen et al. (2007) Gamerschlag 2013 Germany Annual reports 2005-2007 130 companies 27 keywords, grouped in three
categories from Möller et al. (2011) Liao et al. 2013 China Annual reports 2009 50 companies 2 items from earlier literature De Silva et al. 2014 New Zeeland Annual reports 2004,2007,2010 10 companies 8 items modified from Abeysekera
(2008) Pisano 2015 Italy Management discussion
and analysis
2008-2009 7 companies 11 items from from new legal
requirements and the guidance of the Italian professional standards setters Pisano et al. 2017 Italy, France and
Germany
Linkedin website 2015 30 companies 9 items from earlier literature Garanina and
Dumay
2017 USA IPO Prospectuses 2002-2013 151 IPO prospectuses 79 items from earlier literature Hay et al. 2018 Libanon Annual reports 2015-2017 48 companies 25 items from earlier literature Maji and
Goswami
9
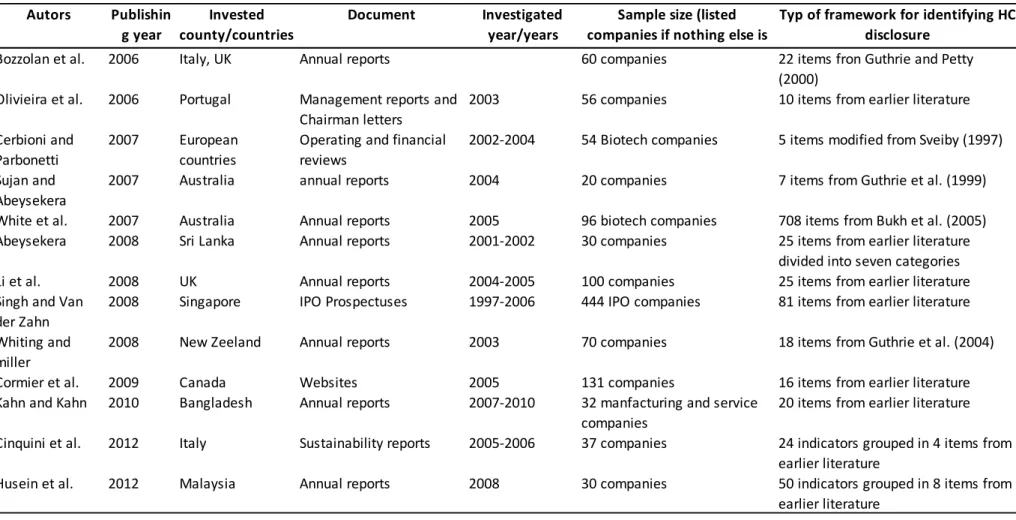
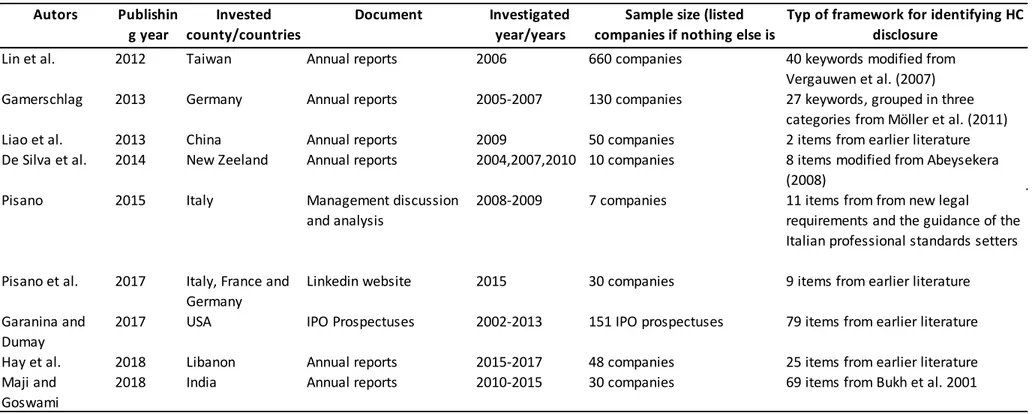
The Scandia Navigator and the Balanced Scorecard are well recognized (Asanga Abhayawansa, 2014). The Scandia Navigator is a measurement model, which combines numerical indicators, visuals or diagrams and narratives to create an account of firm value creation (Andriessen, 2004). The balanced scorecard is a value-measurement, making financial and non-financial goals in measurable procedures (Kaplan & Norton, 1992). In recent years, research has changed focus towards investigating IC and HC disclosures by individual companies, which means investigating the release of previous unknown or not disclosed information (Dumay, 2016; Pisano et al., 2017). Pisano et al. (2017) made a collection of studies, which investigated and analysed the level of IC and HC disclosure, both regulated and voluntarily disclosures (Table 1).
Previous literature focusing on IC disclosure have aimed towards annual reports or certain specific parts of the report with different disclosure items. Furthermore, earlier research has been studying and analysing a long list of countries and different documents, in order to get insight in IC and HC disclosures (Table 1). Examples of those different focus areas are, Garcia-Meca (2005), and Garcia-Meca and Martinez (2005), who investigated reports of presentations to financial analysts. Another study by Oliviera et al. (2006) focused on the management discussion and analysed the chairman´s letter. Additional studies have studied sustainability reports (Cinquini, Passetti, Tenucci, & Frey, 2012)or IPO prospectuses (Bukh, Nielsen, Gormsen, & Mouritsen, 2005; Garanina & Dumay, 2017; Singh & Van der Zahn, 2008). A smaller number of papers have investigated the company’s websites (Cormier, Aerts, Ledoux, & Magnan, 2009) or certain social media (Pisano et al., 2017). There exist studies from the whole world that have investigated IC and HC disclosure, for example Lin, Huang, Du & Lin (2012) in Taiwan, Gamerschlag (2013), in Germany, De Silva, Stratford and Clark (2014) in New Zealand, Pisano et al. (2017) in Italy, France and Germany, and Maji and Goswami (2018) in India. These studies range from investigating one or more countries in a comparable setting to a more international perspective. Most research regarding HC information have been made around or after 2010 (Pisano et al. 2017). For example, Abeysekera (2008),Gamerschlag (2013), Khan and Khan (2010), Lin et al. (2012), Pisano et al. (2017) and Hay, Ragab and Hegazy (2018). Most of the previously mentioned literature has used the Sveiby model and conducted a content analysis, to analyse the IC or HC disclosure level of companies.
10
Previously literature has found the HC component to be the least frequently disclosed component of the three IC categories (Pisano et al., 2017). Pisano et al. (2017) investigated companies in three European countries, and found that 3 % of the companies did not disclose HC information. Furthermore, a study by Maji and Goswami (2018) in India, shows that companies that do not disclose HC information has been decreasing. It shows that between 2015 to 2017, the amount of Indian companies that did not disclose has changed from 45,25 % to 36,25 %. The level of HC disclosure has consistently been found to be disclosed on a lower level than the other two components in IC assets, the external structure and the internal structure (Pisano et al., 2017). Previous researchers have argued that the low level of HC disclosure may be due to lack of established and accepted frameworks (Petty & Guthrie, 2000). Another argumentation is the lack of perception by firms regarding their employees as a value driver (Garcia-Meca, 2005) or due to risk of such information being used by competitors (Bozzolan, Favotto, & Ricceri, 2003).
Abhayawansa and Abeysekera (2008) criticise the previous literature, as it does not account for human resource practices when developing disclosure indices, due to shortage in the frameworks used. By this argumentation Abhayawansa and Abeysekera (2008), argues that a low level of HC disclosure is a consequence of the shortage in the frameworks. To overcome this, Pisano et al. (2017) have included an additional category, human resource practices, which accounts for other factors than stock of knowledge and capabilities. Employees’ wellness is suggested to be a component of primary IC (Roslender, Stevenson, & Kahn, 2006). For example, Bontis and Fitz-enz (2002) findings display that training, and employee satisfaction affect HC positively. Other reason why a firm disclose HC information, can be to communicate the link between HC and the firm’s performance to investors (Abeysekera & Guthrie, 2004). Furthermore, Abeysekera (2008) argues that HC disclosure can be used to reduce the tension between a firm and their stakeholders, when motivating capital decisions.
2.2 LinkedIn
The increase of internet as a tool for corporate disclosure has grown in recent years (Pisano et al., 2017). A company´s website is used to communicate to stakeholders, releasing news and respond to problems (Kent & Taylor, 1998).The fast growth of Web
11
2.0 and social media, has driven companies to evolve and adapt new platforms for communication (Waters, Burnett, Lamm, & Lucas, 2009). Sites and social networks within Web 2.0 includes Facebook, Twitter, blogs and Wikipedias (Kaplan & Haenlein, 2010). Scholars have argued that it is possible to gain insight to IC from other than traditional sources, for example LinkedIn and Twitter (Cuozzo et al., 2017). The two-way communication tools, enabled by these platforms have made it a powerful and strategic way for companies to disclose IC, building long-term relationships and improving the communication with stakeholders (Dumay & Guthrie, 2017; Kaplan & Haenlein, 2010; Giacosa, Ferraris, & Bresciani, 2017).
Previous research on social media has focussed on general social media, for example Facebook (Zide, Elman, & Shahani-Denning, 2017). However, a few studies have investigated the use of LinkedIn in various areas by companies (Pisano et al., 2017). For example, Archambault and Grudin (2012)makes a study comparing LinkedIn and other social network sites. Another study by Basak and Calisir (2014) examine how users utilize LinkedIn. Moreover, scholars have investigated the extent of how LinkedIn profile provides realistic picture of entry-level jobs and career progression (Case, Gardinier, Rutner, & Dyer, 2012), and Witzig, Spencer and Galvin (2012) examined the use of LinkedIn between three types of organizations, non-profit organizations, large companies and small companies. They concluded that small businesses are more focused on using LinkedIn as a social media tool, rather than larger companies. The most recent study regarding LinkedIn, was made by Pisano et al. (2017), investigating the relationship between HC disclosure and ownership structure.
For recruitment, networking and career purposes, LinkedIn is considered the most popular and widely used social network sites (Pisano et al., 2017), which is supported by findings in previous studies (Caers & Castelyns, 2011; Fisher, McPhail, You, & Ash, 2014; Zide et al., 2017). Bonson and Bednarova (2013) suggest that the primary focus of LinkedIn is on a specific stakeholder group for disclosures, namely current and potential employees. A study by Briones, Kuch, Liu and Jin (2011) finds that social media are necessary, in order to improve the relationship with their stakeholders. Through the interactions that have been made possible by Web 2.0 and social media, companies seek to develop stakeholder relationships and increase timeliness of information (Dumay & Guthrie, 2017; Giacosa et al., 2017; Lovejoy, Waters, & Saxton, 2012; Waters et al.,
12
2009; Zerfass & Schramm, 2014). This leads to increased transparency and more detailed information provided to the market which may force companies to disclose more IC than their original situation (Bonsón & Flores, 2011; Lardo, Dumay, Trequattrini, & Russo, 2017). Additional studies, focusing on the financial situation of companies have argued that the usefulness of social media as a tool for disclosing financial and non-financial information to investors are important (Lee, Hutton, & Shu, 2015; Luo et al., 2013; Miller & Skinner, 2015). Investors decision to invest in a company are based on more than economic evaluations of the business, hence the corporate transparency and reliability of the management has received more attention (Pisano et al., 2017). Depending on the confidence by investors, a company will provide more disclosures, enabling effective monitoring by investors (Pisano et al., 2017). A company’s knowledge regarding how to communicate with the market, can give a competitive advantage (Miller & Skinner, 2015). This can, for example increase their ability to manage recall of products and stop misinformation. (Miller & Skinner, 2015). The pressure companies receive from the financial market force them, not only to disclose financial information, but also to disclose IC and HC information (Miller & Skinner, 2015).
Moreover, it can be said that social media has increased the information flow and the accessibility of information for stakeholders, which enables a dialogue between the parties (Pisano et al., 2017). Coe (2013) and Luo et al. (2013) found that companies use social media to influence investors, because investors tend to trust information release through social media. A study by Von Alberti-Alhtaybat and Al-Htaybat (2016) found that investor relation information through social media is perceived positive by investors. Social media is considered a new tool for investor relations, and give investors more opportunities to evaluate companies (Von Alberti-Alhtaybat & Al-Htaybat, 2016).
2.3 Ownership concentration and HC disclosure
The monitoring level shareholders can have on the management and companies’ voluntary disclosures are influenced by the ownership structure (Eng & Mak, 2003). Conflicts between management of a firm and shareholders have received attention by researchers, since the 1900s (Berle & Means, 1932). The agency theory by Jensen and Meckling (1976), is the most commonly used theory explaining the relationship between ownership structure and IC and HC disclosure (Bukh et al., 2005; Cerbioni & Parbonetti,
13
2007; Firer & Williams, 2005; Li, Pike, & Haniffa, 2008; Oliveira, Rodrigues, & Craig, 2006; Pisano et al., 2017). The ownership structure around the world differs, for example Europeans countries generally have high ownership concentration compared to the US (Pisano et al., 2017). In the agency theory, two types of agency problems exist, type 1 and type 2 agency problems. Type 1 is the conflict between managers and owners and type 2 is the conflict between controlling shareholders and minority shareholders (Fama & Jensen, 1983). Agency theory propose that firms with high concentrated ownership have less conflict between the principal and agent (Fama & Jensen, 1983). The agency theory suggests that firms with dispersed ownership disclose more information to mitigate this problem (Fama & Jensen, 1983).
Previous research has used other theoretical frameworks in explaining determinants, regarding IC and HC disclosures by firms. Those are the stakeholder theory, institutional and legitimacy theory. Bonson and Bednarova (2013) states that the use of these theories should not be seen as competing, but rather complementing each other. Stakeholders theory is based on the presumptions that a company in order to grow and survive, needs to create value for shareholders, through action and businesses that generate economic, social or political benefits to stakeholders (Shocker & Sethi, 1973). Foster and Jonker (2005), and Phillips, Freeman and Wicks (2003) argues that it is essential for a company’s existence and their profitability to consider and respect the interests of all stakeholders. Moreover, Freeman (1984) states that in the same context companies will try to disclose more information, in order to gain the approval by stakeholders. Researchers have studied the stakeholder theory, analysing the relationship between corporate social responsibility (CSR) and ownership structure (Prado-Lorenzo et al., 2009).They concluded that major stakeholders would have an impact on the information presented in the CSR report. The main concept of legitimacy theory consists of a company´s right to exist, if their values and actions are legitimized by society (Suchman, 1995). Suchman defines legitimacy as:
Legitimacy is a generalized perception or assumption that the actions of an entity are desirable, proper, or appropriate within some socially constructed system of norms, values, beliefs, and definitions. (Suchman, 1995, p. 574)
14
DiMaggio and Powell (2000) states that for a company to gain legitimacy, companies incorporate external norms and rules from society in their operations. This is achieved by companies through actions towards society, in order to acquire legitimacy (Suchman, 1995). Those actions can for example be to disclose more and better information to gain legitimacy (DiMaggio & Powell, 2000). Even though a company once has gained legitimacy, there is still an ongoing challenge to maintain it (Suchman, 1995). If a company's legitimation is damaged by, for example bad actions by managers, it will require the company to dedicate at least as much resources to repair the damaged legitimacy, as it would be acquiring it from the beginning (Suchman, 1995).
According to Pisano et al. (2017) agency theory is the most relevant theory to use when investigating the relationship between ownership concentration and HC disclosure. The separation of ownership and control between agents and principals in agency theory, might generate conflicts between shareholders and management or the dominant shareholders (Fama & Jensen, 1983). These conflicts can emerge due to differences in acceptable risk or investment preferences between management or dominant shareholders and other shareholders (Firer & Williams, 2005; Vafeas & Theodorou, 1998). Researchers have found that voluntary disclosure and other different mechanisms that monitor the behaviour of management or dominant shareholders have importance, in order to reduce conflicts and maintain control by the principal (Frankforter, Berman, & Jones, 2000; Ho & Wong, 2001; Jensen & Meckling, 1976). By applying voluntary disclosures to the type 1 agency problem, shareholders can effectively monitor whether their economic interests are optimized, and that management acts in their best interest (Fama & Jensen, 1983)
Fama and Jensen (1983) states that the level of monitoring is dependent by the level of ownership concentration, a higher concentrated ownership requires less monitoring expenses. Previous studies suggest that a negative relationship between ownership concentration and voluntary disclosure exists (Brammer & Pavelin, 2006; Chau & Gray, 2002; Cormier et al., 2005; Patelli & Prencipe, 2007). Other studies investigating the relationship between ownership structure and IC or HC disclosure has found the same negative relationship (Firer & Williams, 2005; Li et al, 2008; Oliveira et al., 2006; Pisano et al., 2017). This relationship can exist due to the presumption that a dominant shareholder has the power and possibility to obtain any information they need (Brammer
15
& Pavelin, 2006; Chau & Gray, 2002; Cormier et al., 2005; Patelli & Prencipe, 2007). Contradictory, a few studies have found a positive relationship between ownership concentration and disclosure (McKinnon & Dalimunthe, 1993; Mitchell, Chia, & Loh, 1995; Schadewitz & Blevins, 1998). Studies investigating environmental reporting and ownership have found ownership structure negatively affecting disclosures (Brammer & Pavelin, 2006; Cormier et al., 2005).
Cormier et al. (2005) states that firms with a higher level of concentrated ownership have less information asymmetry between the agent and principal. This is in accordance with agency theory, which argues that, to reduce agency cost and information asymmetry, firms with low ownership concentration experience more pressure to have a higher level of disclosure (Li et al., 2008; Raffournier, 1995).
A study within OECD countries shows that there is a difference in how well developed in digitalization the countries are. Sweden stands as leader in the use of digital technology and has the highest value added produced by the information and communication technology among OECD countries (OECD, 2018). The Nordic countries, Sweden and Norway, have a strategy called “industry 4.0” with the aim to enhance the integration of digital technology (Belényesi, 2015). Concluding, the literature review, IC and HC disclosure is an area that has been thoroughly examined by scholars. At the same time as the usage of internet has increased, it has enabled a new way of communicating and disseminating information to different stakeholders. Studies have investigated different aspect of those new networks, but LinkedIn as a tool has received very little attention. Combining LinkedIn with proposed theories and studies regarding ownership structure and level of disclosure, which leads to the following hypothesis:
H1: A negative relationship exists between ownership concentration and the level of HC disclosure via LinkedIn.
16
3. Method
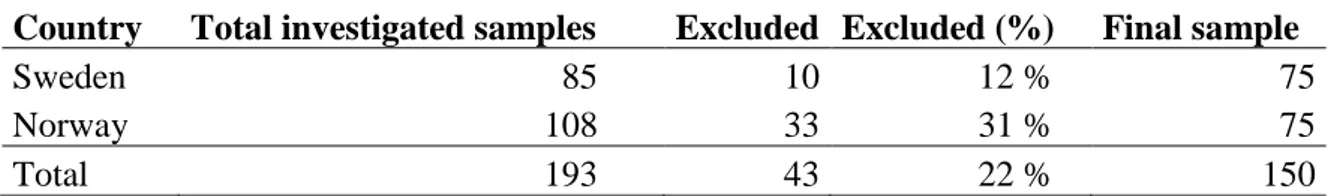
The sample for this study consisted of 150 listed companies from Sweden and Norway. The 75 largest listed companies ordered by market capitalization were selected from each of the countries. The process of compiling a list of companies was performed 7:th of January 2019. Since this study is focusing on LinkedIn, companies without a LinkedIn page were excluded. Furthermore, financial companies and a few investment fund companies were also excluded, because financial data were unavailable.
The final sample therefore consisted of the largest, on the Swedish market, listed company until the 85:th largest company by market capitalization (Appendix 1). Hence, in Sweden 10 companies were excluded, as they did not meet the prerequisites. In Norway, the range were from the largest up until the 108:th largest company (Appendix 1). The reason for a larger drop-off in Norway depends on the larger amount of financial companies.
Table 2 - Sample distribution
Country Total investigated samples Excluded Excluded (%) Final sample
Sweden 85 10 12 % 75 Norway 108 33 31 % 75 Total 193 43 22 % 150 The financial data was collected from the Orbis database. The financial data was obtained from companies’ annual reports of 2017. The reason to have data retrieved from 2017 was since only a few companies had released their annual reports for the fiscal year 2018. Furthermore, annual reports were used to collect data on ownership structure and the largest shareholders. By analysing LinkedIn pages from each company, data on HC disclosures were gathered. The analysis on LinkedIn consisted of the sections Home, About, Life and Jobs. Regarding the Home section, a limit was set, only analysing posts within a time-span of four weeks. The analysis of the LinkedIn pages was completed between February, up until Mars 2019. A key word search on Scopus was performed, to search for literature regarding IC and HC disclosure published after Pisano et al. (2017) and then they were included in table 1. The key words used were “Intellectual capital”, “Human Capital”, “Disclosure” and “Reporting”.
17
3.1 Measure Independent and control variables
To conduct theresearch, a regression analysis was performed, which included dependent, independent, control, and dummy variables. First, the dependent variable in the model was HC disclosure on LinkedIn (LinkedIn_HCDisc). Through content analysis of the sample companies LinkedIn pages, data for the dependent variable was collected. Content analysis is a widely used research method to measure disclosure of IC and HC (Guthrie, Petty, Yongvanich, & Ricceri, 2004; Maji & Goswami, 2018; Pisano et al., 2017; Singh & Kansal, 2011). This method assigns codes to qualitative or quantitative data into pre-defined categories based on certain criteria's, which might be a disclosure list or disclosure index (Krippendorff, 2013). The definition of content analysis is:
Content analysis is a research technique for making replicable and valid inferences from test (or other meaningful matter) to the contexts of their use. (Krippendorff, 2013, p. 24)
Through this method, it is possible to find patterns in disclosed information provided from companies, for example from LinkedIn or annual reports (Cuozzo et al., 2017; Dumay, 2014; Dumay & Guthrie, 2017; Guthrie et al., 2004). The analysis used a single information source, LinkedIn to provide a more accurate and reliable analysis (Cormier et al., 2009; Striukova, Unerman, & Guthrie, 2008).
To apply the content analysis in this study, a coding procedure was introduced. Before the coding, the disclosure items had to be identified. The identified HC disclosure items were based from previous research in IC and HC disclosures (Table 3).
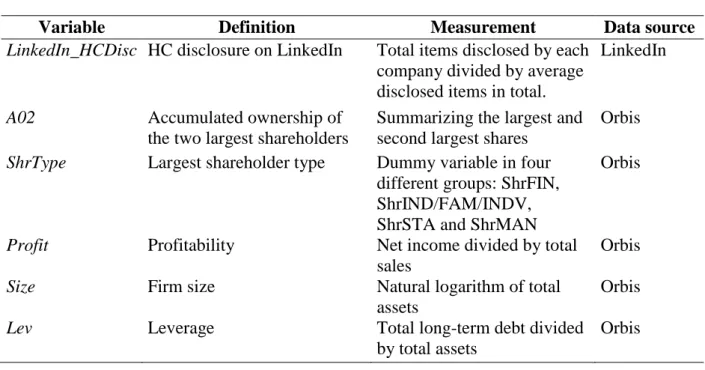
18 Table 3 - Definitions of variables
Variable Definition Measurement Data source
LinkedIn_HCDisc HC disclosure on LinkedIn Total items disclosed by each company divided by average disclosed items in total.
A02 Accumulated ownership of
the two largest shareholders
Summarizing the largest and second largest shares
Orbis ShrType Largest shareholder type Dummy variable in four
different groups: ShrFIN, ShrIND/FAM/INDV, ShrSTA and ShrMAN
Orbis
Profit Profitability Net income divided by total sales
Orbis Size Firm size Natural logarithm of total
assets
Orbis
Lev Leverage Total long-term debt divided
by total assets
Orbis
Based on earlier literature, nine HC disclosure items were thereby identified, which were divided in two categories, the stock of knowledge and capabilities and the human resource management practices (Pisano et al., 2017). HC items included in the stock of knowledge and capabilities were Employee-related measurements, Education and Know-how and experience. In the category Human Resource Management practices, Recruitment, Training, Career development, Welfare and motivation, Health and safety and Union activity were included (Table 4).
19 Table 4 - Definitions of items
HC disclosure item Definition and examples of information
Stock of knowledge and capabilities Employee-related
measurement
Number of employees, gender distribution of employees, employees per division, revenue per employee.
Education Education of management and the board members and education by regular employees.
Know-how and experience Expertise of employees, experience within the company, knowledge by employees and special competences they are looking for.
Human resources management practices
Recruiting Job descriptions/requirements.
Training Training policies, trainee programs, possible education within the company.
Career development Description of development procedures and possible internal promotion.
Welfare and motivation Salaries, pension systems, remuneration systems, share option schemes, employee satisfaction and employee motivation. Health and safety Safety policies and number of accidents.
Union activity Trade union activities.
Recording units in the content analysis were sentences, because they are more reliable than word count (Gray, Kouchy, & Lavers, 1995; Guthrie et al., 2004; Milne & Adler, 1999). Each unit of analysis on the sample companies LinkedIn were analysed individually. If a HC disclosure item was found in a sentence, a score of 1 was given, and a score of 0 was recorded if no items were identified. In those cases, when a HC disclosure item was disclosed multiple times, it was only counted once.
In the methodology of content analysis, it is important to test for reliability (Dumay & Cai, 2015). However, only a minority of the previous research in IC and HC disclosure has been found to include a coder reliability test (Dumay & Cai, 2015). To verify the reliability and accuracy of the coding process, the two coders performed a coding test (Guthrie et al., 2004; Striukova et al., 2008). First, the coders defined a set of coding rules. Each coder analysed a sample of twenty companies, ten from each investigated country,
20
individually. The differences in the coding were discussed, and a final coding procedures was defined.
The level of HC disclosure was calculated by taking the sum of disclosure items for each firm, within a range of zero to nine. The sum was then divided by the average of total items disclosed and assigned to LinkedIn_HCDisc. The benefit of calculating LinkedIn_HCDisc for each of the sample companies, was that it made it possible to rank and compare them.
Equation 1 - LinkedIn_HCDisc – calculation of companies HC disclosure
𝐿𝑖𝑛𝑘𝑒𝑑𝐼𝑛_𝐻𝐶𝐷𝑖𝑠𝑐𝑖 = ∑ 𝐼𝑡𝑒𝑚𝑠
𝑖 𝑎𝑣𝑒𝑟𝑎𝑔𝑒 𝑖𝑡𝑒𝑚𝑠 150
𝑖=1
The independent variable ownership concentration, named A02, consisted of the accumulated ownership of the largest and the second largest shareholders (Pisano et al., 2017). More specifically, A02 measures the percentage of owned shares. Previously, only one study by Pisano et al. (2017) has used ownership concentration as an independent variable. To interpret A02, a higher value means that a firm is owned to a high degree by two shareholders (Pisano et al., 2017).
The control variables which previous research have identified to affect the HC disclosure, were firm size, leverage, profitability and shareholder type (Table 3) (Pisano et al., 2017; Cuozzo et al., 2017; Rimmel, Nielsen, & Yosano, 2009). An earlier study by Hossain, Perera and Rahman (1995) predicted that larger firms provide more information to their stakeholders, due to demand by investors. Furthermore, this leads to lower cost for collecting and disseminating information for larger firms compared to smaller firms. This is in conjunction with findings by Pisano et al. (2017), that the prediction regarding firm size (Size) is positive correlated with LinkedIn_HCDisc. Since Size has been confirmed by previous studies to have a positive impact, it was tested as a control variable in the regression model.
Leverage (Lev) was the second control variable included in the model, calculated as the long-term debt over total assets. According to Jensen and Meckling (1976) and Chow and Wong-Boren (1987), firms with high leverage sustain high monitoring cost, which can be
21
reduced by a higher level of disclosure. With high leverage, higher demand for information by short-term and long-term creditors exists (Chow & Wong-Boren, 1987). Furthermore, findings by Pisano et al. (2017), supports the prediction that a positive correlation between leverage and HC disclosure exist. Moreover, profitability was included as a control variable. This is, because firms with high profitability could have incentives for more corporate disclosures, to highlight the firm’s good performance (Raffournier, 1995). In addition, previous studies have concluded that profitability has a significant correlation with IC and HC disclosure (Ferriera, Branco, & Moreira, 2012; Pisano, Lepore, & Lamboglia, 2017). Therefore, the model assumes a positive and significant correlation with profitability.
Following Pisano et al. (2017), shareholder type (ShrType) was included as a dummy variable, to get a better understanding of the effect the largest shareholder type has on corporate disclosure. Included were four different shareholder identities, which were identified by Pisano et al. (2017) through previous literature in IC and HC. The shareholder types were, financial company (ShrFin), industrial company or other public listed company, family or individual owned company (ShrInd/Fam/Indv), the state or public authority (ShrSta), and employee or director (ShrMan).
To complete the regression analysis, a number of control variables were included. Control variables were included, only if they had an impact on the dependent variable, which follows previous procedures in studies regarding HC and IC disclosure (Bozzolan et al., 2003; Bukh et al, 2005; Cuozzo et al., 2017; Garcia-Meca & Martinez, 2005; Rimmel et al., 2009; Williams, 2001). This regression model (Model 1) excludes the independent variable, in order to test the impact of the control variables.
Thereby, the following regression models were developed:
1. LinkedIn_HCDisc=α+β11°ShrType+β2Profit+β3Size+β5Lev+ε (Model 1) Since model 1 will test the association between control variables and the dependent variable, another model was developed, which include the independent variable. The two different regression models were tested to understand the findings and the variables association with each other.
22
2. LinkedIn_HCDisc=α+β1A02+β21°ShrType+β3Profit+β4Size+β5Lev+ε (Model 2)
23
4. Findings
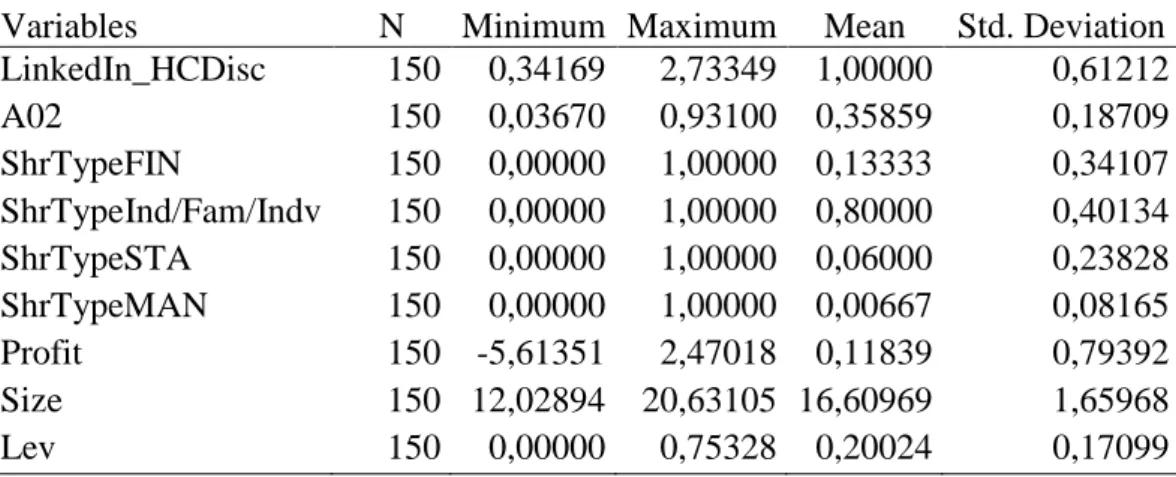
4.1
Descriptive statisticsThe descriptive statistics for our study (Table 5), shows the minimum, maximum, mean and standard deviation for each variable. The minimum and maximum for the variable LinkedIn_HCDisc, were between 0,34 to 2,73, and had a mean of 1,00. The observed spread of A02 differs between 36,70 % (minimum) and 93,10 % (maximum). The average ownership percentage for the two largest shareholders combined in the sample are 35,86 % (Table 5).
Table 5 - Descriptive statistics of variables
Variables N Minimum Maximum Mean Std. Deviation
LinkedIn_HCDisc 150 0,34169 2,73349 1,00000 0,61212 A02 150 0,03670 0,93100 0,35859 0,18709 ShrTypeFIN 150 0,00000 1,00000 0,13333 0,34107 ShrTypeInd/Fam/Indv 150 0,00000 1,00000 0,80000 0,40134 ShrTypeSTA 150 0,00000 1,00000 0,06000 0,23828 ShrTypeMAN 150 0,00000 1,00000 0,00667 0,08165 Profit 150 -5,61351 2,47018 0,11839 0,79392 Size 150 12,02894 20,63105 16,60969 1,65968 Lev 150 0,00000 0,75328 0,20024 0,17099
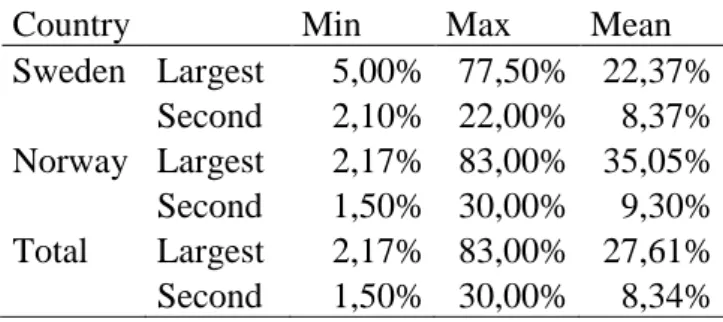
Table 6 shows the specific ownership structure in the sample, where the ownership of the largest shareholders (second largest shareholders) ranges from 2,17 % (1,50 %) to 83,00 % (30,00 %). Furthermore, the mean for the largest shareholders (second largest shareholders) are 27,61 % (8,34 %).
The largest shareholders (second largest shareholders) for companies in Sweden have an ownership ranging from 5,00 % (2,10 %) to 77,50 % (22,00 %) (Table 6). The same range for companies in Norway are 2,17 % (1,50 %) to 83,00 % (30,00 %). The mean for the largest shareholders (second largest shareholders) for companies in Sweden and Norway are 22,37 % (8.37 %) respectively 35,05 % (9,30 %).
Table 7 shows the ownership composition among the investigated companies. Of the 150 investigated companies, 36 (24 %) had a financial company as the largest shareholder, 104 (69 %) companies had either an industrial-, family- or an individual owned company
24
as the largest shareholder. Nine (6 %) companies had the state as the largest shareholder and just one (1 %) had an employee or manager within the company as largest shareholder.
Table 6 - Descriptive statistics of Ownership structure
Table 7 - Company type of the largest shareholder
Number of companies % of total
FIN 36 24% Ind/Fam/Indv 104 69% STA 9 6% MAN 1 1% Total 150 100% Based on the disclosure grid, which includes the nine HC items (Table 4), the maximum
outcome of disclosed items was 1350, with 675 in Sweden and 675 in Norway (Table 8). In total, 438 of 1350 (32,44 %) items were disclosed. Table 8, shows that 282 items of 675 (41,78 %) were disclosed in Sweden. In Norway the result was 156 of 675 (23,11 %). A comparison between the investigated countries shows that the number of disclosed items were 126 more in Sweden compared to Norway, and stands for 64,38 % of the total disclosed items.
Table 8 - Disclosure items divided into country level
Possible disclosure 1350 Possible disclosure/country 675 Sweden 282 41,78% Norway 156 23,11% Total disclosure 438 32,44%
Country Min Max Mean
Sweden Largest 5,00% 77,50% 22,37% Second 2,10% 22,00% 8,37% Norway Largest 2,17% 83,00% 35,05% Second 1,50% 30,00% 9,30% Total Largest 2,17% 83,00% 27,61% Second 1,50% 30,00% 8,34%
25
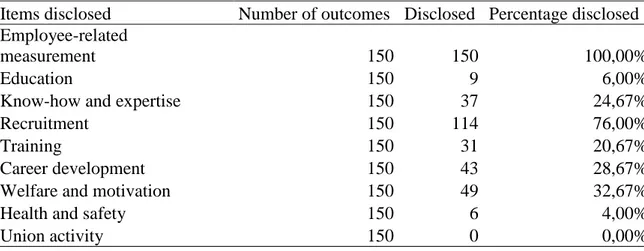
The possible number of disclosures for every item were 150, 75 companies from Sweden and 75 companies from Norway. The highest disclosure item, Employee-related measurement, was disclosed in 150 (100 %) of the investigated companies. Union activity, the least disclosed item, was found in zero (0 %) of the companies. The other items disclosed were as follows from the largest to smallest (in percentage): Recruitment (76 %), Welfare and motivation (32,67 %), Career development (28,67 %), Know-how and expertise (24,67%), Training (20,67 %), Education (6 %) and Health and safety (4 %) (Table 9).
Table 9 - Disclosure for individual items
Items disclosed Number of outcomes Disclosed Percentage disclosed Employee-related
measurement 150 150 100,00%
Education 150 9 6,00%
Know-how and expertise 150 37 24,67%
Recruitment 150 114 76,00%
Training 150 31 20,67%
Career development 150 43 28,67%
Welfare and motivation 150 49 32,67%
Health and safety 150 6 4,00%
Union activity 150 0 0,00%
4.2 Pearson correlation
A Pearson correlation test was conducted for this study to investigate the linear relationship between different variables and understand the strength of those relationships. Pearson correlation coefficients can take values between -1 and +1, where values of either -1 or +1 indicates either a perfect negative or a perfect positive correlation. A value of zero indicates no correlation (Andersson, Sweeney, Williams, Freeman, & Shoesmith, 2014).
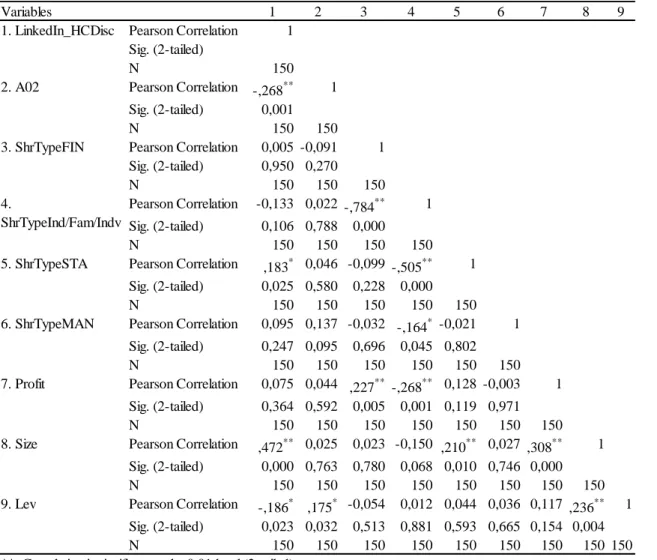
The result of the Pearson correlation test is shown in Table 10. The test was conducted with p-values of 0,05 and 0,01 (1 % respectively 5 % levels of significance). From table 10, two variables (A02 and Size) are significant correlated at p < 0,01 to the dependent variable LinkedIn_HCDisc, and at p < 0,05, Lev is significant correlated to the dependent variable. Moreover, the Pearson correlation test shows that no other variable is significantly correlated to the dependent variable.
26 Table 10 - Pearson correlation table
4.3 Regression analysis
Table 11 and 12 presents a summary of the results by the regression analysis. The result from the regression analysis of Model 1, shows that the variables firm size and leverage are statistically significant (p < 0,01). The regression analysis of model 2 shows statistical significance for the same variables, size and leverage (p < 0,01). Model 2 also shows that the independent variable A02 is statistically significant (p < 0,01). However, the variable profitability and the dummy variables for ownership composition are not found to be statistically significant in either model (Table 11 & 12). Both of the regression models are found to be significant.
To understand the association between the intercept and the control variables, the standardized beta (Beta) coefficient can be used. The standardized beta coefficient allows
Variables 1 2 3 4 5 6 7 8 9 Pearson Correlation 1 Sig. (2-tailed) N 150 Pearson Correlation -,268** 1 Sig. (2-tailed) 0,001 N 150 150 Pearson Correlation 0,005 -0,091 1 Sig. (2-tailed) 0,950 0,270 N 150 150 150 Pearson Correlation -0,133 0,022 -,784** 1 Sig. (2-tailed) 0,106 0,788 0,000 N 150 150 150 150 Pearson Correlation ,183* 0,046 -0,099 -,505** 1 Sig. (2-tailed) 0,025 0,580 0,228 0,000 N 150 150 150 150 150 Pearson Correlation 0,095 0,137 -0,032 -,164* -0,021 1 Sig. (2-tailed) 0,247 0,095 0,696 0,045 0,802 N 150 150 150 150 150 150 Pearson Correlation 0,075 0,044 ,227** -,268** 0,128 -0,003 1 Sig. (2-tailed) 0,364 0,592 0,005 0,001 0,119 0,971 N 150 150 150 150 150 150 150 Pearson Correlation ,472** 0,025 0,023 -0,150 ,210** 0,027 ,308** 1 Sig. (2-tailed) 0,000 0,763 0,780 0,068 0,010 0,746 0,000 N 150 150 150 150 150 150 150 150 Pearson Correlation -,186* ,175* -0,054 0,012 0,044 0,036 0,117 ,236** 1 Sig. (2-tailed) 0,023 0,032 0,513 0,881 0,593 0,665 0,154 0,004 N 150 150 150 150 150 150 150 150 150 5. ShrTypeSTA 6. ShrTypeMAN
*. Correlation is significant at the 0.05 level (2-tailed). 7. Profit
8. Size
9. Lev
**. Correlation is significant at the 0.01 level (2-tailed). 1. LinkedIn_HCDisc
2. A02
3. ShrTypeFIN 4.
27
for comparing the strength of the effect of each individual variable to the dependent variable, regardless of their unit of measurement (Bring, 1994). In model 1, Beta for the statistically significant variables are 0,545 for firm size and -0,314 for leverage (Table 11). Different Beta for the significant variables in model 2 are -0,255 (A02), -0535 (Size) and -0,271 (Lev) (Table 12). Another measurement, which can be used to describe how well the data fit a curve or line, is the adjusted R square (adjusted R2). In model 1, the adjusted R2 is 30,9 % compared to 36,8 % in model 2.
Table 11 - Regression Model 1
Standardized
Beta Sig. Tolerance VIF
(Constant)a 0,000 Control variables ShrTypeInd/Fam/Indv -0,004 0,958 0,668 1,497 ShrTypeSTA 0,091 0,260 0,712 1,405 ShrTypeMAN 0,093 0,186 0,953 1,049 Profit -0,069 0,352 0,845 1,183 Size 0,545 0,000 0,836 1,196 Lev -0,314 0,000 0,936 1,069 Observations 143 R2 0,336 Adjusted R2 0,309
28 Table 12 - Regression Model 2
Standardized
Beta Sig. Tolerance VIF
(Constant)a 0,000 Independent variable A02 -0,255 0,000 0,942 1,061 Control variables ShrTypeInd/Fam/Indv 0,021 0,792 0,663 1,508 ShrTypeSTA 0,115 0,139 0,707 1,415 ShrTypeMAN 0,131 0,054 0,932 1,073 Profit -0,056 0,432 0,843 1,186 Size 0,535 0,000 0,835 1,198 Lev -0,271 0,000 0,910 1,098 Observations 142 R2 0,398 Adjusted R2 0,368
a. Dependent Variable: LinkedIn_HCDisc
4.4 Multicollinearity
In order to make the results from the regression models more reliable and avoid skewness, the variance inflation factors (VIF) were calculated to detect multicollinearity in both of the models. Multicollinearity occurs when different variables in a model correlates with other variables and not only the dependent variable (Andersson et al., 2014). According to Andersson et al. (2014) a VIF value above 10, can be problematic and can indicate high collinearity. The highest VIF value that occurs in model 1 is 1,497 and 1,508 in model 2 (Table 11 & 12).
Moreover, the Pearson correlation can be used to indicate a risk of multicollinearity, if the correlation has a value over 0,7 (Andersson et al., 2014). The highest value in the Pearson correlation table (Table 10) is -0,784, which is between the variables ShrTypeFIN and ShrTypeInd/Fam/Indv.
29
5. Analysis
In comparison to previous studies regarding IC or HC disclosure, this study finds that all companies disclosed at least one disclosure item (Bozzolan et al., 2003; Bukh, 2005; Firer & Williams, 2005; Pisano et al., 2017). Earlier studies have mainly had the focus on annual reports (Hay et al., 2018; Maji & Goswami, 2018), while this study has LinkedIn as the tool to gather the information. Annual reports usually have the same structure, and for example, in the European Union, a directive force companies to disclose different HC and IC information. This study, with LinkedIn as the tool to collect information, has another approach since companies use LinkedIn in different ways and therefore some items can be skewed compared to previous literature.
The findings of the individual disclosure items are in line with previous research regarding HC disclosure on LinkedIn by Pisano et al. (2017). This study shows a higher percentage disclosed items in five out of the nine investigated disclosure items. The outcome of the result can be due to the more digitalized environment in the Nordic countries, which the report by OECD (2018) concludes. Furthermore, the report by OECD (2018) can be used to argue that digitalization has an effect on HC disclosure, since this study shows a higher level of HC disclosure than Pisano et al. (2017). Three of the items were disclosed in under seven percentages of the firms, which can indicate that companies do not see those items as importantto disclose on LinkedIn (Table 9). LinkedIn is a social media tool that focus on recruitment, however, Recruitment was just the second most disclosed item in this study (76 %); 100 % of the companies disclosed information regarding Employee-related measurement. This implies that companies use LinkedIn as a channel to communicate information about the company. This is in line with the previous study by Bonsón and Bednárová (2013), that the main purpose is to provide information about employees. However, this might be a false observation due to the classification of item recognition.
5.1 Ownership structure
Compared to the study made by Pisano et al. (2017), the mean of A02 is lower, 35,86 %, compared to 54,47 %, which means that the ownership is more diffused in Sweden and Norway compared to Italy, France and Germany. Fama and Jensen (1983) argues that
30
firms with dispersed ownership will disclose more information in order to mitigate the agency problem. This study shows more dispersed ownership concentration and higher HC disclosure on LinkedIn compared to Pisano et al. (2017), supporting the argumentation behind agency theory.
Companies need to incorporate external norms and rules from society in their operation in order to gain legitimacy (DiMaggio & Powell, 2000). Therefore, companies in the Nordic countries might need to disclose more information through social networks, since it is one of the main information channels for the population in more digitalized countries (Miller & Skinner, 2015). As previously stated, Recruitment was not the most disclosed item even though LinkedIn is mainly used for recruitment. A reason for this might be that companies continually disclose information to maintain their legitimacy (Suchman, 1995).
5.2 Correlation and regression analysis
The correlation between ownership structure and HC disclosure shows a significant correlation at 1 %, with a negative correlation of -0,268, which is in line with previous research (Pisano et al., 2017). This means that there is a negative correlation between ownership structure and HC disclosure, hence, if the ownership concentration increase, companies will disclose less HC information. Through voluntary disclosures, a company can mitigate the type 1 agency problem (Brammer & Pavelin, 2006; Chau & Gray, 2002; Cormier et al., 2005). The correlation also give support to the research hypothesis that a negative relationship exist between ownership concentration and the level of HC disclosure via LinkedIn and strengthens the previous research by Pisano et al. (2017). This might support earlier studies concluding that large shareholders collect the information they want compared to smaller shareholder, which can benefit more from increased disclosures by companies (Brammer & Pavelin, 2006; Chau & Gray, 2002; Cormier et al., 2005; Patelli & Prencipe, 2007).
By analysing the result from the regression models, the effect of the independent and control variables can be determined. Regression model 2 shows a higher adjusted R2 than model 1, which means that model 2, with A02 included, better explains the dependent
31
variable. Additionally, the adjusted R2 is higher than the study by Pisano et al. (2017), and might therefore be argued to be more trustworthy.
The results from the regression analysis shows that three variables are statistical significant, those variables are accumulated ownership, leverage and firm size. Accumulated ownership is negative and statistical significant at 1 % explaining HC disclosure, which is an expected outcome in accordance with the hypothesis. Hence, voluntary disclosure might mitigate the agency problem in companies with high concentrated ownership (Fama & Jensen, 1983). The level of the negative Beta for the accumulated ownership is consistent with previous studies regarding IC or HC disclosure, focusing on either LinkedIn (Pisano et al., 2017), or other disclosure media, such as annual reports (Firer & Williams, 2005; Li et al., 2008; Oliveira et al., 2006). In combination with previous research, it can be argued that companies with high ownership concentration systematically disclose less information than if the ownership was more diffused. Furthermore, this is in line with Fama and Jensen (1983), which states that firms with high ownership concentration have less conflict between principal and agent. The other variables, leverage (Beta = -0,271) and firm size (Beta = 0,535) have a negative, respectively positive relation with HC disclosure. For firm size, the Beta is similar to the previous study by Pisano et al. (2017), which means that the size of a company has a positive correlation to HC disclosure on LinkedIn. A larger company might have the resources and capabilities to gain legitimation by disclosing more information (DiMaggio & Powell, 2000). The variable Leverage is negative and significant to HC disclosure, which is contradictable to the study by Pisano et al. (2017). Although the variable Leverage is significant, the negative relation to HC disclosure is, in opposition to Jensen and Mecklings (1973) argumentation, that firms with high leverage have incentives to disclose more, in order to reduce the agency cost. Previous research by Pisano et al. (2017), found the variable profitability to be statistically significant and positively related to HC disclosure. However, this study shows no significance for the variable profitability in the regression model. A reason for no significant profitability may be due to the sample selection and context. None of the investigated dummy variables (shareholder type) are significant, which means that shareholder identity does not affect companies level of disclosure.
32
5.3 Multicollinearity
The highest correlation value in the Pearson correlation table exists between ShrTypeFIN and ShrTypeInd/Fam/Indv. Since the correlation value between those variables is lower than 0,9, multicollinearity cannot be determined (Andersson et al., 2014). Moreover, as all other correlations have a multicollinearity below 0,9, it cannot be determined through the Pearson correlation table. The highest VIF value shown in either of the regression models is 1,508, which implies a low risk for multicollinearity (Table 11 & 12). Since none of the models shows an indication of multicollinearity, it can be argued that no problem with multicollinearity exist.
33
6. Conclusion
This study investigates HC disclosure via LinkedIn and its relationship with ownership concentration in the Swedish and Norwegian market. It also offers insight that highly digitalized companies can use disclosures to gain legitimacy and mitigate the agency problem. Research within IC and HC disclosure have been well studied by scholars, however, this study is the second study to investigate HC disclosure and ownership structure and no previous study has investigated the Nordic countries. The method used in this study consist of a content analysis with a disclosure index including the most common disclosure items found in earlier studies.
The findings show that most companies in Sweden and Norway disclose information connected to human resource management practices, which is in line with previous research, showing that companies mainly use LinkedIn as a communication channel. It appears like companies use LinkedIn to gain legitimacy and reduce the agency problem. The regression analysis confirms the research hypothesis that ownership concentration has a negative relation to HC disclosure. Furthermore, it supports Pisano et al. (2017), suggesting that large shareholders can acquire the information they need, hence, companies with high concentrated ownership experiences less pressure to disclose information than companies with low concentrated ownership.
This study contributes to existing literature, confirming the result from the previous study that investigates HC disclosure and ownership structure. Moreover, it gives an insight in how companies use LinkedIn to disclose information, to gain legitimacy and mitigate the agency problem. The result from this study appears to show that more digitalized countries overall disclose more information than countries with less digitalization, regardless of ownership structure. However, the information disclosed tends to be more company related rather than recruitment related. This indicates that companies use LinkedIn more as a tool to communicate with stakeholders, and not just a recruitment channel.