J
Ö N K Ö P I N G I N T E R N A T I O N A LB
U S I N E S S S C H O O L HÖGSKOLAN I JÖNKÖPINGT h e D e t e r m i n a n t s o f F o r e i g n
D i r e c t I n v e s t m e n t
Swedish Flows of FDI into Eastern and Western Europe
Bachelor Thesis within Economics Author: Aida Arnautovic 860602
Elin Erixon 840731 Supervisors: Scott Hacker
Bachelors Thesis in Economics
Title: The determinants of Foreign Direct Investment: Swedish flows
of FDI into Western and Eastern Europe
Author: Aida Arnautovic & Elin Erixon
Tutor: Scott Hacker & Hyunjoo Kim
Date: 2009-05-28
Subject terms: Foreign direct investment, trade, Eastern Europe, Western Europe
Abstract
This thesis investigates the determinants of Swedish foreign direct investments to 24 European countries during the period 1998 to 2008 with 2000 and 2008 as sample years. The thesis emphasizes five factors that affect the Swedish FDI flows to these chosen countries, which are grouped into OECD countries and CEE countries (Central and Eastern European countries). The explanatory va-riables studied are economic growth, property rights, unit labor cost and two dummy variables with one targeting whether the country is culturally affiliated with Sweden and the other is dealing with whether that country is an OECD country or not. We use multiple regressions to find out to what extent each of these variables can explain the variance of FDI during the years 2000 and 2008. The coefficient estimates show the expected sign in the relationship between FDI and the various explanatory variables, with the exception of labor cost but only OECD membership shows a significant relationship to FDI (and only when using 2000 data).
Table of contents
1
Introduction ... 1
1.1 Purpose ... 1 1.2 Disposition ... 22
Background ... 3
2.1 Previous studies ... 32.2 Swedish FDI into western European Countries ... 3
2.3 Swedish FDI into CEE- countries ... 4
2.4 Aspects of an EU-enlargement in 2004 ... 5
3
Theoretical Framework ... 8
3.1 Location specific paradigm ... 8
3.2 GDP Growth ... 9
3.3 Labor cost per output ... 9
3.4 Property Rights... 10
3.5 Dummy variables ... 11
3.6 Expected signs of the explanatory variables ... 12
4
Empirical framework ... 13
4.1 Data and hypothesis ... 13
4.2 Regression results ... 14
4.2.1 Swedish FDI into OECD and CEE countries 2000 ... 14
4.2.2 Swedish FDI into OECD and CEE countries in 2008 ... 15
5
Conclusion ... 18
References ... 20
Appendix 1: Correlation plots ... 22
Appendix 2: Growth rates 2000 & 2008 ... 24
Appendix 3: Logged labor cost ... 24
Appendix 4: Logged property rights ... 26
Appendix 5: Dummy variable, culture and country ... 26
Figure 1 Flows of FDI to western European countries during 1998-2008 ... 4
Figure 2 Flows of FDI to CEE during 1998-2008 ... 5
Figure 3 Percentage growth rate in Western and Eastern Europe during 1997-2008 ... 9
Table 1 Measurement of property rights in Idex of Economic Freedom ... 10
Table 2 Variables ... 12
Table 3 Variables used to measure FDI ... 13
Table 4 Regression result for year 2000 ... 14
Table 5 Estimated signs for 2000 ... 15
Table 6 Regression result for year 2008 ... 16
1
Introduction
Foreign direct investment (FDI) is often brought up when it comes to concepts such as economic growth and development. FDI refers to investment that is done by an agent (company or a private person) into a foreign market. This process may be provided through re-locating an already existing production plant or by building a new factory in the investment country. In order to qualify an investment as an FDI the investor in the home country must hold at least 10 percent of the shares or the voting powers of the newly ac-quired affiliate.
FDI is also connected with discussion of whether its spillovers are positive or negative. It is clear that inward FDI has a potential of creating new jobs and helps to build and improve the domestic infrastructure. There is a positive inflow of capital and knowledge which is re-flected in a positive effect on the entire population. The domestic suppliers receive a devel-opment with new clients which can help an entire geographical region. Overall the national accounts including balance of payments (BoP) will be positively stimulated. However, there are critics of FDI who claim that the market share is too dominant in the host country. The technology pool is dependent on foreign sources, countries distort their economic plans in favor of attracting FDI and the domestic business culture is reduced and replaced by for-eign culture and business practices (Hunter, 2006).
The re-integration of many CEE countries (Central and Eastern European countries) into Europe in 2004, which occurred as ten of the CEE countries joined the European Union, provided an essential political and economic indication. The EU membership is a signifi-cant determinant of FDI. FDI can hasten the process by creating a basis for a more effi-cient cooperation between governments and encouraging a reconstruction of enterprises, which is essential in order to make the transition process work (Bevan & Estrin, 2004). In our thesis, we will mainly focus on Swedish FDI abroad in order to see how the changes in FDI have developed. Looking at the Swedish FDI abroad over the years, it is clear that there has been a large increase in it; in year 2005 the FDI abroad was 55 times larger com-pared to year 1980. Between 1980-2005 Swedish FDI abroad increased from $3.5 billion to almost $200 billion (Kommerskollegium, 2008).
This brings up the question regarding the incentives for FDI flows and whether the in-vestment is mainly focused to Western or Eastern European countries. What is attracting Swedish firms to investment in these various countries?
1.1
Purpose
FDI is desirable for many countries and especially for the ten new member countries of EU that joined the union in 2004. Since 1998 most of FDI has flowed into western Euro-pean countries with a small increase of inflow to CEE countries. The purpose with this thesis is to investigate which variables that are significant in attracting Swedish FDI and whether their importance has changed over the years. We do this using 2000 and 2008 data on a selection of 24 countries as a total, 15 western European and 9 CEE countries.
1.2
Disposition
This thesis is structured upon four subsequent chapters. It begins with a short background of Swedish (and international) FDI flows to both western European countries and the new member states in the EU, namely the CEE countries. The background chapter is followed by a theoretical framework chapter where we present the theories surrounding the deter-minants of FDI. After that the empirical findings chapter shows our regression results, and the last chapter provides the conclusion.
2
Background
This section provides a brief overview of the importance of FDI in order to obtain eco-nomic growth and the political, ecoeco-nomic and social changes that the EU enlargement brought to nine new member countries in 2004.
2.1
Previous studies
In a paper presented by Avik Chakbrabarti (2001), “The determinants of FDI: Sensitivity analyses of cross-country regression”, several variables and their explanatory powers for FDI inflows to 135 different countries are discussed. The study contains variables such as market size (GDP), labor cost and trade barriers growth rate among others. One of Chak-brabarti’s primary findings regarding the variables relationship to FDI is that market power (per-capita GDP) has explanatory power over FDI. Chakbrabarti also found that other va-riables such as tax, wages, openness, exchange rates, tariffs and growth rates of GDP are typically controversial variables in the FDI discussion and are highly sensitive to small changes in the conditioning information set. The author claims, however, that the host country’s openness to trade is the variable that has the strongest correlation to FDI. There-fore, in order to attract FDI countries should engage in world trade.
Laura Resmini (2000) investigated the determinants of FDI in the CEE’s at the manufac-turing sector level. The main findings were that in general FDI in this region is targeted at local markets and that foreign investors prefer large markets with high growth rate pros-pects. The CEE’s progress towards a market economy has a major impact on FDI inflows, especially in science-based and capital intensive sectors, whereas the wage differences affect FDI in the scale-intensive and science-based sectors. The degree of economic openness and the possibility to exploit agglomeration economies influence FDI flows in the tradi-tional sectors, and the proximity to Western Europe has an advantage in capital intensive and science-based sectors.
There are also some important policy implications that can be drawn from Resmini’s re-sults. In general the path and pace of structural reforms are important for attracting FDI but factors such as type of investor, the technology transferred in the process and the level of industrial restrictions play an important role as well.
Resmini points out that the Czech Republic, Poland and Hungary have been successful in the transition process and have managed to attract more capital intensive FDI than scale intensive FDI. The reason that these countries have succeeded in attracting FDI is due to their relatively substantial and long-term commitments. According to Resmini other transi-tion economies which are less advanced should focus on stabilizing their overall business environment in order to attract a high and sustainable level of FDI in the manufacturing sector.
2.2
Swedish FDI into western European Countries
Figure 1 Flows of Swedish FDI to western European countries during 1998-2008, (Source: Statistiska Centralbyrån)
Other factors contributing to the increased FDI outflow can be Sweden’s entering into the European Union in 1995 and the deregulations it brought. Looking at the graph in figure 1 we can see that the Swedish FDI outflows have increased prominently during the years. However, year 2002 this trend turned and there was a decline in outflows until 2005 where there was a change of trend.
The exchange rate is another factor that affects the value of Swedish FDI. According to the TCW-index1 the Swedish crown depreciated by 2.1 percent in 2007. The crown depre-ciated against the euro by 4.4 percent and appredepre-ciated against the U.S. dollar by 5.5 percent and the British pound by 4.0 percent. When looking at Swedish assets abroad there have been mainly increases in North America, however the assets have increased in Germany as well to a large extent, mainly due to the shareholder’s equity, which depends on enterprise acquisition and profits that have been reinvested (Statistics Sweden, 2009).
2.3
Swedish FDI into CEE- countries
Figure 2 shows the FDI flows from Sweden to Eastern European countries. The trend line in the figure shows that over the years FDI has managed to more than double itself. Swe-den is mainly targeting Estonia and Poland for its FDI, but Hungary is also an important host country for Swedish FDI.
10 000 110 000 210 000 310 000 410 000 510 000 Millions of SEK FDI Linear (FDI)
Figure 2 Flows of Swedish FDI to CEE during 1998-2008, (Source: Statistiska Centralbyrån)
The role of foreign direct investment is important for the transformation of the formerly centrally planned economies in Central and Eastern Europe towards a market economy. FDI provides these countries with sources of investments in order to improve their indus-trial structure but also for developing their quality of infrastructure. The flows of FDI into these countries bring new skills and technologies, which in time improves the attractiveness for further investments. The largest investors that provide the major inflow of FDI into the Eastern European countries are Germany, Austria, Czech Republic and USA. Germany be-ing the largest investor is benefittbe-ing from bebe-ing closely located to the new member coun-tries (Lansbury, Pain & Smidkova, 1996). The general expectation regarding flows of FDI is that they consist primarily of flows from advanced countries into developing countries which are more politically stable and have larger regional markets than the average transi-tion country.
2.4
Aspects of an EU-enlargement in 2004
In May 2004 ten new member countries entered the European Union. Nine of them Cy-prus, Estonia, Latvia, Lithuania, Poland, Slovakia, Slovenia, Czech Republic and Hungary are all Central and Eastern European countries and will be referred to CEE countries2. Accession of these countries came with the expectations of stimulating inflow of FDI since the business environment seemed more attractive and the confidence for investments in-creased. This happened since FDI from both old member states and from countries from the rest of the world increased, leading to a general growth in investment, employment and productivity (Bevan & Estrin, 2004).
During the 1990’s FDI became gradually a more significant factor in the global integration and economic growth. This development took place during the same period of time as the transition process from socialism to capitalism and the assimilation of the Central and Eastern European countries into the world economy by engaging them in trade and through that they started to gain capital inflows (Bevan & Estrin, 2004).Growth,
promo-0 5 000 10 000 15 000 20 000 25 000 30 000 35 000 Millions of SEK FDI Linear (FDI)
tion of technical innovation and enterprise restructuring in addition to providing capital ac-count relief may all be aspects facilitated by the introduction of FDI into transition econo-mies. Nevertheless, there has been an unpretentious amount of FDI into these transition economies; in 2002 only 4.4 percent of the world FDI was invested in CEE (Bevan & Es-trin, 2004).
The writers Bevan and Estrin claim that there are indications from transition economies that R&D expenditure, productivity, innovation and company performance in foreign-owned firms are higher than in domestic-foreign-owned ones. The transition process could affect the countries to adopt the transition process differently and as a consequence, greater eco-nomic performance is attained for some countries. In contrast, some of the countries which are less attractive to FDI perform comparatively less well during the process due to the initial disadvantage in attracting FDI. Looking at the region, three economies which have been highly attractive for FDI are Poland, Czech Republic and Hungary (Bevan & Es-trin, 2004).
The subsequent flows of FDI and the opening up of the Eastern European countries has attracted significant awareness from academics, businesses and policy makers, primarily be-cause of two reasons. The first reason is associated with the fact that countries compete with each other in order to attract resources. Today, both developed and developing coun-tries compete to attract FDI, since FDI is regarded to be a combination of capital, technol-ogy, management and marketing, and thanks to this it constitutes a unique package of re-sources. This could make an essential part in accelerating economic development and also connecting separate states to the global marketplace.
The second reason is associated with the share of FDI itself in the transitional process. The ability of transitional economies to attract FDI from advanced economies comprises a re-quirement for their systematic transformation. Apart from FDI advantages previously pointed out, there exist other factors as least as important which are inherent to the transi-tion period. Examples of this may be the reorientatransi-tion of markets and especially the reor-ganization of inefficient firms. Central and Eastern Europe is seen as potentially the most attractive region for FDI. However, the CEEs are not homogenous and the level of both growth and FDI differ among the countries. Since the 1990’s as the CEE countries de-serted their socialist systems and began market-oriented reforms the FDI inflows have in-creased steadily.
The enlargement of the EU involves huge challenges for the CEE countries to develop their international competitiveness. Anastassopoulos, Georgiou and Maroudas (2008) claim, however, that there are three main emerging trends. First, higher skills, such as in precision engineering, design, and research and development are some orientations that have been allocated the new EU member-states in the global production chain. The second trend to emerge is that fact of taking advantage of cheaper production and market oppor-tunities, smaller European companies have been investing heavily in the region. Prior to the enlargement a large part of the small companies were put off due to the risks of invest-ing outside the EU borders. The third trend is consolidation across the specific region. This involves international firms relocating their production facilities and services across Europe.
Several characteristics such as relatively low cost of labor, cheap production etc. make the new member countries a target for investment by MNEs (multinational enterprises) and as a result they experience globalization surroundings within the European Union framework. It is their comparatively low unit labor cost, in particular, that is highlighted as the
incen-tive for the location of MNEs in these countries and not institutional or market factors (Anastassopoulos, Georgiou and Maroudas, 2008).
3
Theoretical Framework
FDI is mostly acquired through “merger and acquisition” activities or by international fran-chising. The role of FDI is especially important in countries which are emerging and in transition towards a market economy. The role of FDI is said to answer the question: "How
do you create capitalism in a nation where there are neither capitalists nor capital?" (Hunter, 2005.)
Companies choose to engage in foreign direct investments for several reasons, among them being to gain market power on a new geographical market, to increase the global competi-tiveness and position for the firm, to create a tight production line in a global industry and to reduce costs for R&D production and distribution. In order for a country to attract FDI some qualifications have to be fulfilled. A company seeks low costs and prefers a qualified labor stock, and it strives towards a long-term market potential or at least one greater than achieved in the home country. A company prefers access to natural resources if these re-sources are to be used in the line of production, however, the location of investment is crucial as well. A company also wants stability, both economically and politically in order to create and secure a long-term cooperation and to function in a safe business environment. In order to examine the relationship between FDI and our independent variables in our empirical analysis we have chosen to use the Location Specific Paradigm discussed in the next subsection. The variables that are considered as explanatory of FDI into a country are GDP growth, labor cost, property rights and two dummy variables dealing with whether the target country has cultural affiliation with Sweden and whether the target country is a Western European country or not. We will present each explanatory variable and discuss its theoretical relationship with FDI and how it is applicable on our selected countries.
3.1
Location specific paradigm
The Eclectic paradigm presented in the book The international allocation of economic ac-tivity by BG Ohlin, PO Hesselborn and PM Wijkman in 1977. The eclectic paradigm was developed by John Dunning in that same year, and has since then been redefined by Dun-ning himself over the years. The paradigm asserts that a firm’s foreign activity depends upon creation or control of ownership-specific advantages that are beneficial to internalize into countries with location-specific advantages. Changes in a firm’s foreign activity are de-termined by the changes in its OLI (Ownership, location and internalization paradigm) re-lationship and the strategy of long-term management (Dunning, 1977).
"Location-specific advantages are related to various characteristics in the economical, cultural, legal, political and/or institutional environments across locations and affects the costs and/or revenues of producing in dif-ferent locations" (Dunning 1988).
The locational advantages are connected in the way that they influence the predictable productivity of foreign production in relation to exports and that that the same is for hav-ing a production that is geographically spread (Ekström, 1998).
There are a number of factors in the location advantages that have a significant effect on the profitability of firms to engage in foreign production and the location of that produc-tion. These factors include market size and growth, factor endowments, sources of supply, transport costs, trade barriers and physical distance between countries. Some of the factors serve as explanatory variables in the regression analysis later in this
thesis to study how they affect the flows of FDI from Sweden to eastern and western Eu-ropean countries.
3.2
GDP Growth
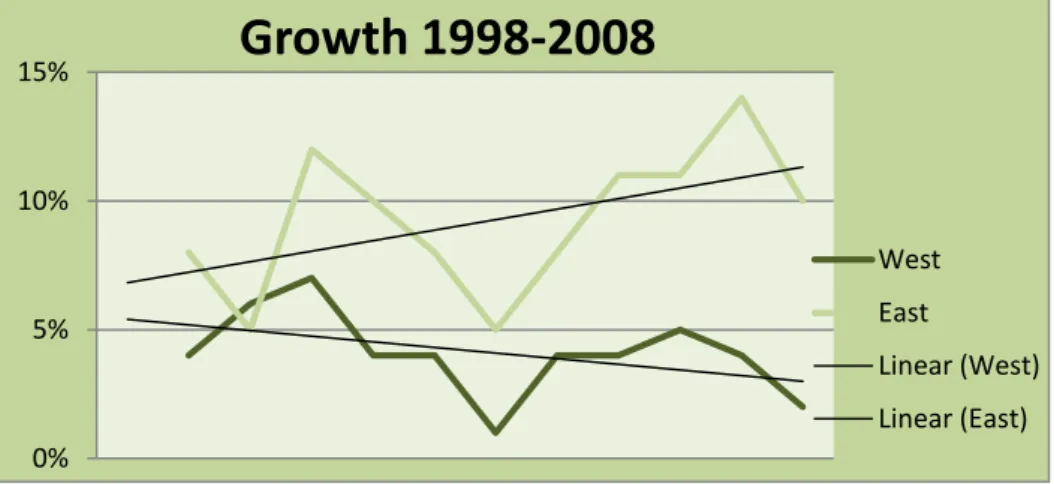
Figure 3 Percentage GDP growth rate in Western and Eastern Europe during 1997-2008, (Source: Eurostat)
We expect FDI into a country is positively related to its growth rate. The discussion touch-es the fact of what is affecting what also. Dotouch-es FDI lead to economic growth or dotouch-es eco-nomic growth lead to attracting more FDI? As can be seen in figure 3, during the period 1998-2008 the trend line indicates increasing growth for the eastern European countries, whereas for the western European countries the trend is declining growth.
3.3
Labor cost per output
The variable labor cost measures total nominal labor cost in the economy divided by the nominal GDP level in that same economy. The ratio can be seen somewhat as an efficiency rate of produced goods in relation to the cost of producing that good.
When looking at the entire business sector, one can see that the cost of labor in Sweden is more than ten times the average for the new EU-member states. These new ten member states have approximately the same cost of labor, with Slovenia and Cyprus as exceptions. The average cost of labor in the EU-153 is less than in Sweden, however, it is much higher than that of the new member states. There are significant differences amongst the EU-15 countries. Denmark, Belgium and Germany have almost as high labor costs as Sweden, while Portugal and Greece have labor costs that are half of the average for the EU-15. The productivity in the new countries is lower in general, so the low labor costs result in overestimation of the prospective profits from transferring production. As firms specialize their production, their possibilities of reducing costs in the short run by transferring the
0% 5% 10% 15%
Growth 1998-2008
West East Linear (West) Linear (East)production to low-cost economies increase. This situation contributes to the ongoing structural transformation process. In the long run, the dissimilarities of labor costs will be diminished as differences in productivity and price levels are reduced. This development arises as the increases in prices and productivity growth grow faster in low-cost economies than in Sweden and the rest of the EU-15. As a fact, the labor costs have ascended more rapidly in the new member states than in EU-15 in recent years (Kommerskollegium, 2008).
3.4
Property Rights
A property right is the ultimate authority to decide how a resource should be used, whether the resource is owned by the government or by individuals. In the case of ownership by the government there are certain rules determined by the state that the agent who decides the resource’s use has to operate under. In a market economy the main motivating force is the ability to accumulate private property, and in order to reach a completely functioning free-market economy the rule of law has to be fulfilled.
Level of Property rights Definitions
100% Private Property is guaranteed by the govern-ment. The court system enforces contracts
effi-ciently. No corruption
90% Private Property is guaranteed by the govern-ment. The court system enforces contracts
effi-ciently. Corruption is nearly nonexistent, 80% Private Property is guaranteed by the
govern-ment. Court system enforces contracts efficient-ly but with delays. Corruption is minimal, 70% The court system delays in enforcing contracts.
Corruption is possible but rare. Private property is guaranteed by government
60% Enforcement of property rights is relaxed and affected by delays. Corruption is possible but rare, and the judiciary may be influenced by
other branches of government.
50% The court system is inefficient. Corruption may be present, and the judiciary may be influenced
by other branches of government. 40% The court system is highly inefficient, and
de-lays are so long that they deter the use of the court system. Corruption is present and other branches of government influence the judiciary
system.
30% Property ownership is weakly protected.
Cor-ruption is extensive.
20% Property ownership is weakly protected.
Out-side settlement and arbitration is the norm. 10% Property ownership is rarely protected and
al-most all property belongs to the state. 0% Property ownership is outlawed and all property
is government owned.
A measure of how well property rights are protected is provided for the calculation of the Index of economic Freedom (developed by The Wall Street Journal and the Heritage Foundation). The measurement for level of property rights varies, in percent terms, from zero (no protection of private property rights) to 100 (full protection of private property rights) Table 1 presents details on what various levels of the property rights measure mean. The average level of property rights for western European countries was 83.33 in year 2000, and for the southern Mediterranean countries it was significantly lower than the av-erage with levels of approximately 70. The remaining western European countries (Ger-many, Austria, Switzerland, UK and the Nordic states) have all levels around 90. For 2008 the total average level of the western European countries was decreased to 80, caused by Italy and Greece having their levels reduced from 70 down to 50.
The average property rights for CEE countries in 2000 were 63.33 which is significantly lower than the western European country level. There was a change for the individual countries by 2008 with higher levels for Cyprus, Estonia and Latvia, whereas for Slovenia and Poland there was a decrease in the level of property rights. The average for these coun-tries slightly increased from 2000 to 2008 but dramatic changes can be seen for individual countries.
3.5
Dummy variables
One dummy variable is used to capture the effect of cultural affiliation on FDI. Sweden and the Nordic states are by language and distance close to each other and are natural trade partners. Sweden has also been incorporated with the Baltic states Estonia, Latvia and Li-thuania. In the Eighteenth century and at the beginning of the Nineteenth century Sweden ruled large parts of the Nordic and Baltic states. Finland was under full control of Sweden and large parts of Estonia and Latvia were Swedish territory. This enlargement of Swedish state power has led to continuous cultural assimilation between Sweden, Norway, Denmark and Finland and the export statistics for Sweden shows that Swedish exports mainly go to Denmark and Norway, and Finland is also high on that list. The import statistics shows that the same countries are represented at the same positions as well.
The Baltic countries are closely located to Sweden with the Baltic Sea dividing the countries apart. The trade patterns between Sweden and the Baltic states show relatively low trade which can be explained due to the fact that the Baltic states are small countries if looking at their relative size. We therefore include the Nordic states Finland, Denmark and Norway and the Baltic states Estonia, Latvia and Lithuania as being culturally affiliated with Sweden in the dummy for cultural affiliation. We recognize that by only including countries that are closely located to Sweden we thereby exclude facts that the largest trade partners are some-times located far away from each other. Sweden’s largest trade partners are, along with the Nordic states, also Germany, United Kingdom and North America, however, none of these countries are culturally affiliated with Sweden.
A second dummy variable is a country variable that shows if a country is a western Euro-pean country or not. This variable is included in order to be able to differentiate between the two groups of countries and state if FDI is positively related to western European
3.6
Expected signs of the explanatory variables
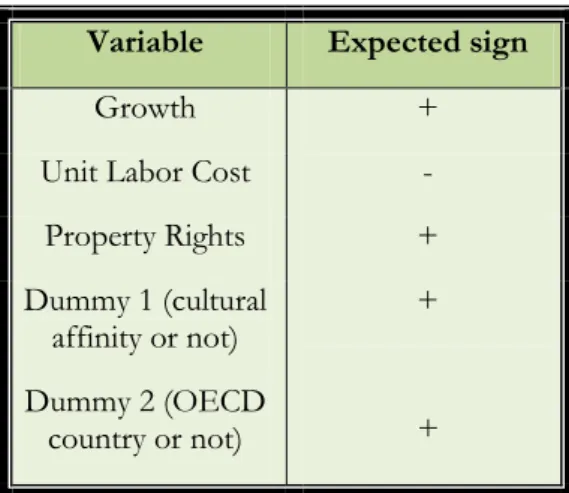
The Location Specific Paradigm has been used in order to evaluate the relationship be-tween FDI and the variables chosen. The variables that are looked upon are unit labor cost, property rights and economic growth. These variables all have a relationship with FDI and we expect them to have a positive or negative relationship with FDI, as shown in table 1 and as discussed below.
Table 2 Variables
We expect a positive relationship between growth and FDI flows since growth implies that an economy is expanding and attracts investors who wish to take advantage of the increas-ing local demand. The labor cost is measured as total labor cost divided by nominal GDP. We expect that an increase in the labor cost will have a negative effect on inflow of FDI since the increase in cost reduces the profitability of FDI and therefore a negative sign on that variable is strived for. The variable property right is expected to have a positive influ-ence on FDI flows. Property rights are defined as state laws that guarantee private proper-ties. It measures the degree a country’s laws are protecting the rights and to what extent its government is enforcing those laws. We therefore expect property rights to provide some kind of security in order for firms to invest in foreign countries and regions. The first dummy variable shows if the countries are culturally affiliated with Sweden or not. We ex-pect that FDI is positively related to cultural affiliation because countries that are culturally affiliated with Sweden have a long history of both trade and cooperation with Sweden. The second dummy shows if a country is in the OECD or not. In this thesis the Western Euro-pean countries have been labeled as OECD countries and Eastern EuroEuro-pean countries as CEE countries. We expect a positive relationship between OECD membership and FDI flows since the OECD countries are advanced countries with good economies which makes them attractive for FDI.
Variable Expected sign
Growth +
Unit Labor Cost -
Property Rights + Dummy 1 (cultural affinity or not) Dummy 2 (OECD country or not) + +
4
Empirical framework
A selection from a total of 24 countries from both Eastern and Western Europe is used and two years have been sampled in the analysis. The main point for this thesis is to look at the determinants of FDI from Sweden before and after 2004, the year that the new nine EU-members joined the union. We chose the years 2000 and 2008 for our sample years and investigated the influence of the various explanatory variables on FDI for these two years.
4.1
Data and hypothesis
The data for this thesis has been collected from various economic institutions. We have used FDI statistics from Swedish bureau of statistics where gross values from each country and year have been collected. Data for the growth rates and labor cost are collected from EUROSTAT and OECD where both variables are measured in millions of Euros. Growth was transformed from real GDP levels at market prices. Values for property rights were collected from the homepage of Index of Economic Freedom produced by the Wall Street Journal and The Heritage Foundation. The number of observations is in total 24 countries with nine Eastern- and fifteen Western European countries. Both groups contain more countries than used in our thesis but due to lack of data we had to exclude some countries.
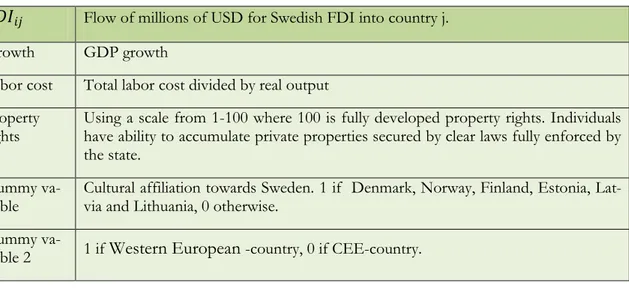
Table 3 Variables used to measure FDI
The OLS regression used in our analysis is:
𝑙𝑛𝐹𝐷𝐼𝑗= 𝛽0 + 𝛽1X𝐺𝑗+ 𝛽2𝑙𝑛X𝐿𝐶𝑗 + 𝛽3𝑙𝑛X𝑃𝑅𝑗+ 𝛽4𝐷𝐶𝐴𝑗 +𝛽5𝐷𝐶𝑂𝑗 + 𝜀𝑗
where 𝐹𝐷𝐼𝑗 is Sweden’s gross flow of FDI into country j, in this case it is Sweden’s FDI to
Western and Eastern Europe in the sample years 2000 and 2008, and for country j X𝐺𝑗 is
the variable for economic growth, X𝐿𝐶𝑗 is the variable for labor cost, X𝑃𝑅𝑗 is property
rights, and the two dummy variables 𝐷𝐶𝐴𝑗 and 𝐷𝐶𝑂𝑗 respectively represent cultural
affilia-𝐹𝐷𝐼𝑖𝑗 Flow of millions of USD for Swedish FDI into country j.
Growth GDP growth
Labor cost Total labor cost divided by real output Property
rights Using a scale from 1-100 where 100 is fully developed property rights. Individuals have ability to accumulate private properties secured by clear laws fully enforced by the state.
Dummy
va-riable Cultural affiliation towards Sweden. 1 if Denmark, Norway, Finland, Estonia, Lat-via and Lithuania, 0 otherwise. Dummy
4.2
Regression results
In this section we will present the results from our calculations in SPSS. We present them according to the division of years.
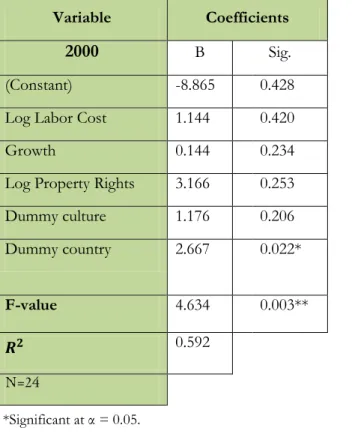
4.2.1 Swedish FDI into OECD- and CEE countries 2000 Table 4 Regression results for
The purpose for this paper is to find whether there is the expected relationship between our dependent variable FDI and our independent variables growth, labor cost, property rights and our two dummy variables for OECD membership and cultural affiliation. In or-der to examine the relationship we tried to find significance from our p-values using an al-pha level of α = 0.05. From table 3 which deals with the regression results for year 2000, we find that only one variable shows significance, the dummy variable for OECD member-ship. From the table we also find the significance level of our F-value. Using alpha = 0.01 we can reject our null hypothesis that none of the explanatory variables are relevant since 0.004 < 0.01.
We will continue to discuss the signs of our beta values since these give us an indication about the relationship between our independent variables and our dependent variable. We are well aware that most of our variables show insignificant relationships, however, we still we find it important to discuss the estimated signs and magnitudes of our coefficient esti-mates.
Variable Coefficients
2000 B Sig.
(Constant) -8.865 0.428
Log Labor Cost 1.144 0.420
Growth 0.144 0.234
Log Property Rights 3.166 0.253 Dummy culture 1.176 0.206 Dummy country 2.667 0.022* F-value 4.634 0.003** 𝑹𝟐 0.592 *Significant at α = 0.05. **Significant at α = 0.01
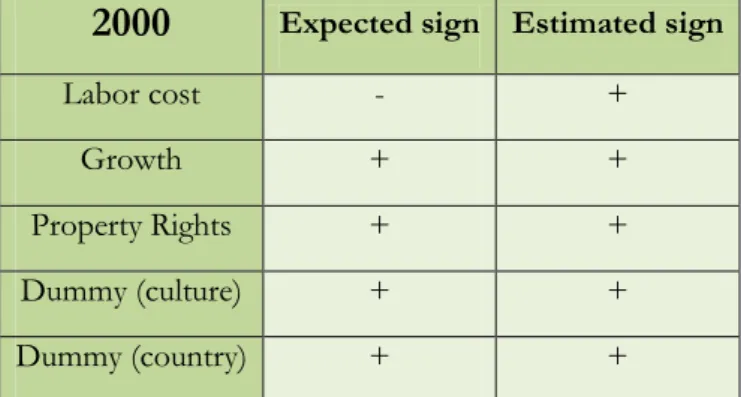
Table 5 Estimated signs for 2000
Table 4 shows that the estimated signs of the coefficients (taken from table 3) are corres-ponding in all cases to their expected signs. The variable growth shows a positive relation-ship with FDI and we can state that higher growth will have a positive influence on FDI. The variable labor cost is expected to be negative in its effect on FDI, however the esti-mated sign indicates that the relationship is positive.
The property rights variable is expected to be positive in its affect on FDI since countries with higher levels of property rights are seen as more secure to invest in. The coefficient for the first dummy variable indicates if cultural affiliation is positively related to FDI or not. The estimated sign is positive indicating that Swedish FDI is allocated more to coun-tries that are culturally affiliated with Sweden all else equal. The second dummy variable country included to see if FDI flows are positively related or not to whether the target country is in the OECD or not. The result is also a positive sign for the coefficient estimate so the OECD variable is related to FDI positively.
Since two of our variables, unit labor cost and property rights are in logs we will discuss how a one percent change in these independent variables affect FDI in percent. Since for the coefficient of labor cost the estimated sign is not corresponding to the expected sign, we avoid interpreting it. We see that a one percent increase in the property rights index is estimated to increase FDI by 3.166 percent.
The three remaining variables growth (X𝐺) and the two dummy variables cultural
affilia-tion (𝐷𝐶𝐴) and country (𝐷𝐶𝑂) are not in logs. The growth variable from table 3 shows 0.144
for its coefficient estimate, this means that if growth increases by 1 percentage unit FDI will increase by 14.4 percent (0.144 * 100 = 14.4). The coefficient estimates for variable cultural affiliation indicates that countries that are culturally affiliated with Sweden receive 224.1 percent more of Swedish FDI than those countries that are not culturally affiliated, [(exp(1.176)-1)*100=224.1], all else equal. The coefficient estimate for the OECD dummy variable indicates that Western European countries receive 1339.7 percent more FDI than CEE countries (exp 2.667) − 1 ∗ 100 = 1339.7 , all else equal.
4.2.2 Swedish FDI into OECD- and CEE countries in 2008
During 2008 the regression coefficients in table 5 indicate no significance in their p-values, neither at the alpha level of 0.05 nor at the alpha level of 0.10. The significance value for F
2000
Expected sign Estimated signLabor cost - +
Growth + +
Property Rights + +
Dummy (culture) + +
Table 6 Regression results for year 2008
We continue to discuss the signs of our beta-variables from table 6 and as we expected our estimated signs are corresponding to the expected signs in most cases. It is also notable that there is consistency the signs for all of our variables except labor cost over the years. However, even if there is somewhat consistency over the years, the values have changed. To find out the changes and their impact on FDI we will discuss the percent change in FDI due to changes in our independent variables.
The coefficient estimate for the variable labor cost shows that FDI increase by 1.486 per-cent as the labor cost increases by one perper-cent; this is not something we expected to occur. From table 5 we see that the variable property rights shows FDI increasing by 3.3 percent as property rights increases by one percent.
Variable Coefficients
CEE 2008 B Sig.
(Constant) -7.401 0.328
Log Labor Cost 1.486 0.396
Growth 0.114 0.149
Log Property Rights 3.298 0.070
Dummy culture 0.161 0.848
Dummy country 1.506 0.145
F-value 2.173 0.106
𝑹𝟐 0.390
2008
Expected sign Estimated signLabor Cost - +
Growth + +
Property Rights + +
Dummy (culture) + +
Dummy (Country) + +
The growth variable indicates an 11.4% change for FDI as growth increases by one percen-tage unit. The two dummy variables 𝐷𝐶𝐴 and 𝐷𝐶𝑂 are calculated in the same way as in
2000. The dummy effect from cultural affiliation is calculated by (exp 0.161) − 1 ∗ 100 = 17.5 . This has the interpretation that countries that are culturally affiliated with Sweden will on average receive 17.5 percent more of FDI than those countries that are not. The second dummy is calculated in the same way exp 1.506 − 1 ∗ 100 = 350.9 meaning that western European countries will receive 350.9 percent more of FDI from Sweden than the CEE countries, all else equal.
5
Conclusion
To sum up, FDI is desirable for many countries and Sweden has had relatively high FDI outflows throughout the years. Not only the European countries are targeted by Swedish FDI; North America is the second largest recipient of Swedish FDI. Swedish FDI to West-ern Europe throughout the years has been significantly positive as can be viewed from fig-ure 1 in section two. The Swedish FDI flows to Western and Eastern Europe has more than doubled over the time period. This can be explained by the globalization expansion; companies get access to other markets besides their home markets, where they get the pos-sibility to establish their products. As already mentioned, Sweden entered the European Union in 1995 which can also be seen as a reason for greater outflows and inflows of FDI since there were removals of regulations made which prior to the membership were an ob-stacle for Sweden. In recent years as the East European countries began their transition process towards a market economy and joined the European Union, FDI inflows to these countries became more significant, whereas, the FDI to Western Europe has fluctuated over the years.
Even if Swedish FDI has increased in both groups we can still discuss whether some of the explanatory variables have had more or less importance for the flows. We have already stated that we only found significance at the 5% level in one variable in year 2000 and that there were no significant variables in year 2008. Looking at the signs of the coefficient es-timates for both years we can see that there is consistency throughout the years. This indi-cates that the correlations between our dependent variable and our independent variables still show the same type of relationships in year 2008 as they did in year 2000.
It is also interesting to see how the coefficient estimates changed between the years. We do this here, although our statements ignore the issue of whether the changes are significant or not. Beginning with the property rights we found the estimated effect from increased prop-erty rights on FDI has increased over the years (2000 to 2008). The estimated effect from increased labor cost on FDI has also increased, however, the estimated relationships shows an incorrect sign according to the theory.
The other three variables, growth, dummy cultural affiliation and dummy country showed positive relationships to attracting Swedish FDI in 2000 and 2008, but these relationships where stronger in 2000.
An interesting fact is that in both years FDI shows a stronger relationship to those coun-tries that are culturally affiliated towards Sweden. We would expect that in the era of globa-lization and the progress of EU-enlargement the Swedish FDI would take less considera-tion of whether the country to invest in was culturally affiliated or not. This is supported somewhat by the lower estimated effect of cultural affiliation on Swedish FDI in 2008 in comparison to 2000. The coefficient estimate for the dummy variable on OECD member-ship indicates that Swedish FDI flows more freely to the OECD countries then the East-ern European countries but OECD membership was less important in 2008 than in 2000. There is no reason to why that pattern should not continue.
To suggest some topics for further studies we want to point out two main questions. First, in the future the wage levels and the assumed wage equalization between the Eastern and Western European countries could be interesting to analyze in the discussion of attracting FDI. As pointed out in the thesis labor cost is expected to be negatively related to FDI and if there is wage equalization, the cost of labor for determining location for FDI may be less important. Secondly, the economic and political stability of the Eastern European countries
and its relation to FDI could be investigated further. The variable property rights is only one of a great number of variables that can measure political and economical stability. In-clusion of variables such as freedom of corruption and freedom of labor could also provide
References
Anastassopoulos G, Georgiou C, and Maroudas L. (2008) Location attractiveness for For-eign Direct Investment of EU New Member-Countries in comparison with old ones,
Inter-national Journal of Entrepreneurship and Innovation Management, Vol.8, No.5, pp. 506-523.
Beach W W. & Kane T. (2008) Methodology: Measuring the 10 economic freedoms. In Holmes, K.R., Feulner, E.S., and O'grady (Eds.) with KimA.B., Markheim, D., and Ro-berts, J.M. 2008 Index of Economic Freedom (pp. 39-55). Washington DC and New York: The Heritage Foundation and Dow Jones & Company, Inc.
Bevan A A. & Estrin S. (2004) The determinants of foreign direct investment into Euro-pean Transition economies, Journal of Comparative Economics, Vol. 32 p.776-780.
Borensztein. J. De Gregorio E. and Lee J-W. (1998) How does foreign direct investment affect economic growth? Journal of Comparative Economics, Vol.45.
Chakrabarti. A. (2001)The Determinants of Foreign Direct Investments: sensitivity analysis of Cross-Country. Regressions Business Source Premier, Vol. 54.
Dunning. John H. (1977), Trade, Location of Economic Activity and the MNE: A Search for a Eclectic Approach". In B. Ohlin, P.O Hesselborn and P.m. Wijkman (Eds.), The
Inter-national Allocation of Economic Activity. London: Macmillan.
Dunning. John H. (1988) The Eclectic Paradigm of International Production, A Restate-ment and Some Possible Extensions. Journal of International Business Studies, Vol. 19, No. 1 pp. 1-31.
Ekström. J.( 1998). Foreign Direct Investment by Large Swedish Firms- The role of Economic
Integra-tion and Exchange Rates. Lund Studies in Economics and Management 41
The Institute of Economic Research, Lund University
Hunter R.J. Jr. (2006). An Introduction and Primer on Foreign Direct Investment 2005-
UNITAR/SHU Series on International Economics and Finance. Foreign Direct Investment for
Development Financing Organized jointly by UNITAR and the Stillman School of Busi-ness at Seton Hall University, 16 - 19 May 2005 Hiroshima, Japan
http://www.docstoc.com/docs/2231040/1-What-is-Foreign-Direct-Investment-%28FDI%29-2-Why-do-companies Retrieved on 2009-05-04
Kommerskollegium (2008). Sveriges export av varor och Direktinvesteringar i utlandet.
Kommerskollegium National board of trade. Diarienummer 159-0791-2008
Lansbury, M., Pain N & Smidkova K (1998). Direct Investment in Central Europe Since 1990: An Econometric Study. Lansbury Melanie 1998 National Institute Economic Review Vol. 156 iss.1
Resmini L.(2000). The determinants of foreign direct investment in the CEEC’s, new evi-dence from sectoral patterns. Economics of Transition, Vol.3 p.682- 683
Statistics Sweden (2009) Foreign Direct Investment. Assets and Income 2007. Örebro, Sweden: SCB
Internet resources
Ekonomifakta 2009, http://www.ekonomifakta.se/sv/Fakta/Skatter/Skatterna_forklaras/Moms_i_Sverige_och _EU/ Retrieved on 2009-03-09 Eurostat 2009, http://epp.eurostat.ec.europa.eu/portal/page?_pageid=1090,30070682,1090_30298591&_ dad=portal&_schema=PORTAL Retrieved on 2009-03-10Index of Economic Freedom 2009,
http://www.heritage.org/Index/Explore.aspx Retrieved on 2009-03-15
Statistiska Centralbyrån 2009, http://www.scb.se/default____30.aspx
Retrieved on 2009-02-10
OECD 2009,http://stats.oecd.org/glossary/detail.asp?ID=2809 Retrieved on
Appendix 1 Correlation plots
Year 2000
Correlations
Growth Dummy Dummy2 Logpropertry Logunitlabor Growth Pearson Correlation 1,000 ,466*
-,483*
-,424* ,759** Sig. (2-tailed) ,022 ,017 ,039 ,000
N 24 24 24 24 22
Dummy Pearson Correlation ,466*
1,000 -,149 -,148 -,028
Sig. (2-tailed) ,022 ,487 ,489 ,900
N 24 24 24 24 22
Dummy2 Pearson Correlation -,483*
-,149 1,000 ,708**
-,518*
Sig. (2-tailed) ,017 ,487 ,000 ,014
N 24 24 24 24 22
Logpropertry Pearson Correlation -,424*
-,148 ,708**
1,000 -,494*
Sig. (2-tailed) ,039 ,489 ,000 ,019
N 24 24 24 24 22
Logunitlabor Pearson Correlation ,759**
-,028 -,518*
-,494*
1,000
Sig. (2-tailed) ,000 ,900 ,014 ,019
N 22 22 22 22 22
*. Correlation is significant at the 0.05 level (2-tailed). **. Correlation is significant at the 0.01 level (2-tailed).
Year 2008
Correlations
Growth Dummy Dummy2 LogPropertyRights LogUnitLaborCost Growth Pearson Correlation 1,000 ,132 -,627** -,497* ,648**
Sig. (2-tailed) ,540 ,001 ,013 ,001
N 24 24 24 24 22
Dummy Pearson Correlation ,132 1,000 -,149 ,106 ,387 Sig. (2-tailed) ,540 ,487 ,623 ,075
N 24 24 24 24 22
Dummy2 Pearson Correlation -,627** -,149 1,000 ,466* -,764** Sig. (2-tailed) ,001 ,487 ,022 ,000
N 24 24 24 24 22 LogPropertyRights Pearson Correlation -,497* ,106 ,466* 1,000 -,463*
Sig. (2-tailed) ,013 ,623 ,022 ,030
N 24 24 24 24 22
LogUnitLaborCost Pearson Correlation ,648** ,387 -,764** -,463* 1,000 Sig. (2-tailed) ,001 ,075 ,000 ,030
N 22 22 22 22 22
**. Correlation is significant at the 0.01 level (2-tailed). *. Correlation is significant at the 0.05 level (2-tailed).
Appendix 2:
Growth rates 2000 & 2008Source: Eurostat 2008
Appendix 3:
Logged labor cost2000 Country Total labor cost Nominal GDP Tot/nom Cyprus 1373 10079 0,136 Czech re 43313 61495 0,704 Estonia 7810 6103 1,280 Hungary 25509 51962 0,491 Latvia 833 8496 0,098 Lithuania 1625 12377 0,131 Poland 90345 185714 0,486 Slovakia 480 22036 0,022 Slovenia 11677 21435 0,545 Austria 135987 207529 0,655 Belgium 153984 251741 0,612 Growth rate 2000 2008 Cyprus 8 7 Czech re 8 16 Estonia 11 3 Hungary 14 4 Latvia 19 9 Lithuania 17 13 Poland 16 15 Slovakia 12 15 Slovenia 4 6 Austria 4 4 Belgium 5 3 Denmark 6 2 Finland 7 3 France 4 0 Germany 2 3 Greece 4 6 Ireland 13 -5 Italy 5 1 Netherlands 7 4 Norway 18 7 Portugal 7 1 Spain 8 3 Switzerland 7 7 United K 12 -13
Denmark 100132 173598 0,577 Finland 71085 132198 0,538 France 870644 1441372 0,604 Germany 1299894 2062500 0,630 Greece 76157 137930 0,552 Ireland 53196 104845 0,507 Italy 704634 1191057 0,592 Netherlands 255642 417960 0,612 Norway 80060 182579 0,438 Portugal 122270 0,000 Spain 380535 630263 0,604 Switzerland 270918 0,000 United K 709792 1602240 0,443
Source: Total labor cost from OECD homepage and nominal GDP from Eurostat homepage.
2008
Country Total labor cost Nominal GDP Tot/ Nom
Cyprus 2363 16 949 0,139 Czech re 77504 148 556 0,522 Estonia 2322 158 596 0,015 Hungary 52444 105 843 0,495 Latvia 3256 23 115 0,141 Lithuania 4191 32 292 0,130 Poland 126457 362 095 0,349 Slovakia 1005 64 884 0,015 Slovenia 23238 37 126 0,626 Austria 173794 282 286 0,616 Belgium 210211 344 206 0,611 Denmark 141791 233 331 0,608 Finland 103620 186 164 0,557 France 1166611 1 950 085 0,598 Germany 1459276 2 491 400 0,586 Greece 127686 242 946 0,526 Ireland 102609 185 721 0,552 Italy 950801 1 572 243 0,605 Netherlands 354637 594 608 0,596 Norway 132025 309 875 0,426 Portugal 166 228 0,000 Spain 613836 1 095 163 0,560 Switzerland 335 233 0,000 United K 1041057 1 812 077 0,575
Appendix 4:
Logged property rights Log property Rights2000 2008 Cyprus 4,25 4,50 Czech re 4,25 4,25 Estonia 4,25 4,50 Hungary 4,25 4,25 Latvia 3,91 4,01 Lithuania 3,91 3,91 Poland 4,25 3,91 Slovakia 3,91 3,91 Slovenia 4,25 3,91 Austria 4,50 4,50 Belgium 4,50 4,38 Denmark 4,50 4,50
Source: Homepage Index of economic freedom
Appendix 5:
Dummy variable, culture and countryDummy culture Dummy country
Cyprus 0 0 Czech re 0 0 Estonia 1 0 Hungary 0 0 Latvia 1 0 Lithuania 1 0 Poland 0 0 Slovakia 0 0 Slovenia 0 0 Austria 0 1 Belgium 0 1 Denmark 1 1 Finland 1 1 France 0 1 Germany 0 1 Greece 0 1 Ireland 0 1 Italy 0 1 Netherlands 0 1 Norway 1 1 Portugal 0 1 Spain 0 1 Switzerland 0 1 United K 0 1 Finland 4,50 4,50 France 4,25 4,25 Germany 4,50 4,50 Greece 4,25 3,91 Ireland 4,50 4,50 Italy 4,25 3,91 Netherlands 4,50 4,50 Norway 4,50 4,50 Portugal 4,25 4,25 Spain 4,25 4,25 Switzerland 4,50 4,50 United K 4,50 4,50