Bachelor Thesis within Business Administration
Authors: Martina Bankova
Abigail Marie-Tahil Burkle Hai Ly Vu
Tutor:
Luigi Servadio
Jönköping May 2018
A study on relationships between lack of control,
emotions, and negative word-of-mouth
2
Acknowledgment
First and foremost, we would like to take the opportunity to express our deep appreciation and gratitude to our thesis supervisor Luigi Servadio for his guidelines, constant feedback and unabated care.
Along with this, we also want to thank all of the professors and PhD candidates at Jönköping University Business School who helped and supported us throughout the writing process with valuable feedback, criticism and advice.
Jönköping International Business School May 2018
3
Abstract:
Service failure within the airline industry has been a prominent topic within the media. Each story of a failure features a disgruntled passenger. Emotions are already high during the consumption of any airline service, and a service failure will bring on а slew of unwanted emotions. The purpose of this paper is then to understand what type of relationship do these negative emotions and feelings of lack of control have after a service failure, and do any of those given emotions lead to negative word-of-mouth (NWOM).
The method used to accomplish this is correlation hypothesis testing of survey results in relation to the specified negative emotions and the causal attribution theory of control, as well as analysis between the same emotions and NWOM, again using correlation tests. This aim will be achieved by breaking service failure down into five negative incidents that are referred to as service failure scenarios, namely: luggage handling, delayed/cancelled flight, missed flight due to factors beyond customers’ control, negative customer service at the airport, and negative service experience during the flight. The five scenarios are studied against six specified emotions which are anger, frustration, helplessness, nervousness, worry, and panic. The relationship between these emotions and lack of control is tested, then these same emotions are tested in regards to NWOM.
The findings express a weak to moderate positive relationship between at least one of the emotions and lack of control in three of the scenarios, leading to the conclusion that customers’ lack of control over the situation increases the intensity of the emotions. In the findings for emotions and NWOM, four out of the six tested negative emotions lead to NWOM, which are anger, frustration, helplessness, and worry. This discovery proves that different emotions in different scenarios make people react in a different manner, and this leads to the conclusion that emotions should be tested separately and scenarios should be created to research the real intensity of the emotions in different situations, without grouping them into one.
4
Table of Contents
1. Introduction ... 6 1.1. Background ... 6 1.2. Problem ... 7 1.3. Purpose ... 9 1.4. Research Questions ... 10 1.5. Perspective ... 10 1.6. Delimitation ... 10 2. Theoretical Background ... 12 2.1. Causal Attributions ... 122.1.1. Causal attribution theory ... 12
2.1.2. Controllability ... 12
2.2. Emotions... 14
2.3. Negative Word-of-Mouth ... 17
2.3.1. Individual factors influencing NWOM ... 18
2.3.2. Negative emotions and NWOM... 18
2.4. Theoretical framework ... 20
3. Methodology ... 22
3.1. Choice of Method ... 22
3.2. Searching parameters ... 23
3.3. Reasoning of choice to conduct a survey ... 24
3.4. Content of the survey ... 25
3.5. Gathering data ... 26
3.6. Sample derivation and size ... 27
5
4. Data Analysis ... 30
4.1. General profile of the survey ... 30
4.2. Factor Analysis and Reliability Test ... 31
4.1.1. Factor Analysis and Reliability test results ... 32
4.1.2. Interpretation of the Factor Analysis and Reliability test ... 35
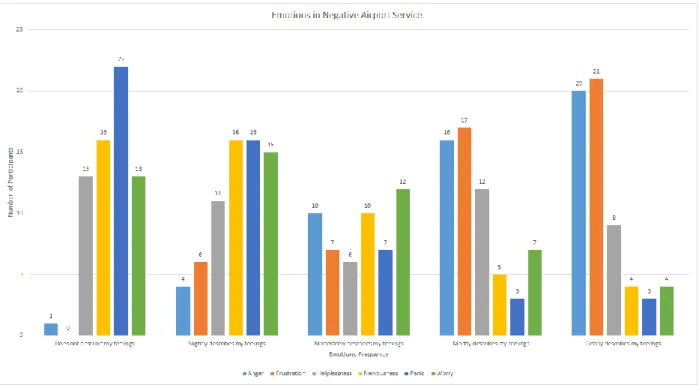
4.2. Descriptives of emotions ... 35
4.2.1. Results of descriptive data ... 36
4.2.2. Interpretation of the descriptive data ... 38
4.3. Spearman Correlation ... 38
4.3.1. Interpretation of results of Spearman Correlation ... 39
4.4. Somers’ delta ... 41
4.4.1. Interpretation of results of Spearman’s correlation and Somers’ d ... 44
4.4.2. Hypothesis H1, H2 and H4 approval: ... 46
4.5. The Cochran-Armitage test of trend analysis ... 46
4.5.1. The findings for the luggage handling service scenario: ... 47
4.5.2. The findings for the delayed/cancelled flight scenario: ... 47
4.5.3. The findings for negative customer service at the airport: ... 48
4.5.4 Interpretation of the Cochran-Armitage test of trend ... 49
5. Conclusion ... 52
6. Discussion ... 54
References ... 56
6
1. Introduction
This chapter has an aim to introduce the reader to the topic of airline service failure. It highlights some theory on the consequences coming from service failures. Additionally, the purpose of this thesis is discussed and research questions are formulated.
1.1. Background
The airline industry could be considered as one of the largest business sectors in the world with the International Air Transport Association (IATA) predicting that global airline net profits will increase to an estimated value of 38.4 billion dollars in 2018 (IATA, 2017). The industry’s main focus is on keeping costs low while still maintaining high net profits. As the economic environment becomes more demanding and challenging, the airline companies should continuously strive for progressive growth within the sector, in order to maintain their competitive advantage. Company’s competitive advantage could be majorly influenced by superior customer service. In order to sustain the competitive advantage, it is necessary for airlines to focus on the quality of the customer experience (Gabbott, Tsarenko, & Mok, 2010). The current competitive nature of the sector has seen a number of airlines going out of business in the recent years, such as Monarch Airlines in 2017 (Martin, 2017). Many different incidents could cause an airline to bankrupt or decide to leave the industry. Examples include tragic accidents, drastic sales drops, and massive public criticism which could make people avoid a specific company. In the past few years, there have been multiple incidents where negative word-of-mouth (NWOM) may have had a financial and reputational impact on several major airline companies such as 2014’s Malaysia Airlines Flight 370, and more recently 2017’s United Airlines Flight 3411 (Kottasova, 2017; “Malaysia Airlines losses worsen”, 2014).
Airline service failure procedures should take into consideration not only the causes of negative feedback, but also the emotional factors that influence customers to spread NWOM. A service failure is a negative incident that occurs because the customers’ expectations were not met (Zeithamel, Bitner, Gremler, & Wilson 2016). There is a number of different emotions that
7
customers experience when it comes to a service failure such as: anger, frustration, irritation, disappointment, and regret (Wetzer, Zeelenberg, & Pieters, 2007). Wetzer et al., (2007) claim that customers who experience these types of emotions are more likely to engage in NWOM, whether it is with their family members and friends, or the online community.
However, not all service failures lead to NWOM. It all depends on whom the customer attributes the failure to, meaning, who is guilty for it (Chan & Wan, 2008). Controllability and stability during a negative incident impact the customers’ behavior intentions post service failure, including the desire to use NWOM (Nikbin, Hyun, Baharum, & Tabavar, 2015). This is especially true for service environments because service consumption must be done at a specific time and place (Bitner, 1992). Certain environments, such as airline services, are multifaceted which can make the customer feel that they lack complete control during the consumption of the service (Migacz, Zou, & Petrick, 2018).
Little research is done in the area of controllability and customer behavior in regards to service failure situations. Nikbin et al. (2015), and Nikbin and Hyun (2017) are so far the only researchers that come up when looking for this relationship in the industry of airlines. The topic of airline service failure connected to control, emotions, and NWOM is underdeveloped and the research is limited, though it can be important and helpful for the industry. The interest for this matter has peaked in the past years with the increasing criticism over the industry and with additional new issues occurring such as overbooking of flights, leading to security staff dragging people out of the planes. The reasons and patterns of airline service failures are diverse and interesting to research, thus intriguing us to do further investigation on it. Airline service failures are personally interesting to us because as international students, we often have to use the services. Additionally, interest in a future career in the airline industry has been expressed among us.
1.2. Problem
Service failure within the airline industry is most likely occurring on a daily basis at airports across the globe, thus making it very difficult to observe the consumer behavior that results from such a failure (Jafarkarimi, Sim, Saadatdoost, & Hee, 2016). Customers may encounter different negative incidents within one trip, and each of these incidents belongs to a different kind of
8
service failure. Even if the same failure happens twice, the end results may vary depending on what staff from the service provider the individual interacts with. This is due to the fact that when travelling, customers are required to engage in multiple points of service (Maxham, 2001; Migacz et al., 2018).
In the research of cases like service failure, one possibility is to conduct a scenario-based questionnaire, because of the limited ability researchers have in observing the behaviors that occur after a service failure (Jafarkarimi et al., 2016). However, according to Jafarkarimi et al. (2016), guidelines for creating a scenario-based questionnaire are limited, but it should not be a method that is overlooked in service management. It is a method most commonly used in other areas of behavioral studies, particularly in ethics. Up to our knowledge is that a scenario-based questionnaire has only been utilized in one other service failure study, but that study is within the restaurant industry (Ortiz, Chiu, Wen-Hai, & Tsu, 2017).
This thesis will explore a scenario-based questionnaire design, but unlike Ortiz et al. (2017), the chosen empirical grounding will be within the aviation industry with negative emotions as the main theoretical concept. Emotional responses are focal to handling service failure (Taylor, 1994; Harrison-Walker, 2012). The longer the delay of the reaction, the greater the likelihood that the customer will give the service provider a more negative evaluation (Taylor, 1994). During the time between service failure and service recovery, there is a period of uncertainty. It is this uncertainty, mixed in with various causal attribution dimensions, that heightens negative emotions in an environment that a customer already feels like they have limited control (Folkes, 1984; Migacz et al., 2018; Taylor, 1994;).
Controllability, which is one of the main characteristics within attribution theory, is positively related to negative emotions experienced after a service failure (Nikbin & Hyun, 2017). People are constantly seeking out the cause for their failure. This type of processing is called causal attribution. Within causal attribution theory, Weiner (1980) posits that there are three dimensions: locus of control, stability and control. There is currently only one study written by Nikbin and Hyun (2017) that specifically studies the mediating relationship between negative emotions and behavioral intention. However, their study only focuses on negative emotions in general. We wish to contribute to the service management research by looking at Nikbin and
9
Hyun’s (2017) study from a different angle. While control and NWOM are critical within their study and must be discussed within the literature review, the contribution that our study will give is the study of negative emotions based on a scenario-based questionnaire.
Customer behavior has many avenues to explore but few of the studies harness scenario survey questions as a tool in understanding service failures. The main focus of the thesis is the relationship between feelings of lack of control that a customer has over a service failure situation and the emotions felt by the customer in the situation, together with the research if certain emotions may influence the customer’s intentions to engage in NWOM. This research can be categorized as being part of the service management sector within business administration. The choice of aiming the attention at the airline industry comes from the personal interest we have towards the industry and the insignificant amount of research on the specific topic. Adding the fact that the industry’s public relations have been highly criticized over the past years shows us that there is an arising interest towards the industry and people may benefit from more scientific research on it. The thesis aims to be valuable for the airlines by helping them gain more awareness of which emotions are prominent after negative incidents in their industry, in order to improve their service failure handling and decrease the level of negative feedback from customers.
1.3. Purpose
The purpose of this research is to understand if there is an association between customers’ lack of control over the airline service failure situation and negative emotions, and if the negative emotions felt lead to NWOM intentions. Specific negative emotions are proposed after consulting theory (see section 2.3) to understand which ones drive people into engaging in negative behavior intentions, more specifically NWOM. Unlike Nikbin et al. (2015), and Nikbin and Hyun (2017) who previously research the relationship between control, emotions and NWOM, in this thesis the emotions are divided into different scenarios which customers might have been through if they have experienced an airline service failure. They are studied in this way in order to try to fill an existing gap that has been created, which is that emotions are being generalized by previous studies. The emotions are considered generalized because they have only been explored for the whole service failure category, rather than for different types of
10
service failures within the airline industry. The attempt is to analyze each emotion separately in order to give real and more reliable results for each of them individually. Not all service failures provoke the same feelings in people. By dividing the research variables into scenarios, the emotions can be better understood in specific cases. Knowing which emotions are felt in a different scenario can be used to help companies handle emotionally charged customers in a way that does not lead customers to engage in negative behavior intentions.
1.4. Research Questions
What is the relationship between customer’s lack of control over the situations and customer’s negative emotions after a service failure? Which emotions lead to the engagement in NWOM within the situations?
The first research question aims to figure out what is the kind of relationship that the two variables have - positive, negative, or no association, meaning how strong the relationship between lack of control and emotions may be. The second question examines if these emotions cause the individuals to use NWOM.
1.5. Perspective
The focal point of the thesis is what emotions do the customer feel after experiencing a service failure, whether customer’s lack of control over the situation influences these emotions, and if they affect customers’ decision to engage in NWOM. For this reason, the research is only taking the customer’s perspective of the service failure aspect, and companies’ perspective is disregarded.
1.6. Delimitation
Data about the airlines and airports is not taken into consideration. The focus of the research is strictly on the customers and any information about the airlines and airports can be considered inapplicable.
Regarding the temporal dimension of the service failure, the reason why the focus is strictly on after service failure, rather than during, is because of the limitation to surveying people who are
11
currently experiencing a service failure. The emotions might be considered more clear and in greater intensity during the experience, but the aspect concerning NWOM logically follows after the moment of affection. Moreover, there is memory bias in regards to feelings during the moment of service failure. When recalling emotions in the heat of the moment customers tend to exaggerate their feelings, therefore the result might not be as accurate as needed, in order for companies to actually be able to benefit from it.
There are two groups of defined failures - non-catastrophic and catastrophic. A non-catastrophic failures are failures that do not cause physical harm whereas a catastrophic failure is seen as failures that lead to physical harm or even worse, death (Dawar & Pillutla, 2000; Smith, Bolton, & Wagner, 1999). This thesis will only focus on non-catastrophic incidents such as luggage handling failures or cancelled flights. Catastrophic failures within the airline industry are considered extreme cases and will be disregarded.
Positive emotions are not examined in this study, as this research is tightly correlated with NWOM engagement, which is assumed to not be arisen from positive emotions. Also, it is rare that positive emotions are felt during service failure in the first place.
The focus of this research also does not cover service recovery. Even though most of the literature available for service failure and emotions, and airline service failure, also includes recovery, maintaining the focus around three variables - emotions, lack of control, and NWOM gives a better chance in going to greater depth into the research. In addition, considering the current word limit, the large topic of service recovery will not be covered in enough details to actually result in helpful information.
12
2. Theoretical Background
In this chapter, we present existing theory on causal attributions, emotions, and NWOM. Furthermore, a conceptual model has been developed through the previous findings and presented at the end of the paragraph.
2.1. Causal Attributions
2.1.1. Causal attribution theory
Causal attribution theory has three main dimensions: locus of control, stability and controllability (Weiner, 1980). Whenever there is a failure during the service consumption, customers are usually looking to blame someone. In their search for someone to blame, they use causal attribution processing to determine the cause of that failure and through their own conclusions, they allocate responsibility towards those they believe caused the failure (Albrecht, Hattula, Bornemann, & Hoyer, 2016; Bitner, 1990; Folkes, 1984; Weiner, 2000). Each dimension contributes to the causal inferences. Locus of control is about who the cause of the failure is and it is usually the customer or the service provider (Hess, Ganesen, & Klein, 2003). Stability in causal attribution theory describes the likelihood of an incident happening again. There are temporary or permanent causes. Permanent causes are the incidents that concern companies the most (Weiner, 2000). Finally, there is controllability which is the amount the customer believes they or the service provider can influence the situation (Weiner, 2000).
2.1.2. Controllability
This research will be focusing on the controllability dimension within attribution theory, because researchers tend to only focus on one or two of the three causal attribution dimensions (Hess, 2008). Complaining during a service failure happens when perceived controllability and stability are compromised (Folkes, Koletsky, & Graham, 1987). Customers will blame the firm if a failure should happen more than once. Longer periods between failures also increase the likelihood that the firm will receive an unsatisfactory rating, should a failure arise (Maxham & Netemeyer, 2002). All of the above mentioned factors play a crucial part during a service failure and
13
contribute to the service failure literature. Triggers in the environment, especially employee interactions, are what affect service failure and service recovery (Albrecht et al., 2016). People are natural information processors who draw conclusions about a causal connection of an event based on the environment around them (Folkes, 1984). This is true for both negative and positive incidents, but negative events tend to garner the highest attribution activity because people are constantly looking for someone other than themselves to take the responsibility for the mishap (Bitner, 1990; Folkes, 1984; Weiner, 2000).
Control of a situation can be very powerful, especially when negative feelings are involved. According to a meta-analysis done by Van Vaerenbergh, Orsingher, Vermeir, and Larivière (2014), controllability has the most influence over customer behavior post service failure. In regards to recovery satisfaction, controllability has a direct negative effect on the customers’ perception of the firm. If the customer believes that the firm is in control over the failure and they fail to act in a timely manner, the customer will blame the firm for the negative incident (Choi & Mattila, 2008; Nikbin, Marimuthu, Hyun, & Ismail, 2014). If the controllability is unknown then their satisfaction is more likely to be unaffected (Choi & Mattila, 2008). People tend to blame others when there is failure, but take credit for themselves when there is no issue (Maxham & Netemeyer, 2002).
Emotions can sway the intensity of the event, they can make an event unforgettable, and they can be either proactive or reactive choices. In other words, they can be seen as markers, mediators and moderators (Bagozzi, Gopinath, & Nyer, 1999). Emotions as mediators and moderators has been studied in regards to controllability attribution (Nikbin et al., 2015; Nikbin & Hyun 2017). Nikbin and Hyun (2017) posit that the stability and controllability causal attribution dimensions are related to negative customer intentions and the stronger the negative emotions, the more likely they are to act on those negative customer intentions such as switching and NWOM. However, controllability has a stronger influence on negative emotions and negative customer intentions than stability does (Van Vaerenbergh et al., 2014). Nikbin et al. (2015) find that controllable causes not handled properly will lead to negative customer intentions. Emotions as markers has been studied by Bagozzi, Wong, and Yi (1999). They posit that it is the state of one’s well-being and emotions that matter most, regardless of the situational factors.
14
2.2. Emotions
According to Bagozzi, Gopinath, and Nyer (1999, p. 1), emotions are “positive or negative reactions, or mental stages of readiness that arise as a consequence of specific events or circumstances”. They are known to be present and play an important role in the context of service failure (Zeelenberg & Pieters, 1999). There has been an enormous diversity of research in the topic of customers’ emotions with numerous defined ways of putting them into different categories and groups. There are also many researchers who claim that different emotions should not be combined and be recognized by common emotional signs, because each emotion has different direction and expression, and therefore different way to perceive (Laros & Steenkamp, 2005). Furthermore, many authors focus only on one emotion in their research such as anger (Bougie, Pieters, & Zeelenberg, 2003), hate (Aumer-Ryan & Hatfield, 2007), regret (Inman & Zeelenberg, 2002), and others.
In order to categorize and quantify emotions later on in the research, certain ways to group them have to be specified. Shaver, Schwartz, Kirson, and O’Conner (1987), and Storm, C. and Storm, T., (1987) laid down the base of the hierarchical structure of emotions, starting from classifying them as positive or negative. The next step is to put those emotions in a category called “basic emotions”. Basic emotions have been observed from many different angles by researchers: facial, biosocial, and brain, although there are some who do not agree with the existence of this term (Laros & Steenkamp, 2005). Ortony and Turner (1990), suggest, after a thorough research, that there are 38 different emotions that more or less belong in the category of most researches available for categorizing basic emotions. A few examples would include acceptance, anger, anticipation, anxiety and others.
Since the focus of this thesis is on service failure, the emotions category needs to be more concise, which is achieved by focusing on customer emotions. Smith and Bolton (2002) research the role of customer emotions with the focus of service failure. Their research investigates how customers’ emotional responses to service failure could influence their satisfaction perception, and finds that if there is a failure in considering and measuring the emotional responses to service failure, they can lead to inability to understand customers’ evaluations and to misunderstand the level of their satisfaction. They also argue that if a service provider is unable to decode the negative emotions expressed from a customer after a service failure, their emotions
15
might be accountable for lower satisfaction levels in the end. If the service provider decodes the emotions correctly, the customer might receive higher levels of service encounter satisfaction (Dubé and Menon, 1998).
The paper of Laros and Steenkamp (2005) suggests that customer emotions can be arranged in three levels of generality. The distinguishment between positive and negative affect of these emotions is on superordinate level. This is considered as the most abstract level of defining emotions (Diener, 1999). Then, on the level of basic emotions for customers, the emotions proposed by Laros and Steenkamp (2005) are divided into the groups of four of positive and negative effect as it follows: contentment, happiness, love, pride and sadness, fear, anger, shame. At subordinate level, based on the research of Richins’ (1997), who created the Consumption Emotion Set (CES), 41 emotions are included. Richins (1997) proposed a scale that includes emotions which can be felt during consumption situations. The negative emotions included in the research of Laros and Steenkamp (2005) and which are based on Richins’ (1997) can be seen in the bottom of Figure 1 on the third, subordinate level.
Figure 1: Basic negative emotions of customers according to Laros and Steenkamp (2005)
A company that allows service failure to occur, gives the customers an external target for their negative emotions (Svari & Erling Olsen, 2012). Negative emotions that can be felt after experiencing a service failure can be anger, frustration, helplessness, nervousness, panic and worry (Laros & Steenkamp, 2005). Goussinsky (2011), and Laros and Steenkamp (2005) argue that customer emotions, which are usually aggressive after a service failure, include anger and frustration. Nikbin and Hyun (2017) confirm that anger is an aggressive emotion that is felt after a service failure. Additionally, McColl-Kennedy, Patterson, Smith, and Brady (2009) claim that
16
frustration is a main emotion following service failure. Common emotions that are felt are also nervousness, panic and worry, which belong to the Fear group (Laros & Steenkamp, 2005). Choraria (2013) states that nervousness and worry are both felt in a service failure situation. Additionally, panic is based on the Richins’ (1997) consumption emotion set. Helplessness, which is a part of the Sadness category of the Laros and Steenkamp’s (2005) study, is claimed as an emotion with negative effect that can accompany the effects of service failure as well. Gelbrich (2010) confirms that helplessness has a correlation to service failure. Since this research is focusing on service failure in situations that a customer is unable to control, the Shame category is reckoned as inapplicable and will not be further discussed. Based on the previous mentioned studies, the six emotions connected to service failure that are picked to be further tested in the thesis are Anger, Frustration, Helplessness, Nervousness, Panic and Worry.
Emotions felt after a service failure is the core of this research paper. This leads to the first set of hypothesis aiming to answer the first research question:
H1: There is a positive association between at least one negative emotion and lack of control over the situation in the luggage handling service failure scenario
H2: There is a positive association between at least one negative emotion and lack of control over the situation in the delayed/cancelled flight scenario
H3: There is a positive association between at least one negative emotion and lack of control over the situation in the missed flight due to factors beyond customers’ control scenario
H4: There is a positive association between at least one negative emotion and lack of control over the situation in the negative customer service at the airport scenario
H5: There is a positive association between at least one negative emotion and lack of control over the situation in the negative service experience during the flight scenario
According to Svari and Erling Olsen (2012), the majority of customers experiencing service failure prefer to engage in NWOM, rather than complaining to the service provider. Chebat, Davidow, and Codjovi, (2005), and White and Yu (2005) argue that this pattern is tightly related to the emotions felt during the negative experience.
17
2.3. Negative Word-of-Mouth
NWOM is the action that occurs when customers are dissatisfied with a purchase or a company, which leads them in informing their social circle about the experience, and advising their family and friends to avoid it (Day, 1978; Leonard-Barton, 1985). The forms of NWOM can be of verbal, as in in person, or online sources (Balaji, Khong, & Chong, 2016). Since NWOM tends to arise when large numbers of customers experience the same problem with a company or a product, this could lead to potentially serious consequences for organizations (Richins, 1984). NWOM can cause the problem to be reported by mass media, meaning that the information may reach the competitors, as well as the potential new customers who might choose to avoid that certain company. Many studies have shown that once customers experience a dissatisfaction, NWOM can be extensive since most customers do not only tell one person about the issue, but to several others as well (Richins, 1984).
According to Richins (1984), NWOM involves dynamic, two-way communication, consisting of a communicator and a receiver. The action of communicating and sharing information will only take place if the communicator is willing to speak, and the receiver is willing to listen (Lau & Ng, 2009). In order to understand how the procedure works, it is important to first look into the motives that drive customers to make their voice heard. Some of the factors that may have an influence on the individual’s willingness to speak include: their personality such as self-confidence (Cox & Bauer, 1964) and sociability (Lawther, 1978), their willingness to help others (Richins, 1984), and their involvement with the product or company (Richins & Root-Shaffer, 1988).
The impact of NWOM is a serious issue that should not be ignored since it comes from a non-marketing dominated source and thus, is not controlled by the companies. Companies cannot control what people share with one another especially when it comes to customer negative experiences and dissatisfaction. Research on negative information has proven that negative information has more influence on customers in comparison to positive information. There are many occurrences whereby people would avoid certain companies after receiving negative rumors about the company’s product or service, even when they reported that they did not believe the rumor (Richins, 1984). Furthermore, NWOM may lead to serious consequences such as affecting customer’s attitudes and purchasing intentions, brand dilution, volatility in stock
18
returns, and the overall firm’s image and reputation (Balaji et al., 2016). The most effective way to minimize or hinder customers from spreading NWOM is to minimize negative emotions, and ensure that customers are satisfied (Keiningham, Rust, Lariviere, Aksoy, & Williams, 2018).
2.3.1. Individual factors influencing NWOM
When it comes to individual factors that may have an influence on NWOM, Lau and Ng (2009) state that when experiencing a service failure, some individuals are more willing to express their opinion than others. After encountering a negative service experience, customers might have an urge tell others about it in order to release the frustration that they are feeling at the moment. Personality characteristics play a significant role in whether the customer would be motivated to share their negative experience with the audience. For example, people who possess quiet traits may not speak up whereas the sociable individuals may readily engage in NWOM. According to Lau and Ng (2009), a person who is more sociable will have a wider circle of contacts, increasing their likelihood of sharing negative service experience with others. Self-confidence is one of the personality characteristics that has a straight connection with NWOM behavior (Lau & Ng, 2009). According to Day (1978), customers who complain tend to be more self-confident. Thus, there is a higher chance that self-confident individuals are more likely to engage in NWOM compared to those who are less confident.
Another reason why customers engage in NWOM is due to their sense of social responsibility. People who are socially responsible tend to help other people despite the fact that they might not get anything in return. It is suggested that since socially responsible customers are concerned about the welfare of people surrounding them, they would be more likely to tell and warn the others about their dissatisfaction with a service in order to prevent them from experiencing the same unsatisfactory situation. In addition, individuals who are highly involved in their purchase decision tend to use NWOM (Lau & Ng, 2009). This is due to the fact that the level of purchase decision involvement can influence the level of dissatisfaction with a product or service and the likelihood of customers complaining once a service failure occurs (Landon, 1997).
2.3.2. Negative emotions and NWOM
Negative emotions are encountered when a large gap between the customers’ expectation of service quality and the service provided by the company is present (Nikbin et al., 2015). Past
19
studies have shown that when it comes to the relationship between emotions and behavioral intentions, customers tend to speak negatively to other people about their experiences in the marketplace to seek for social support as well as emotional release (Nyer & Gopinath, 2005). Numerous studies have shown that there are various negative emotions that would lead to customers engaging in NWOM after experiencing a service failure. These emotions include anger, frustration, helplessness, worry, nervousness, and others (Diener, Smith, & Fujita, 1995; Tronvoll, 2011). According to Damasio (1999), every decision made by a person is influenced by the set of emotions and thus, influencing one's intention to complain depending on which emotion is dominating at that moment. Nikbin and Hyun (2017) suggest that the stronger the negative emotion after encountering a failure, the more likely customers intend to talk and share the negative experience with others.
According to various researchers, anger seems to be the most common emotion studied in regards to NWOM (Bougie et al., 2003; Choraria, 2013; Nikbin & Hyun, 2017). Frustration and helplessness are the next negative emotions studied in terms of NWOM. Customers feel helpless when they believe that no one, including the service provider, can provide a solution to the problem (Lazarus, 1991; Weiner, 1985). Gelbrich (2010) state that customers who feel frustrated and helpless would turn to their social circle in order to vent their frustration. Furthermore, customers who experience anger with high level of helplessness tend to engage themselves in vindictive NWOM (Gelbrich, 2010). This means that customers attempt to castigate an organization by private actions taken in their own social circle (Singh & Pandya, 1991; Wangenheim, 2005). Some of the other negative emotions that play a crucial role in influencing customers’ complaining behavior include worry and nervousness (Choraria, 2013). According to Choraria’s (2013) study, some of the negative emotions are grouped under different categories namely Anger (anger, frustration, and irritation), and Unhappiness (unhappiness, worry, and nervousness). The reason behind having these negative emotions under these categories is because frustration can be grouped with anger whereas worry and nervousness can be grouped with unhappiness, meaning that these emotions can be felt by a customer simultaneously (Choraria, 2013).
The theory presented above highlights the current findings of NWOM and emotions. Thus enabling the formulation of a second set of hypothesis:
20
H6: At least one negative emotion leads to NWOM in the luggage handling service failure scenario.
H7: At least one negative emotion leads to NWOM in the delayed/cancelled flight scenario. H8: At least one negative emotion leads to NWOM in missed flight due to factors beyond customers’ control scenario.
H9: At least one negative emotion leads to NWOM in negative customer service at the airport scenario.
H10: At least one negative emotion leads to NWOM in the negative service experience during the flight scenario.
2.4. Theoretical framework
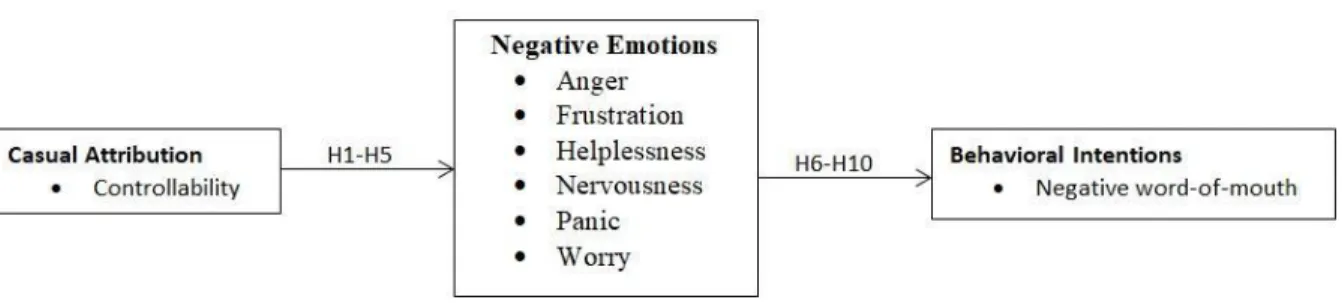
One of the main papers that the research will be used as a basis for the thesis comes from Nikbin and Hyun (2017). In their research they study on the relationship between causal attribution, pre-recovery emotions and negative behavioral intentions after a service failure in the airline industry. While their work looked at control and stability attribution dimensions, this research will only look at the control dimension. Nikbin and Hyun (2017) have studied multiple negative behavioral intentions, but here only NWOM will be studied. The conceptual model shown in Figure 2 is based off of Nikbin and Hyun’s (2017) model found in their report. The figure provides the link between control and emotions as well as emotions and NWOM. The arrows indicate where the hypotheses stand in terms of the model.
21
To summarize the theoretical framework, controllability is presented as one of the main factors from causal attribution that can influence negative customer behavior intentions. Control is put in the beginning of the model, as it tightly correlates to negative emotions that customers can feel after a service failure (Nikbin & Hyun, 2017). These specific emotions are chosen based off of Richins (1997), and they can trigger customers to engage in NWOM (Nikbin et al., 2015; Nikbin & Hyun, 2017). The hypotheses will test the relationship between lack of control and negative emotions as well as negative emotions and NWOM.
22
3. Methodology
The beginning of this chapter justifies the choice of our research method. Additionally, we provide a summary of our searching parameters. Furthermore, a reasoning why a survey has been conducted is stated, together with explaining the process of gathering the data and what the content of the survey is about. Lastly, the methodological limitations of the thesis are discussed.
3.1. Choice of Method
The choice of method is a quantitative deductive research approach. It is used to answer the research questions regarding the relationship between lack of control over the situation, and negative emotions as well as testing the relationship between emotions and NWOM.
Quantitative research is a part of the positivist paradigm because it adopts a highly precise, logical mathematical approach to collecting and observing numerical data (Collis & Hussey, 2014). A quantitative method analyzes the data through various statistical tests. The methods are well structured and often times aim to draw conclusions about hypotheses (Saunders, Lewis, & Thornhill, 2009). The research question at hand is seen as quantitative because it does not wish to draw conclusions about why negative emotions change when the customer’s control is limited, nor will the study describe the phenomenon from a subjective point of view. Those two types of studies are seen as an interpretivism approach, because of the methods required to conduct the studies (Saunders et al., 2009). The major setback to doing quantitative is that the research will not be able to answer why someone feels the way they do which is what interpretivism is able to do (Collis & Hussey, 2014). This lack of deeper interpretation may be seen as a negative factor when working with psychological customer behavior such as emotions.
The goal is to quantify data through the use of methodologies that classify under the positivism approach. Certain hypotheses are examined which is done by inspecting the statistical correlations thus, exploring about why and how is not the subject matter of this research. Therefore, a survey is a practical method of inquiry. The theories used will provide a base for establishing causal relationship between the controllability, negative emotions and NWOM
23
variables (Collis & Hussey, 2014). Through survey collection, the data will be collected and analyzed.
3.2. Searching parameters
The theoretical framework is gathered from various existing sources such as academic articles and books in order to obtain relevant studies to this topic, and keywords are used during the research process. All the scientific articles are found from Jönköping University Library, Primo, ScienceDirect and others. Some of the older articles referenced can still be considered relevant, as they are mentioned in more recent scientific articles and research and are mainly used for expressing definitions. All articles and books are published in English. The summarized information about the searching parameters can be seen below in Table 1: Searching parameters. Database and
search engines
Jönköping University Library, Primo, ScienceDirect, SAGE Journals, Emerald, ProQuest
Key words service failure in the airline industry, service failure AND emotions, service failure AND negative word-of-mouth, negative emotions AND negative word of mouth, service failure AND control, control AND emotions, causal attribution theory AND service failure, scenario-based questionnaire AND service failure, controllability AND service failure, controllability AND negative word-or-mouth
Literature types Academic articles, Books, Internet
Publication period 1954-2018 Languages of publication English
24
3.3. Reasoning of choice to conduct a survey
In order to reach the purpose of this thesis and obtain answers to the research questions, a survey was created. The survey was generated through Jönköping International Business School Qualtrics, which is a website created for designing surveys.
Emotions are multifaceted and this is why there are multiple studies in academia that study specific emotions from different angles. The survey includes more than one emotion because as shown in the theory, various authors have connected the emotions in the survey to control or NWOM in some way. Additionally, like emotions, service failure may also be seen as multifaceted and all the participants may not feel the same way in a given scenario. In order to connect emotions to lack of control and NWOM, a quantifiable method must be utilized. A cross-sectional study survey was seen as the most feasible option because of the time constraint to collect data. This type of survey helps explaining whether there is or is not a correlation, which is the aim of the study (Collis & Hussey, 2014). Additionally, experiments and longitudinal studies allow for more researcher controls, compared to cross-sectional surveys, but again, due to time constraints and financial means, these two methods were rejected as the final choice of method (Vazquez-Casielles, Rio-Lanza, & Diaz-Martin, 2007).
There were several other reasons why a survey was the chosen method to gather data. Firstly, it is cost and time effective as well as it allows to reach a large number of participants without depending on geographic locations. Secondly, various types of questions, regarding the subject, can be asked and designed in a way that would deliver a relevant outcome. Moreover, after the survey is complete, SPSS Statistics can be utilized in order to analyze survey data to discover statistical significance and therefore, provide the answers to the research questions.
However, there are also several disadvantages when it comes to choosing a research survey as the key method to gaining an outcome. Some of the disadvantages may include unclear data because the participants may understand and interpret the questions and answers differently. Also, it is unknown whether participants think the questions through before answering. Furthermore, the feelings and emotions of participants cannot be observed through a questionnaire compared to, for example, conducting an interview.
25
3.4. Content of the survey
In the survey, five scenarios are designed to investigate the variables (lack of control, emotions, and NWOM) in more depth. In order to create the five scenario questions, a set of criteria has to be made during the creation of the survey. In this case, the set of criteria is a set of guidelines of what a service failure should entail in order to be considered one. Lind (2007) has proposed a list of criteria for an ethics study, but no such criteria has been made for service failures. The first criteria is that the scenario has to be a common occurrence within the airline industry and the second one is that it has to be a non-catastrophic failure. The third criteria is that the scenario must be clearly defined in one sentence in order to maintain organization during the analysis process. Finally, the scenario should have the possibility of eliciting some kind of negative emotion from the customer. Based off of those four criteans, five scenarios are made. The survey emphasizes on several service failure scenarios that are more common including: luggage handling service failure, delayed/cancelled flight, missed flight due to factors beyond passenger’s control, negative customer service at the airport, and negative service experience during the flight.
Data is collected through the survey which consists of nine questions of which five questions require further expansion from the participants. Five out of nine questions provide specific service failure scenarios that may elicit NWOM and negative emotions that might be felt after the encounter (Laros & Steenkamp, 2005; Richins, 1997; Svari & Erling Olsen, 2012).
Scenario one describes luggage handling service failures. In this kind of scenario, the failure can be anything from lost luggage, to poor handling of luggage that leads to damage of one's’ property. The second scenario is delayed or cancelled flights. The most common reason for this is natural weather occurrence as well as technical and logistical problems of the aircraft. In the third scenario, missed flight due to factors beyond passenger’s control, can also be due to weather and technical difficulties, but it also focuses on customers missing connecting flights. Scenario number four encompasses negative customer service at the airport. This can be defined as any ground interactions with any given service at the airport. Common encounters may occur at the check-in counter, interactions at security checkpoints and many more. The fifth and final scenario is negative service experience during the flight. It has to do with any negative interactions with the inflight crew while the passenger is onboard the aircraft.
26
The participants are also asked about their feelings about the degree of control of the situation (Nikbin & Hyun 2017; Sengupta, Balaji, & Krishnan, 2015). Participants are asked to respond to this statement: “I felt like I was in control of the situation”, which is rated using a 5-point Likert scale ranging from 1 (strongly agree) to 5 (strongly disagree). They are then asked to evaluate how they would feel within each scenario and are required to rate a number of emotions using a 5-point Likert scale with a rating from 1 (does not describe my feelings) to 5 (clearly describes my feelings). The negative emotions in the questionnaire include anger, frustration, helplessness, nervousness, panic, and worry. Lastly, the participants are asked whether they have participated in NWOM and with whom.
3.5. Gathering data
The first step of starting the process of conducting a survey was to create a trial survey with a few questions regarding five airline service failure scenarios that at the time were named as lost luggage, delayed/cancelled flight, missed flight due to factors beyond customer’s control, negative customer service at the airport, and negative inflight experience. The names were later on changed for the main survey in order to be more clear and easily understandable for non-native speakers. The trial survey was first sent to family and friends where they needed to choose which scenario they have already encountered before, and then list the emotions that they have felt after either of those incidents. This was done in order to discover which emotions were the most experienced ones in regards to airline service failure, and then apply these emotions to the final survey. The most common emotions that were taken from the trial survey were anger, frustration, helplessness, nervousness, panic, and worry. With this information, the final survey was designed.
In order to make more people take participation in the final survey, we first asked close friends and family to fill it out, and then we encountered the students in our school. The snowballing technique was also used by suggesting to all those participating to spread the survey if they knew someone else who has experienced a service failure. The respondents were also asked to recommend other participants who might be able to partake in the study.
On the 11th of April, we went to Jönköping University, looking for people who would consider filling the survey on the spot. Each of the participants were given candies as an
27
acknowledgement for taking the survey. On the same day, the questionnaire was also uploaded online on Survey Tandem in order to generate more responses. Survey Tandem is an online platform where a user can upload their survey free of charge and get other users fill out the survey by completing other user’s surveys in exchange. The website allows the setting of conditions before the participants are able to open the survey, and the only condition was, that they had to have been experienced a service failure in the airline industry. We also sought assistance from the International Relations office at the Student Union building, asking them to send out the questionnaire to exchange students studying at Jönköping University. However, the request was processed too slowly, thus no data was retrieved through them.
To increase the reliability of the data, customers who have utilized airline service providers and experienced a service failure were the targeted audience of the survey. The survey was completed by individuals above the age of 16 as this is the minimum age required to fly alone without parental consent.
3.6. Sample derivation and size
Our sample contains in total of 152 participants coming from different continents including Europe, North America, and Asia (see Appendix 1, Figure 3.1). However, there are 22% of participants whose locations are unknown due to people not having their location tracked. There are 59% of participants taking the survey in Europe including countries such as: Sweden, United Kingdom, Netherlands, Scotland, Bulgaria, Ireland, Wales, Spain, Czech Republic, Belgium, Austria, Romania, and Greece. Fourteen percent of participants come from United States, and five percent of participants come from Asian countries such as Japan, Vietnam, Malaysia, Oman, and India.
However, 51 survey participants out of the total 152 are excluded from the sample. This is due to the fact that these participants did not follow the instructions correctly, quit the survey in the middle of filling it in, or had not experienced an airline service failure but were still answering the questionnaire. The outcome is a sample of 101 participants.
We wished to have diversity in the data since we believe that focus on one country might produce biased results. This is because participants might express the negative emotions
28
differently depending on their demographic, geographic, and cultural traits (Choraria, 2013). Hence, the survey participants were not limited to a specific geographic location.
3.7. Limitations
The survey has certain limitations that have had a considerable influence on the outcome of this study. Firstly, the amount of participants taking the survey is not significant enough in order to provide well-grounded results for every scenario. Thus, only 3 scenarios went on for further testing. One hundred and fifty-two participants are collected at the beginning however, 51 cases are considered invalid due to participants not following the instructions in the correct way thus, leading to incomplete and inconsistent results. However, it is important to look at the survey from the participants’ perspective. This is because the survey can be perceived as clear and easy to understand in the eyes of the survey creators but some questions might appear as unclear and confusing to some participants.
Secondly, after all of the data has been gathered and analyzed, it has become apparent that the survey is poorly designed, specifically around the emotions and NWOM section. In the survey, all of the emotions are listed first and the question, regarding whether or not the participants have engaged in NWOM comes last. This is a severe flaw since the way that the emotions and NWOM questions are designed has affected the outcome of the correlation between emotions and NWOM further in the analysis. This is because the question regarding NWOM should have been put under each emotion listed in the survey in order to see a proper relationship between each emotion in regards to NWOM, rather than having it under all of the emotions as a group. Finally, there are several less serious flaws in the NWOM question design, but they can still be confusing and therefore altered the results. In the section, there are three statements: “I forgot about the incident and did nothing”, “I complained about the experience to my friends/family”, and “I voiced my displeasure with other parties (online communities, third parties etc.)”. The last two questions are removed from the analysis process since it was decided that the purpose is to discover whether the participants have engaged in NWOM, and not with whom did they engage. For the first question, it is crucial to note that if the participants check “No” as their answer, this means that they did not forget about the incident, and therefore they state that they did engage in NWOM. If they check “Yes”, this means that they forgot about the incident and did not engage
29
in NWOM. However, this was not a problem for the SPSS Statistics program, since it just showed the results in the “No” rather than the “Yes” paragraph, which is the most commonly seen way in other survey test results. Still, the use of double negatives could be considered as confusing to the survey participants who might have given the wrong answer in result of the poor survey design. The use of double negatives in surveys such as answering with “No” to a negative statement when meaning to say “Yes” to a normal positive statement seems to be complicated and unnecessary. The most efficient way to address the issue would have been to simply ask “Did you engage in NWOM” instead of providing three statements, two of which are not applicable, nor resourceful to the findings.
Although some of these limitations were out of our control, several of them were controllable. We cannot control the way participants perceive the survey and the questions, as well as how they answer them. The survey design, on the other hand, was controlled by us and it is something that needed more considerations put into it. It could have been executed more efficiently and effectively. It is also important to consider that participants may have different personalities thus, they may differ in terms of complaining. Some individuals might be more willing to engage in NWOM and voice their opinion after encountering a service failure whereas others might not.
30
4. Data Analysis
In this section, the data coming from the survey results is analyzed and described. Thereafter, the results are interpreted and connected to theory. Finally, the result of the hypothesis testing is presented. The section is structured so that each test is discussed completely separately before moving on to the next one.
4.1. General profile of the survey
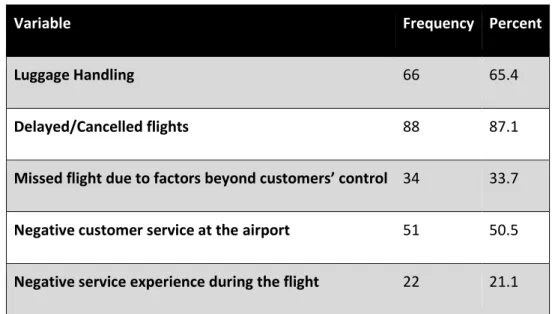
Table 2, presented at the bottom of the paragraph, shows in more details the types of service failures asked about within the questionnaire as well as the percentage of respondents that have experienced a specific service failure. In the 101 remaining surveys after excluding the invalid ones, each participant has experienced at least one or more of the scenarios listed. The first scenario asks about luggage handling service failure in which 66 of the participants answer positively to having experienced it. The next negative experience is about delayed or canceled flights. This scenario has the highest “yes” frequency of all the scenarios, with 88 people saying they have been through a delayed or a canceled flight situation. The third scenario asks questions about missed flights due to factors beyond the customers’ control and 34 people from the survey have experienced a missed flight. The fourth scenario is about negative customer service at the airport. This service failure could include any service experience with the airlines themselves as well as any negative interactions with the ground personnel. In this case, over half of the participants, 51 people, have had a negative airport service experience. The final scenario is about negative service experience during the flight. This one is defined as all service interaction during the customers’ flight. Of all the scenarios, this one has the lowest “yes” frequencies with only 22 people having gone through it.
31
Variable Frequency Percent
Luggage Handling 66 65.4
Delayed/Cancelled flights 88 87.1
Missed flight due to factors beyond customers’ control 34 33.7
Negative customer service at the airport 51 50.5
Negative service experience during the flight 22 21.1
Table 2: Profile of scenarios and their frequency
4.2. Factor Analysis and Reliability Test
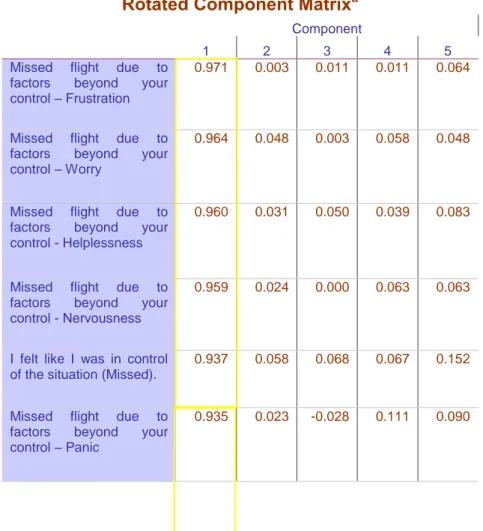
The exploratory factor analysis is used for exploring the data set. It is not used for reaching conclusions about the hypothesis (Costello & Osborne, 2005). There are different types of factor analyses, but regardless of the chosen method, all types of factor analyses help take the total number of variables and their values, and reduce them to groups of variables called components (Costello & Osborne, 2005; Laerd Statistics, 2015). The components are interpreted from a value called eigenvalue found in the rotated components matrix. Eigenvalues represent the total variance of all the data (Hair, Black, Babin, Anderson, & Tatham, 2006). The variance measures how far a value is from the mean (Laerd Statistics, 2018). Eigenvalues that have values greater than or equal to 1.00 are considered to carry the most variance in the data and are therefore given the most attention (Hair et al., 2006). The components in this research are extracted based on the rotated components matrix table that is created during the factor analysis test. Rotated components are also referred to as factor loadings. These loadings show how each variable within a component group correlates to each other within that component (Laerd Statistics, 2015). However, components should not correlate with each other. The varimax rotation function in SPSS prevents that from happening. A varimax rotation is a rotation that produces components that are not related to each other (Costello & Osborne, 2005). It is cautioned by Costello and Osborne (2005) that there are no official guidelines when doing a factor analysis and it can be quite subjective which is why it is only used for descriptive purposes.
32
The chosen factor analysis to be conducted is a principal components factor analysis because it is believed that multiple variables (individual emotions) are highly correlated to the control of the situation. The goal of the test is to see the optimal number of components from the original set of variables in order to validate further hypothesis testing. A varimax rotation is used to see if the components in the rotated components matrix would be grouped by individual scenario. The test was done through the factor analysis function in SPSS.
With the absence of reliability, there can be no validity of the scales (Litwin, 1995). Therefore, alongside the factor analysis, a reliability analysis using the Cronbach’s Alpha (𝛼) is also conducted. Cronbach’s alpha is an estimate of the internal consistency (Litwin, 1995; Vaske, Beaman, & Sponarski, 2017). The Cronbach’s Alpha is a good indicator on how well items measure the same issue (Litwin, 1995). According to Sekaran (2003), Cronbach’s Alpha below a .6 is considered poor, while a .7 is acceptable and a .8 is good. Reliability analysis has at least 3 general assumptions. The first assumption is that errors should be uncorrelated (Zimmerman & Williams, 1977). In other words, an error that occurs in variable A, cannot occur in variable B (Erikson, 1982). Since this study is based on participants’ own experiences, it is assumed that there are no errors in the participants’ answers thus, having no effect on the variables. The second assumption is that coding should be consistent across all variables of data. The final assumption is that all observations should be independent of each other (Cureton, 1963). With the data set meeting all the basic assumptions, a reliability analysis can be conducted. The test is created in SPSS’s reliability analysis function and all data is interpreted from the results.
4.1.1. Factor Analysis and Reliability test results
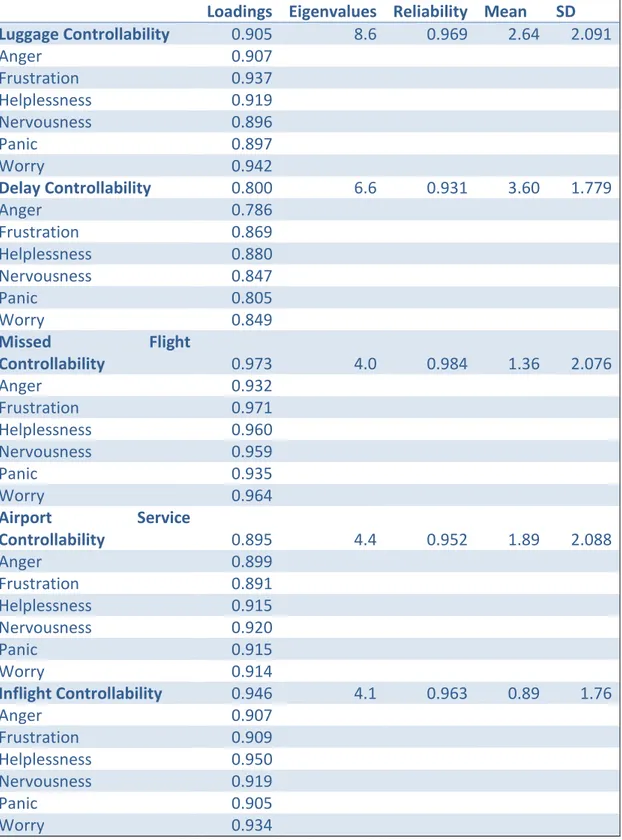
Table 3, which is situated in the bottom of section 4.1.1., shows multiple values organized under each scenario. The top of the table shows factor loading values for each specified emotion and controllability of the scenario. The results of the factor loading value show that components contain controllability over the situation and the various emotions based on their respected scenario. The emotions are ordered in the way they are presented in the questionnaire. To see the order that the variables are in within the components rotation matrix, appendix 1, table 4.1 should be consulted. The crucial point to take from this is that all factor loadings group well within their component. There are no gaps between emotions and controllability.
33
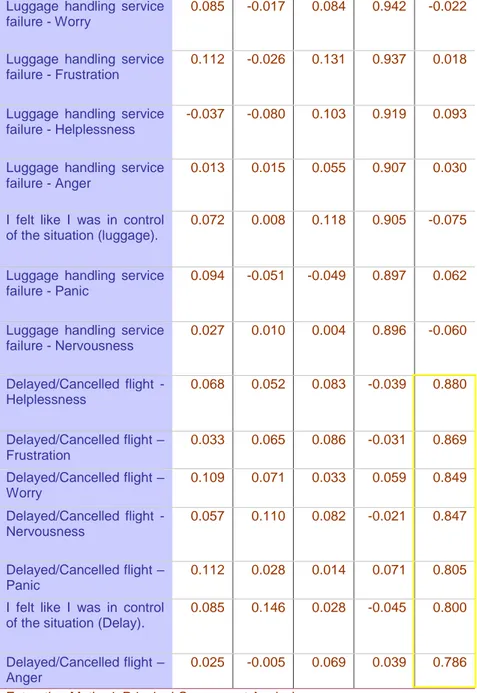
There are 5 components in total found from the factor analysis. The first factor component expressed on the rotated component matrix is missed flight due to factors beyond the customers’ control scenario which has panic being the closest emotion to interact with controllability during that situation. Helplessness is the closest item to interact with controllability of the scenario during a negative service experience during the flight. The third scenario in the matrix is control during a negative customer service at the airport scenario. There are two items that correlate well with the control in the situation and those items are anger and frustration. Both items are only .04 points away from control. The fourth scenario is the luggage handling service failure, and there anger has the closest interaction with controllability. The final component is cancelled or delayed flight with panic again being the highest emotion interacted to the control of the situation. Finally, the eigenvalue of each situation is also given to express how much variance is in the total data that service failure carries.
The mean and standard deviation of control over the situation are also expressed above each emotion. Those are placed there because control is considered the independent variable in later hypothesis testing and perhaps these descriptive figures may play a crucial part in later analysis. In appendix 1, table 4.2, the Cronbach’s alpha for the entire data set is shown. The entire set has a .904 alpha which is excellent in accordance to the scale. Cronbach’s alpha for each scenario is given in the table. All of them meet the acceptable criteria for reliability analysis thus, further strengthening the reliability of the data. The reliability test and factor analysis infer that it is acceptable to continue with hypothesis testing. The table below has gathered all the data from the reliability test and factor analysis from all scenarios, but after performing these tests to check which data is valid, three out of five scenarios will be included in the subsequent tests - the luggage handling service failure scenario, the delayed/cancelled flight scenario, and the negative customer service at the airport scenario. Only these three are valid, because after the modification, they are the only ones that have over 50 answers, and 50 is the minimal number of answers that need to be present in order for a sample to be considered as valid. After excluding all this data, the three remaining scenarios are tested.
34
Loadings Eigenvalues Reliability Mean SD Luggage Controllability 0.905 8.6 0.969 2.64 2.091 Anger 0.907 Frustration 0.937 Helplessness 0.919 Nervousness 0.896 Panic 0.897 Worry 0.942 Delay Controllability 0.800 6.6 0.931 3.60 1.779 Anger 0.786 Frustration 0.869 Helplessness 0.880 Nervousness 0.847 Panic 0.805 Worry 0.849 Missed Flight Controllability 0.973 4.0 0.984 1.36 2.076 Anger 0.932 Frustration 0.971 Helplessness 0.960 Nervousness 0.959 Panic 0.935 Worry 0.964 Airport Service Controllability 0.895 4.4 0.952 1.89 2.088 Anger 0.899 Frustration 0.891 Helplessness 0.915 Nervousness 0.920 Panic 0.915 Worry 0.914 Inflight Controllability 0.946 4.1 0.963 0.89 1.76 Anger 0.907 Frustration 0.909 Helplessness 0.950 Nervousness 0.919 Panic 0.905 Worry 0.934