09/03/2021 Art.no: 2021-3-7273 1(4)
Social Services , published 2021 ISSN 1401-0216
Statistics on Care and Services for
the Elderly and Persons with
Impair-ments – Management Form 2020
This statistics shows the distribution of management forms for the most common types of Care and Services provided by municipalities for elderly and persons with impairments. In the year 2020, statistics show that private management of short-term care and home help services are more common for persons with impairment than for elderly.
Home help service hours under private
management have increased over time
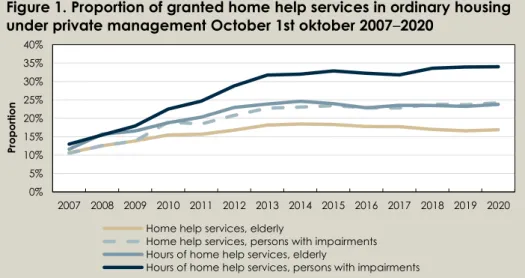
On October 1st 2020, almost 258,000 persons were receiving home help servicesin ordinary housing. Of which, 236,000 were elderly (92 percent) and 21,000 were persons with impairments. Almost 40,000 elderly and 5,100 persons with impairments received home help services under private management, which amounts for 17 and 24 percent, respectively. The proportion was even greater for hours of home help services. Private management is responsible for one out of four service-hours for elderly and one out of three service-hours for persons with impairments.
Figure 1 shows the development since 2007. The proportion of hours of home help services for persons with impairments under private management has in-creased from 13 percent in 2007 to 34 percent in 2020. For elderly the increase was from 12 percent to 24 percent. The proportion of people who have home help services under private management has also increased but at a lower rate.
0% 5% 10% 15% 20% 25% 30% 35% 40% 2007 2008 2009 2010 2011 2012 2013 2014 2015 2016 2017 2018 2019 2020 Pr op or tion
Home help services, elderly
Home help services, persons with impairments Hours of home help services, elderly
Hours of home help services, persons with impairments
Source: Statistics on Care and Services for Elderly and People with Impairments. The National Board of Health and Welfare
Figure 1. Proportion of granted home help services in ordinary housing under private management October 1st oktober 2007–2020
THE NATIONAL BOARD OF HEALTH AND WELFARE 09/03/2021 Art.no: 2021-3-7273 2(4)
Social Services , published 2021 ISSN 1401-0216
Private management – health and social care for which the municipality
is responsible and payable for, but which is provided by for example a company (incl. municipal companies), foundation or cooperative, or where the municipality purchases places in special houses from.
Municipal management – health and social care provided primarily by
staff employed by the municipality.
Short-term care – assistance in the form of a temporary care around the
clock outside regular residence. This type of care can, for example, be re-habilitation, nursing, and intermittent care and relieving for relatives.
The proportion of short-term care under
private management decreases
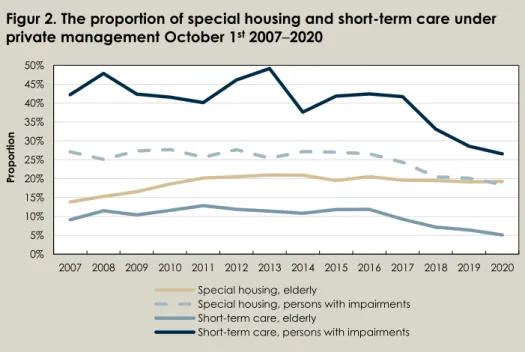
Nearly 5 500 elderly and just over 600 persons with impairments were in short-term care on October 1st 2020. Five percent of the places for elderly and 27
per-cent of the places for persons with impairments were under private management (figure 2). The proportion of elderly and persons with impairments receiving short-term care under private management has decreased over time. The de-crease was greatest among persons with impairments. During the peak year 2013, almost half of those with impairment lived in short-term care under private management.
The proportion of elderly living in special housing under private management has increased over time, contrary to the proportion among persons with impair-ment. In the year 2020, it was roughly equally common with special housing un-der private management in both groups.
0% 5% 10% 15% 20% 25% 30% 35% 40% 45% 50% 2007 2008 2009 2010 2011 2012 2013 2014 2015 2016 2017 2018 2019 2020 Pr op or tion
Special housing, elderly
Special housing, persons with impairments Short-term care, elderly
Short-term care, persons with impairments
Source: Statistics on Care and Services for Elderly and People with Impairments. The National Board of Health and Welfare
Figur 2. The proportion of special housing and short-term care under
THE NATIONAL BOARD OF HEALTH AND WELFARE 09/03/2021 Art.no: 2021-3-7273 3(4)
Social Services , published 2021 ISSN 1401-0216
The number of elderly in special housing
decreases
In October 1st 2020, 84,000 elderly lived in special housing and 5,500 were in
short-term care. The majority lived in special housing and short-term care man-aged by the municipality. The number of elderly living in special housing under municipality management has been relatively stable during the years 2013 to 2019. Between October 1st 2019 and October 1st 2020, the number of elderly in
special housing under municipality management decreased with 3,200 persons (5 percent) which is the greatest decrease since 2007. During this period the number of persons in short-term care under municipal management decreased with 1 500 persons (23 percent). The number of elderly in special housing and short-term care under private management also decreased.
0 10 000 20 000 30 000 40 000 50 000 60 000 70 000 80 000 90 000 2007 2008 2009 2010 2011 2012 2013 2014 2015 2016 2017 2018 2019 2020 Special housing, municipal management
Special housing, private management Short-term care, municipal management Short-term care, private management
Source: Statistics on Care and Services for Elderly and People with Impairments. The National Board of Health and Welfare
Figure 3. Number of elderly in special housing and short-term care
according to management form October 1st2007–2020
Own apartment is the most common
type of housing
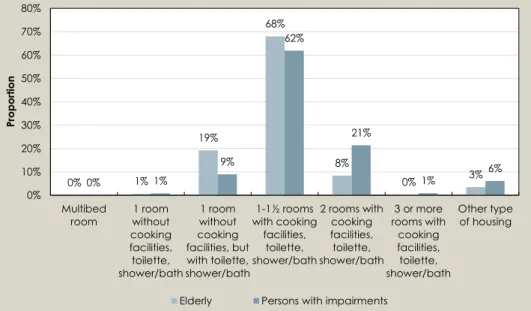
The most common type of housing for elderly and persons with impairments who lives in special housing is a fully equipped apartment with 1 to 1 ½ rooms. Fully equipped means that the apartment has kitchen/kitchenette, toilette and shower/bath. On October 1st 2020, 68 percent of the elderly and 62 percent of
persons with impairment lived in such an apartment. The second most common type of housing for elderly was one room without cooking facilities but with a toilette and shower/bath. For persons with impairment the second most common type of housing was two rooms with cooking facilities, toilette and shower/bath.
THE NATIONAL BOARD OF HEALTH AND WELFARE 09/03/2021 Art.no: 2021-3-7273 4(4)
Social Services , published 2021 ISSN 1401-0216
It is very uncommon, for both elderly and persons with impairments, to share a multibed room with another person other than husband, wife, partner or other relative. This option has decreased substantially over time. In the year 2007, around 1 150 elderly och 30 persons with impairments lived in such a housing. The year 2020, it was in total fewer than 20 persons.
0% 1% 19% 68% 8% 0% 3% 0% 1% 9% 62% 21% 1% 6% 0% 10% 20% 30% 40% 50% 60% 70% 80% Multibed
room without1 room cooking facilities, toilette, shower/bath 1 room without cooking facilities, but with toilette, shower/bath 1-1½ rooms with cooking facilities, toilette, shower/bath 2 rooms with cooking facilities, toilette, shower/bath 3 or more rooms with cooking facilities, toilette, shower/bath Other type of housing Pr op or tion
Elderly Persons with impairments
Source: Statistics on Care and Services for Elderly and People with Impairments. The National Board of Health and Welfare
Figure 4. The distribution of types of housing for elderly and persons
with impairment October 1st2020
Contact information:
Kristina Klerdal (questions regarding statistics) E-mail: kristina.klerdal@socialstyrelsen.se Michaela Prochazka (questions regarding elderly) E-mail: michaela.prochazka@socialstyrelsen.se
Karin Flyckt (questions regarding persons with impairments) E-mail: karin.flyckt@socialstyrelsen.se
Telephone (telephone exchange): +46 (0) 75 247 30 00
More information
You can find more tables, graphs and information here:
https://www.socialstyrelsen.se/statistik-och-data/statistik/statistikam- nen/socialtjanstinsatser-till-aldre-och-personer-med-funktionsnedsattning-efter-regiform/