Department of Animal Breeding and Genetics
Establishing a Canine Genome Sequencing
Protocol using Oxford Nanopore
Anna Darlene van der Heiden
Master’s thesis • 30 credits
Establishing a Canine Genome Sequencing Protocol using
Oxford Nanopore
Anna Darlene van der Heiden
Supervisor: Tomas Bergström, Swedish University of Agricultural Sciences, Department of Animal Breeding and Genetics
Assistant supervisor: Suvi Mäkeläinen, Swedish University of Agricultural Sciences, Department of Animal Breeding and Genetics
Examiner: Sofia Mikko, Swedish University of Agricultural Sciences, Department of Animal Breeding and Genetics
Credits: 30 credits
Level: Second cycle, A2E
Course title: Independent project in Animal Science
Course code: EX0870
Course coordinating department: Department of Animal Breeding and Genetics
Place of publication: Uppsala
Year of publication: 2019
Online publication: https://stud.epsilon.slu.se
Keywords: Oxford Nanopore, long-read sequencing, nanopore sequencing, canine genome
Swedish University of Agricultural Sciences Faculty of Veterinary Medicine and Animal Science Department of Animal Breeding and Genetics
Abstract
The development of sequencing technologies has led to monumental advances in the field of genomics, creating new areas of investigation and profoundly impacting our understanding of life itself. Presently, the “third generation” of these technologies is focused on improving the sequencing of long reads, which allows for studying complex areas in the genome. A promising platform offering long-read sequencing at a comparatively low cost is the Oxford Nanopore Technologies “MinION,” a USB-connected device the size of an ordinary dongle, which can be used in as good as any laboratory setting with a consumer-grade computer. Given that the technology is both recent and still under development, however, there is a need to formulate and verify adequate methodologies for a great variety of target species. In this thesis, a protocol for long-read sequencing of canine DNA using the MinION is presented. Four different HMW-gDNA extraction methods and five library preparation variants were evaluated in order to determine which approach would generate the best sequencing results. Additionally, a method for reusing flow cells in order to maximize data generated per cell and reducing costs was tested and deemed successful. Major challenges encountered throughout the project include DNA quality, fragment length, as well as high rates of pore loss and low pore occupancy. The best-performing DNA extraction protocol was an altered version of Qiagen's Genomic-tip 100/G. For library preparation, a modified version of Nanopore's Sequencing by Ligation kit (SQK-LSK109) had the most favourable results. The best sequencing run generated 14 Gbp of raw data in the span of 48 hours. The results presented herein constitute a first step towards the establishment of a method that leverages the MinION's advantages in canine genome sequencing projects.
Keywords: Oxford Nanopore, long-read sequencing, nanopore sequencing, canine
El desarrollo de tecnologías de secuenciación ha conducido a avances monumentales en el campo de la genómica, creando nuevas áreas de investigación e impactando profundamente nuestro entendimiento de la vida misma. Actualmente, la "tercera generación" de estas tecnologías se concentra en mejorar la secuenciación de lecturas largas, lo que permite estudiar áreas complejas del genoma. Una nueva y prometedora plataforma que ofrece secuenciación de lecturas largas a un costo comparativamente bajo es el “MinION”, de la compañía Oxford Nanopore Technologies, cuyo tamaño, similar al de un adaptador USB, permite que pueda utilizarse en cualquier tipo de laboratorio. Sin embargo, dado que esta tecnología es relativamente reciente y aún se encuentra en desarrollo, es necesario formular nuevas metodologías que sean adecuadas para diferentes tipos de especies. Esta tesis presenta un protocolo para la secuenciación de lecturas largas de ADN canino utilizando el dispositivo MinION. Se evaluaron cuatro métodos de extracción de ADN de alto peso molecular y cinco métodos de preparación de bibliotecas con el fin de determinar qué protocolo produce los mejores resultados. Asimismo, con el fin de maximizar los datos generados por celda de flujo y reducir costos, se analizó un método para reutilizar celdas de flujo, el cual fue considerado exitoso. Los principales desafíos que se encontraron a lo largo de este proyecto incluyen la obtención de ADN de calidad y de alto peso molecular, así como la alta tasa de pérdida de nanoporos. El protocolo de extracción de ADN que produjo los mejores resultados fue una versión alterada del kit de Qiagen Genomic-tip 100/G. Para la preparación de la biblioteca, una versión modificada del kit de Secuenciación por Ligadura de Nanopore (SQK-LSK109) tuvo los resultados más favorables. El mejor experimento de secuenciación generó 14 Gbp en el lapso de 48 horas. Los resultados aquí presentados constituyen un primer paso para el establecimiento de un método que aprovecha las ventajas del MinION para proyectos de secuenciación del genoma canino.
Palabras claves: Oxford Nanopore, secuenciación de lecturas largas, secuenciación
por nanoporos, genoma canino.
First, I would like to thank my advisors Tomas Bergström and Suvi Mäkeläinen for introducing me to this fascinating project and for always being there when needed. Without their invaluable support and guidance this thesis would not have come to fruition.
Next, I would like to express my gratitude to my examiner, Sofia Mikko, for her detailed review and valuable feedback, as well as to Christian Brandt, Ola Wallerman, and Oskar Karlsson, for always being willing to share their advice and ONT expertise.
I would also like to thank my laboratory partner, Nora Abdulkader, whose help and company made the long laboratory-hours pass by like a breeze.
Finally, I would like to thank my parents for their infinite support and encouragement, and my partner for being there for me every single step of the way, coffee and tea at the ready and acquiescing to many late-night proof-reading sessions. This accomplishment would not have been possible without them.
Acknowledgements 6
List of tables 9
List of figures 10
Abbreviations 13
1 Introduction 15
1.1 The First Generations of Sequencing Technologies 15
1.2 Third-Generation Sequencing 17
1.2.1 Why Long-Read Sequencing? 17
1.2.2 Long-Read Sequencing Platforms: PacBio and Oxford Nanopore 18 1.2.3 HMW-gDNA Extraction Methods for Long-Read Sequencing 23
1.3 The Dog as an Animal Model 26
1.4 Aim 27
2 Methods 28
2.1 Animal Samples 28
2.2 HMW-DNA Extraction 29
2.2.1 MagAttract® HMW DNA Kit 30
2.2.2 QIAGEN Genomic-tip 100/G 31
2.2.3 Fire Monkey 34
2.2.4 Phenol-Chloroform 35
2.3 DNA Quality Control 36
2.4 DNA Purification and Size Selection 36
2.4.1 AMPure XP Purification 36
2.4.2 Circulomics Size Selection 36
2.4.3 Needle Shearing 37
2.5 Library Preparation and Sequencing 37
2.5.1 Ligation Sequencing Kit (SQK-LSK109) 38
2.5.2 Rapid Sequencing Kit (SQK-RAD004) 40
2.5.3 Rapid Barcoding Kit (SQK-RBK004) 40
2.6 ONT Flow Cell Wash and Nuclease Flush 40
2.7 Data acquisition and analysis 41
3 Results and Discussion 44
3.1 HMW-DNA Extraction 44 3.2 Oxford Nanopore Sequencing: Protocol Optimization 48
3.2.1 ONT Library (SQK-LSK109) 48
3.2.2 ONT Library (SQK-RAD004 and SQK-RBK004) 55
3.2.3 Maximizing Flow Cell Utility 56
3.3 Final Results per Individual 59
3.3.1 Visualizing Long-Reads in the MHC Region 59
3.4 Conclusions 61
4 References 62
Appendix 1 66
Appendix 2 73
Table 1. Sample list. Column 1. The dog ID is composed of a three-letter code that refers to the individual’s breed, followed by a unique number. Column 2. Each blood sample was divided into several aliquots which were identified with an aliquot ID number. Column 3. The blood volume corresponds to the amount of blood taken per aliquot. Column 4. The column contains the
breed of each individual. 29
Table 2. Summary of tested HMW-DNA extraction protocols. All specifications were obtained from the corresponding manufacturers. 30
Table 3. Nuclei extraction sample list. 32
Table 4. QIAGEN Genomic-tip 100/G sample list. O = Original protocol; MV =
Modified Version. 34
Table 5. Phenol-Chloroform protocol test samples. Samples LAB3_4 and LAB3_5 were extracted using 1.5 ml Eppendorf tubes. The remaining samples were
extracted using 50 ml Falcon tubes. 35
Table 6. HMW-DNA extraction results. 47
Table 7. Comparison of ligation enzymes. Enzymes tested: NEBNext® Quick Ligation Module (QLM) and NEBNext® Ultra II™ Ligation Module (ULM). The library input refers to the amount of DNA used for library preparation, and the Seq. input is the amount of DNA loaded into the flow cell. The highlighted row belongs to the most successful run of this experiment. 51 Table 8. Comparison between Circulomics size selection and no size selection.
Circulomics size selected samples had a greater mean read length than samples without size selection. On the other hand, non-size selected samples yielded a higher amount of data than size-selected samples. 52 Table 9. Flow cells use. Number of new and reused flow cells used per individual
and total amount of data generated. 56
Table 10. Results from Oxford Nanopore sequencing runs. Abbreviations: C (Circulomics size selection); NS (Needle shearing). 58 Table 11. Final results per individual. This table gathers all the relevant sequencing
information per individual. 59
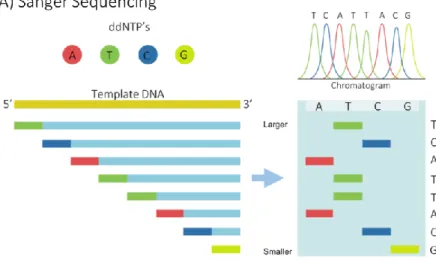
Figure 1. Examples of first and second generation sequencing technologies. A) Sanger sequencing process overview. B) Illumina sequencing process
overview. 16
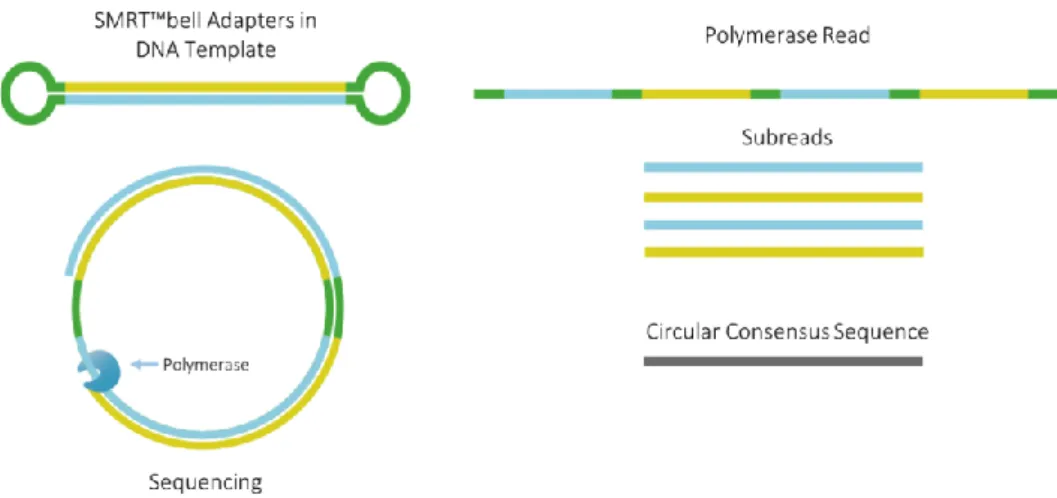
Figure 2. PacBio sequencing process overview. The polymerase incorporates labelled nucleotides into the template strand and a fluorescent signal is released and detected. The graph on the right shows a simplified version of how the sequence can be inferred from the fluoresent signal. 18 Figure 3. SMRTbell™ approach for increased accuracy. Hairpin adaptors (green)
are attached to both ends of the dsDNA fragment (blue and yellow) and create a circular molecule. The number of passes through the polymerase create a series of subreads that are used for creating a consensus
sequence of high accuracy. 19
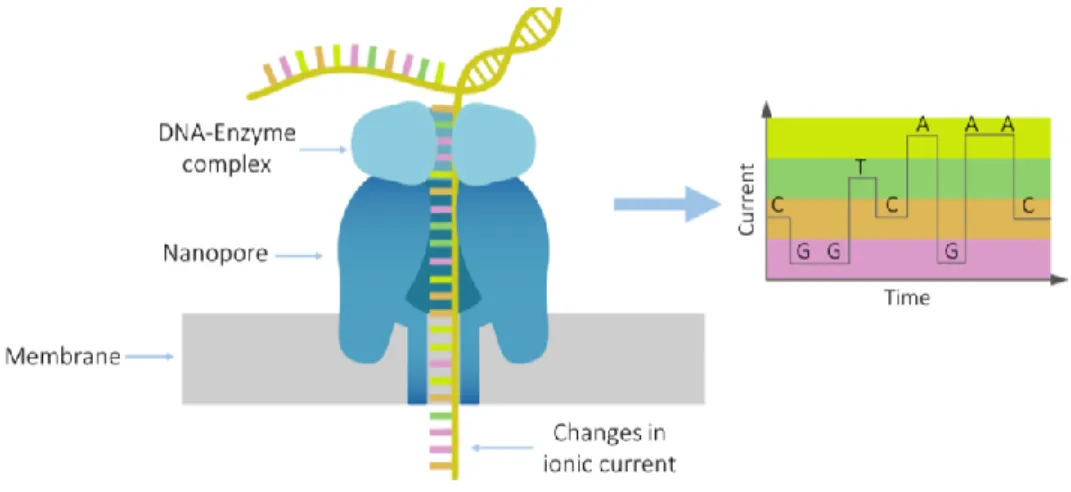
Figure 4. Oxford Nanopore technology overview. A strand of DNA passes through the pore while an electric current is applied. Changes in the current created by each base are recorded and translated into a sequence. The graph on the right shows a simplified version of how the sequence can be inferred
from the different current signals. 20
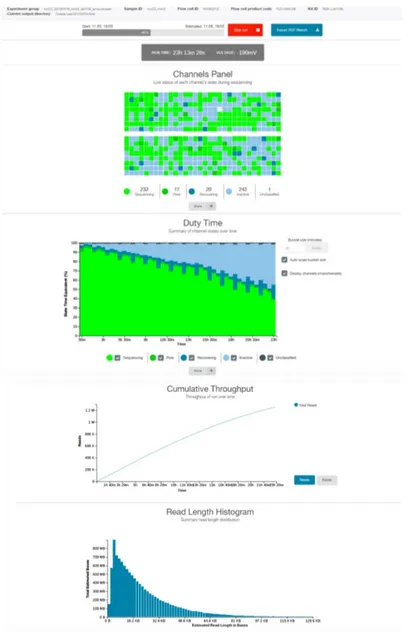
Figure 5. MinKNOWTM user interface. The channel panel shows the current state of
the pores, while the duty time plot provides a summary of the state of the channels over time. The cumulative throughput reveals the amount of data collected during the run and the read length histogram shows the length
distribution of the sequenced reads. 21
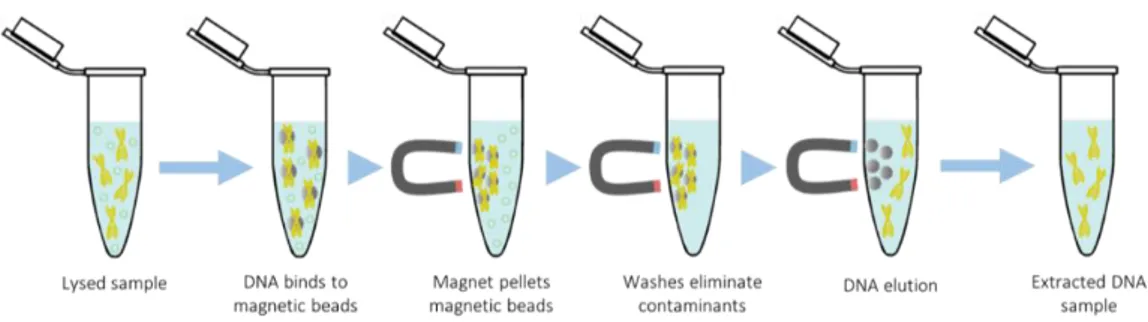
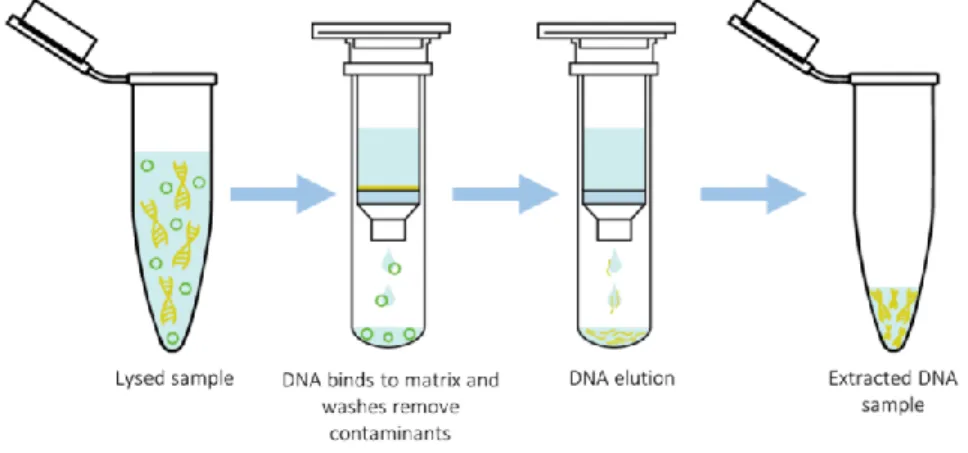
Figure 6. Magnetic beads DNA extraction process overview. 23 Figure 7. Anion-exchange resin DNA extraction process overview. This example
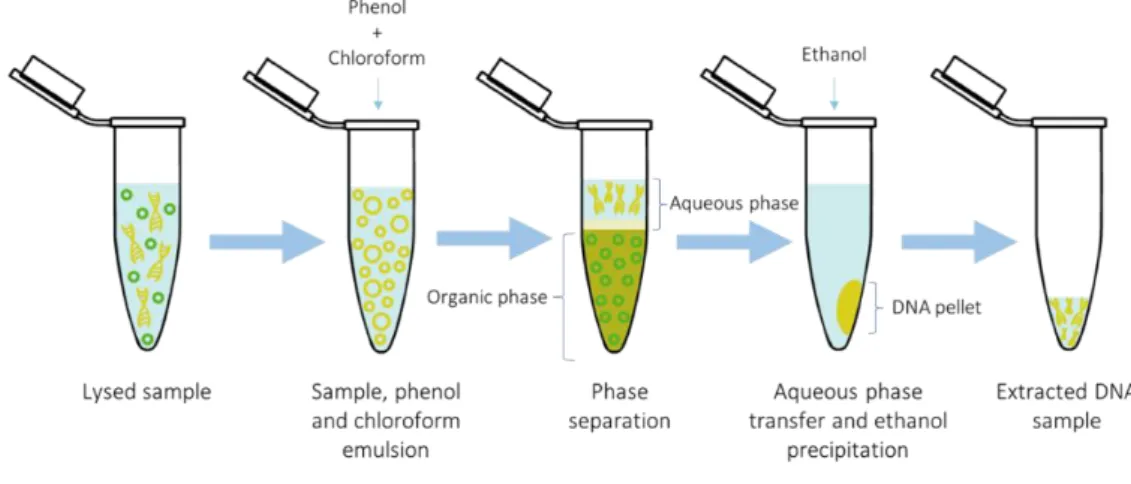
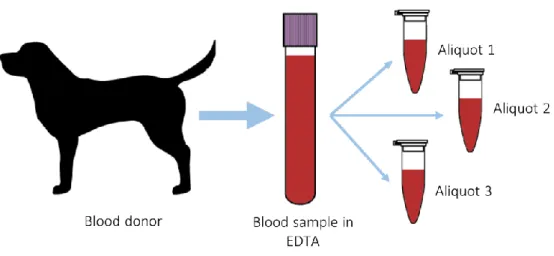
is based on Qiagen’s Genomic-tip extraction kit. 24 Figure 8. Spin column with silica matrix DNA extraction process overview. 25 Figure 9. Phenol-Chloroform DNA extraction process overview. 26 Figure 10. Blood sample processing workflow. Each blood sample was divided
into several aliquots so several extraction and sequencing tests could be
made from the same individual. 28
Figure 11. Nuclei pellet. 31
Figure 12. Genomic-tip 100/G extraction setup (Qiagen, Hilden, Germany). 33
Figure 13. MinION sequencing device and flow cell components. 37 Figure 14. Example of output generated by ONT’s R script for run quality
control. 42
Figure 15. Data analysis workflow. 43
Figure 16. Electrophoresis results. All samples show an average fragment length of >20 kbp. A) Sample SVH1_1 extracted with MagAttract® MHW DNA Kit. B) Samples LAB1_1 and LAB1_2 extracted with QIAGEN Genomic-tip 100/G and purified using AMPure XP beads. C) All remaining samples that were extracted with QIAGEN Genomic-tip 100/G and the different purification and size selection treatments that were used for each sample (e.g. AMPure XP purification, Circulomics Short Read Elimination Kit, and needle shearing). Samples 1,2,3, and 5 had higher degree of fragmentation than others. Samples 11-15 had overloading issues due to high-DNA
concentration. 46
Figure 17. Example of pore-loss as an accumulation of ‘inactive pores’ (light blue). To the left there is an example of successful library that ran for 23 hours and still has available pores for sequencing (light green). To the right is an example of a library that has run for 23 hours and cannot continue due
to pore-loss. 49
Figure 18. Example of low pore occupancy. The high ratio of ‘pore’ (dark green) to ‘sequencing’ (light green) means that the amount of DNA passing through
the pores is very low. 50
Figure 19. Circulomics size selection test. A) Run without size selection: regular pore-loss, mean read length leaning towards 15 kbp and 4.97 Gbp called. B) Run with Circulomics size selection: increased pore-loss, mean read length leaning towards 20 kbp, and 2.36 Gbp called. 52 53
Figure 20. Run 20 final report after running for 48 h. Duty time shows low pore-loss and high pore-occupancy. The read length histogram indicates that the majority of the reads sequenced had a size below 16 kbp (mean read length:
7,619 bp). 53
Figure 21. Run 7 and 8 final reports after a 20 h run. In both cases, duty time shows a rapid pore-loss and the read length histogram indicates that almost all the
reads were around 6 kbp. 54
Figure 22. Run 3 results. This run was done in GOH1_1, the only sequenced sample that was extracted using RevoluGen’s FireMonkey kit. There was a sudden pore loss after 8 h of running and an accumulation of ‘recovering’ (light blue) and ‘inactive’ (dark blue) pores. The read length histogram also shows that the majority of the fragments had a size below 16 kbp. 55 Figure 23. Pores recovered after nuclease flush. The number of pores corresponds
to the total amount of pores that were available for sequencing at the start
of a run with a used flow cell. 57
Figure 24. Sequenced reads mapped against CanFam3.1 reference genome. This region belongs to the MHC class II DLA-DRB gene (12:2,151,409-2,164,562). Discrepancies between the mapped reads and the reference
genome are highlighted in purple, while matching areas are colored in gray. A) Zoom out version. Long reads can be seen covering entire genes. B)
CCS Circular Consensus Sequence
CNV Copy Number Variation
ddNTPs Dideoxynucleotides
DEAE Diethylaminoethyl
DLA Dog Leukocyte Antigen
DNA Deoxyribonucleic Acid
dsDNA Double-stranded DNA
EDTA Ethylenediaminetetraacetic Acid
FFPE Formalin-Fixed Paraffin-Embedded
GB Giga Base Pairs
GPU Graphics Processing Unit
gDNA Genomic DNA
HMW High Molecular Weight
IGV Integrative Genomic Viewer
MHC Major Histocompatibility Complex
NGS Next Generation Sequencing
ONT Oxford Nanopore Technologies
PacBio Pacific Biosciences
QC Quality Control
RNA Ribonucleic Acid
RT Room Temperature
SBS Sequencing by Synthesis
SGS Second Generation Sequencing
SMRT Single Molecule Real Time
SMS Single Molecule Sequencing
ssDNA Single-stranded DNA
ZMW Zero-mode Waveguide
1.1 The First Generations of Sequencing Technologies
Ever since its discovery, scientists have marvelled at the genetic code and its role in life. As sequencing technologies allowing its interpretation emerged, revolution in a great variety of fields, spanning from genomics and biotechnology to medicine and forensics, quickly followed.The first generation of sequencing technologies was spearheaded by Sanger sequencing, also known as dideoxy chain termination method, which was developed by Sanger et al in 1977. This method relies on size-based separation of DNA fragments utilizing capillary electrophoresis, and the detection of dye-labelled dideoxy nucleotides (ddNTPs) at the end of each fragment. The order in which the fragments migrate through the capillary and the type of signal produced by their terminal ddNTP are used to infer the nucleotide order of the target sequence (Figure
1) (Maxam and Gilbert, 1977; Sanger, Nicklen and Coulson, 1977). For many years,
Sanger remained the pinnacle of sequencing technologies; however, high cost and limited throughput impelled research and development of new methods, and soon a new generation of sequencing technologies emerged.
The next generation of sequencing technologies (NGS) is characterized by its high throughput and cost-efficiency, which is achieved by means of massive parallel sequencing of short reads. Roche’s 454, launched in 2005, was the first product of this generation, but nowadays the Illumina platform dominates the market (Margulies et al., 2005; Kchouk, Gibrat and Elloumi, 2017; Besser et al., 2018).
The Illumina sequencing process starts by fragmenting the target DNA and attaching adapters to both ends of each fragment. The sample is then loaded into a flow cell covered by millions of complementary oligos that bind the DNA strands to the flow cell’s surface. Thereafter, each fragment is multiplied by means of bridge amplification, which creates clusters of the same sequence. Then, a process called sequencing by synthesis (SBS) is performed; primers are attached to the DNA strands and a polymerase incorporates fluorescent-labelled nucleotides into the target fragment one at a time. Each base type produces a specific fluorescent signal that is detected and quantified by a camera, and then translated into a nucleotide sequence through a process called basecalling (Figure 1) (Bentley et al., 2008; Illumina, 2019).
Figure 1. Examples of first and second generation sequencing technologies. A) Sanger sequencing process overview. B) Illumina sequencing process overview.
Compared to Sanger, NGS technologies have improved throughput by orders of magnitude at an accessible cost. The biggest drawback of these technologies, however, lie in their read length, which ranges from 50 to 500 bp, unlike Sanger sequencing that is able to achieve 1000 bp (Sanger, Nicklen and Coulson, 1977; Bentley et al., 2008; Pollard et al., 2018). Shorter reads can lead to fragmented genome assemblies, as well as limited resolution of repetitive regions and structural variations (Huddleston et al., 2014; Ashton et al., 2015; Bowden et al., 2019). In order to overcome this limitation further developments were made, which soon gave rise to what is now commonly referred to as third-generation sequencing.
1.2 Third-Generation Sequencing
Third-generation sequencing, also known as long-read sequencing, is characterized by the use of amplification-free single molecule sequencing (SMS), real-time sequencing, and yielding output with vastly longer consecutive fragments (Schadt, Turner and Kasarskis, 2010; Heather and Chain, 2016; Pollard et al., 2018).
1.2.1 Why Long-Read Sequencing?
Long reads offer several advantages over short reads; they can cover extensive areas in the genome, and thus highly complex regions with repetitive elements and structural variations such as insertions, deletions, inversions, and copy number variants, can be solved. They can also aid with phase resolution and the detection of paralogous regions, gene loss, fusion events, and so forth (Huddleston et al., 2014; Ashton et al., 2015; Goodwin, McPherson and McCombie, 2016; Fuselli et al., 2018; Pollard et al., 2018; Stephens et al., 2018; Bowden et al., 2019). With long reads, the accuracy of currently existing and de novo genome assemblies can be greatly improved, which in turn benefits our understanding of genomics, evolution, medicine, and many other scientific fields.
The Major Histocompatibility Complex (MHC) is a suitable example of a complex region that cannot be solved by short reads alone. This region is composed by a cluster of genes that participate in the regulation of immune responses and has been associated with a wide variety of diseases. Furthermore, this region is characterized by its high levels of polymorphisms and copy number variations (CNV), with the DRB exon 2 locus being one of the most polymorphic sites in vertebrates. This complexity makes the MHC an ideal target for long-read sequencing, as long reads are able to cover entire genes and intronic regions, close gaps, and solve CNVs and other structural variations (Beck et al., 1999; Debenham
1.2.2 Long-Read Sequencing Platforms: PacBio and Oxford Nanopore The long-read sequencing market is currently dominated by two companies: Pacific Biosciences (PacBio, CA, USA), and Oxford Nanopore Technologies (ONT, Oxford, UK).
Pacific Biosciences
PacBio platforms (RS-II, Sequel, and the recently launched Sequel II) use what is called Single Molecule Real Time (SMRT) technology. PacBio’s hardware consists of a chip, also referred to as SMRT cell, that contains well-shaped nanostructures called zero-mode waveguides (ZMWs). It is within these wells that sequencing is performed; a single DNA molecule with a pair of adaptors at each end is bound to a polymerase and fixed at the bottom of a well. Then, nucleotides labelled with fluorescent dyes are added, and every time they are incorporated into the strand by the polymerase, a fluorescent signal is released and detected (Figure 2) (Eid et al., 2009; Rhoads and Au, 2015; Weirather et al., 2017).
This innovative method is able to yield reads up to 100 kbp, with a raw error rate ranging from 11% to 15% (Korlach, 2015). To reduce this significant error rate, PacBio has designed a strategy called Circular Consensus Sequence (CCS), which requires the ligation of SMRTbell™ hairpin adapters at both ends of the double stranded DNA (dsDNA), creating a circle-shaped molecule. The DNA passes through the polymerase multiple times and a consensus sequence is created (Eid et
al., 2009; Travers et al., 2010; Korlach, 2015). For every turn the molecule
completes, the error rate decreases. As an example, Eid et al., (2009) report that 15 Figure 2. PacBio sequencing process overview. The polymerase incorporates labelled nucleotides into the template strand and a fluorescent signal is released and detected. The graph on the right shows a simplified version of how the sequence can be inferred from the fluoresent signal.
passes result in an average of >99% accuracy. Given that the number of sequencing passes is limited by the polymerase’s lifetime, shorter fragments are able to complete more turns than longer fragments, and thus yield higher accuracy (Figure
3). Therefore, the trade-off between accuracy and read length must always be taken
into account (Eid et al., 2009; Travers et al., 2010).
In addition to the high error rate, drawbacks of this technology include the high cost of its instruments and SMRT cells, as well as the stringent facility requirements (Weirather et al., 2017). It should be noted, however, that a new PacBio platform called Sequel II was launched in April 2019. This new system claims to improve accuracy, yield larger quantities of data, and lower costs, but as of yet no user-based reviews have been published (PacBio, 2019).
Oxford Nanopore Technologies
Oxford Nanopore Technologies (ONT) focuses on the development of nanopore-based sequencing technologies. Their first product, the MinION, was introduced in 2014 and made commercially available in 2015. A characteristic feature of the MinION is its small size and portability; with dimensions not much larger than a regular USB dongle. Nowadays ONT offers four different sequencing platforms: the original MinION, the GridION, PromethION and the Flongle. All ONT devices use the same technology, differing only in their size and number of pores available (ONT, 2019a and 2019d).
Figure 3. SMRTbell™ approach for increased accuracy. Hairpin adaptors (green) are attached to both ends of the dsDNA fragment (blue and yellow) and create a circular molecule. The number of passes through the polymerase create a series of subreads that are used for creating a consensus sequence of high accuracy.
The technology behind Oxford Nanopore sequencing is quite simple. Its hardware is comprised of a sequencing device and a flow cell that contains an electrically resistant membrane with 2048 nanopores, divided into 512 channels with 4 pores per channel, embedded on it. As for the sequencing process, specific adapters are ligated to both ends of a dsDNA fragment, after which motor enzymes are attached to the adapters, forming a DNA-enzyme complex. Once the sample is loaded into the flow cell, the complex is fixated to a nanopore and the dsDNA is unzipped, allowing for a single DNA strand to translocate the pore. Here an electric current is applied, and a sensor measures the changes in the ionic current caused by the different bases as the strand moves through the nanopore (Figure 4). The raw signal captured by the sensor is later translated into readable sequences by a basecalling algorithm (Kasianowicz et al., 1996; Jain et al., 2016).
Figure 4. Oxford Nanopore technology overview. A strand of DNA passes through the pore while an electric current is applied. Changes in the current created by each base are recorded and translated into a sequence. The graph on the right shows a simplified version of how the sequence can be inferred from the different current signals.
Every nanopore run is controlled by the proprietary software MinKNOW™. This application provides a real-time visualization and analysis of the sequencing run, including metrics on pore and channel performance, output quantity, and read length distribution through a user-friendly interface (Figure 5). Additionally, MinKNOW™ offers the option to perform both sequencing and basecalling simultaneously, or to save the raw data as a .fast5 file for subsequent processing (ONT, 2019b).
Figure 5. MinKNOWTM user interface. The channel panel shows the current state of the pores,
while the duty time plot provides a summary of the state of the channels over time. The cumulative throughput reveals the amount of data collected during the run and the read length histogram shows the length distribution of the sequenced reads.
Because basecalling significantly affects the quality and accuracy of the resulting sequence, the selection of an appropriate basecalling tool is of outmost importance. Modern basecallers developed by ONT make use of Recurrent Neural Networks to improve the accuracy of base classification (Teng et al., 2018). At the time of this study, ONT recommends using Guppy, a GPU-based basecalling toolkit with an integrated flip-flop model for homopolymer and read-accuracy improvement. This program takes the raw .fast5 files produced by MinKNOW™ and generates .fastq files in which the reads are encoded (Rang, Kloosterman and de Ridder, 2018; Teng
et al., 2018; ONT, 2019b). Fastq files can later be used for secondary data analysis
such as read mapping, and de novo assembly (ONT, 2019b).
Oxford Nanopore sequencing is capable of generating two types of reads: 1D and 1D2. The first type corresponds to the reads generated when a single strand of
DNA is translocated through the nanopore. The second type, which is in an earlier stage of development, increases the probability of the ‘complementary strand’ being sequenced immediately after the ‘template strand’, creating 1D2 consensus reads
which can reach an average accuracy of 97%. In exchange for greater accuracy, however, the throughput is decreased (Brown, 2017; ONT, 2017).
The advantages of ONT’s solutions are numerous. First, the comparatively low cost and high portability of its MinION device makes it a viable option even in the smallest laboratory settings. As no fragmentation is necessary, the output read length is directly proportional to the input fragment size, with the current record of a successfully sequenced fragment being 2 Mbp (ONT, 2018). Furthermore, amplification by PCR is optional, and there is a wide variety of library preparation kits optimized for different purposes, including speed, throughput, and accuracy. Nevertheless, the error rate is still comparatively high, ranging from 5% to 15% depending on the read type, and the throughput per flow cell cannot match that achieved by Illumina (Goodwin, McPherson and McCombie, 2016; Jain et al., 2016; Weirather et al., 2017).
As a newcomer in the field, ONT is continuously improving their hardware and chemistry, as well as their supporting bioinformatics tools. In recent years, a wide variety of studies have relied on Oxford Nanopore as their primary sequencing device, achieving satisfactory results (Loman, Quick and Simpson, 2015; Jansen et
al., 2017; Fuselli et al., 2018; Bowden et al., 2019). Although these are all factors
that inspire confidence in the ONT ecosystem and its suitability for future studies, it should be noted that a majority of these publications have been made on bacterial and viral models, therefore further research on other organisms is still required.
1.2.3 HMW-gDNA Extraction Methods for Long-Read Sequencing
Third-generation sequencing technologies are highly sensitive to the quality and length of the starting material. Therefore, isolation of high-quality and high molecular weight genomic DNA (HMW-gDNA) is of great importance (Mayjonade
et al., 2017; Michael, 2017; Gong et al., 2019). Four of the most frequently used
extraction methods are magnetic beads, anion-exchange resins, silica matrices, and phenol-chloroform.
Magnetic beads
The magnetic beads-based extraction protocol uses positively charged magnetic beads (usually a magnetic core coated with silica components) to which the negatively charged DNA is attracted. Once the DNA has been ‘wrapped’ around the magnetic beads, these are pelleted using a magnet, allowing for the unbound material (supernatant) to be removed with ease in the subsequent wash steps. The wash steps are performed in order to discard proteins, lipids, RNA, and other impurities. Finally, the DNA is recovered from the beads by using a low-salt concentration elution buffer (Figure 6).
The main advantage of this method is the reduction of the need for centrifugation, which can shear the DNA molecules and greatly reduce the fragment sizes of the final product (Levison et al., 1998; Berensmeier, 2006). Furthermore, magnetic beads are efficient, easy to use, and can be implemented for additional DNA purification steps, where trace contaminants (e.g. detergents, enzymes, ethanol, salts, etc.) that could affect downstream applications are removed (Berensmeier, 2006).
Anion-exchange resins
The anion-exchange resin is a popular extraction method that leverages the negative charge of the DNA molecule and its affinity towards positively charged diethylaminoethyl (DEAE) groups on the surface of silica beads-based resins. The DNA will remain bound to the resin as washes of low salt concentration buffers remove proteins, RNA, and other impurities. For the elution step, a high-salt concentration buffer is added and the DNA is recovered (Figure 7) (Budelier and Schorr, 1998). This extraction technique is implemented in some commercially available kits such as Qiagen’s Genomic-tip, which uses large columns and gravity-based flow to prevent DNA fragmentation that could compromise the recovery of HMW-gDNA (Qiagen, Hilden, Germany).
Silica matrices: spin columns
Nowadays, spin columns containing silica matrices have become one of the most common methods for DNA isolation. Similar to anion-exchange resins, spin column-based nucleic acid purification is a type of solid phase extraction that relies on the negative charge of the DNA molecule and its affinity towards the positively charged silica matrix. Once the DNA is bound to the matrix, several washes are performed to remove all impurities. Finally, the purified DNA is eluted by using a buffer with low ionic strength and a pH ≥ 7, such as TE buffer or distilled water (Figure 8). When using spin columns, centrifugation is commonly used between sample loading, washing, and elution steps in order to pass the sample or buffers through the silica matrix. Albeit quick, easy to use, and capable of yielding high quality results, this method is not recommended for HMW extractions due to the Figure 7. Anion-exchange resin DNA extraction process overview. This example is based on Qiagen’s Genomic-tip extraction kit.
shearing that occurs due to the frequent centrifugation (Vandeventer et al., 2012, 2013). Nevertheless, companies such as RevoluGen, have strived to develop spin columns that are able to generate HMW-gDNA that can be used on third-generation sequencing platforms (RevoluGen, Berkshire, UK).
Phenol-Chloroform
Phenol-Chloroform extraction is a well-known protocol capable of producing large quantities of high-quality HMW-gDNA, making it an attractive option for long-read sequencing purposes (Jain et al., 2018). The drawback of this method is the extreme toxicity of both phenol and chloroform; utmost care must be taken when handling and disposing these reagents (Xu et al., 2011, 2019).
This method uses organic solvents to separate proteins, lipids, carbohydrates, and other impurities from the aqueous phase, which contains mainly water and nucleic acids. Because of their different densities, the organic solvents containing the cellular debris will settle at the bottom (organic phase) whilst the aqueous phase will stay at the top (Figure 9). To isolate the DNA present in the aqueous phase, ethanol precipitation is carried out. Thereafter, the ethanol is removed from the DNA pellet, which is later dissolved using an elution buffer of choice. It should be noted that pH plays a key role in the isolation of nucleic acids, as DNA requires an alkaline environment to stay in the aqueous phase, while DNA-free RNA instead
remains aqueous in acidic conditions (Tan and Yiap, 2009; Sambrook, 2001; Xu et
al., 2011, 2019).
1.3 The Dog as an Animal Model
The dog (Canis familiaris) is not just man’s best friend, but an interesting species whose unique breeding history and phenotypic diversity make it an ideal animal model for research (Lindblad-Toh et al., 2005; Mellersh and Ostrander, 2005).
The morphological variations and behaviour associated with each breed are powerful tools for detecting the genetics behind a series of traits that are complicated to trace in humans. Furthermore, dogs and humans share several diseases (e.g. diabetes, epilepsy, cancer, blindness, heart diseases, and hip dysplasia) and show similar symptoms, making the dog an exceptional animal for medical research (Lindblad-Toh et al., 2005; Mellersh and Ostrander, 2005). Dogs are also useful for comparative analysis and evolution studies of the mammalian genome and other closely related species such as the wolf and other canids (Mellersh and Ostrander, 2005).
In 2005, Lindblad-Toh et al. (2005) reported the very first high-quality draft genome of the dog. This genome was built using a single individual (a boxer named Tasha) and sequenced using whole genome shotgun (WGS). This milestone in dog genetics permitted the development of a wide variety of studies, however dog breeds are quite different from each other, and using a reference genome of a single breed has its limitations.
Holden et al. (2018) estimate that 27% of the total genetic variability in the dog genome corresponds to variations between dog breeds, whereas human genetic
differentiation ranges between 5 and 10%. This suggests that the current canine reference genome, although a valuable baseline, might not be entirely representative of every single breed.
Breed-specific sequencing could potentially be used for screening genetic variations that are unique or shared among several breeds, offer more information about the evolutive background of the breed or group of breeds of interest, improve the reference genome, and aid in the detection of genetic diseases (Holden et al., 2018).
1.4 Aim
The aim of this thesis was to develop a method for performing long-read sequencing of canine DNA using Oxford Nanopore’s MinION device. This method would be used in a parent project which investigates the evolutionary trajectory of Nordic dog breeds and how they might vary from other breeds.
2.1 Animal Samples
Blood samples from seven dogs of different breeds were collected, in EDTA vacutainers, and stored at 4 °C. Every sample was divided into several aliquots, with the volume for each aliquot depending on the total volume of blood that was obtained during the sampling, allowing for various DNA extractions to be performed per individual (Figure 10 and Table 1).
2
Methods
Figure 10. Blood sample processing workflow. Each blood sample was divided into several aliquots so several extraction and sequencing tests could be made from the same individual.
All samples were processed within a 24-hour timeframe to ensure that only fresh blood was being used during extraction, with the exception of sample SVH1_2 which was processed 15 days after extraction (Table 3).
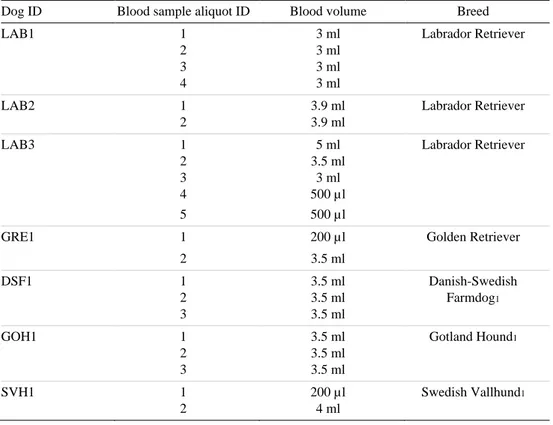
Table 1. Sample list. Column 1. The dog ID is composed of a three-letter code that refers to the individual’s breed, followed by a unique number. Column 2. Each blood sample was divided into several aliquots which were identified with an aliquot ID number. Column 3. The blood volume corresponds to the amount of blood taken per aliquot. Column 4. The column contains the breed of each individual.
Dog ID Blood sample aliquot ID Blood volume Breed
LAB1 1 2 3 4 3 ml 3 ml 3 ml 3 ml Labrador Retriever LAB2 1 2 3.9 ml 3.9 ml Labrador Retriever LAB3 1 2 3 4 5 5 ml 3.5 ml 3 ml 500 µl 500 µl Labrador Retriever
GRE1 1 200 µl Golden Retriever
2 3.5 ml DSF1 1 2 3 3.5 ml 3.5 ml 3.5 ml Danish-Swedish Farmdog1 GOH1 1 2 3 3.5 ml 3.5 ml 3.5 ml Gotland Hound1 SVH1 1 2 200 µl 4 ml Swedish Vallhund1 1 Nordic breed.
2.2 HMW-DNA Extraction
Four HMW-DNA extraction protocols were tested in order to evaluate their suitability for nanopore sequencing. In Table 2, a brief summary of the protocols, and their expected outcome based on the documentation provided by each kit, is presented. A complete list of the reagents used in this project has been included in Appendix 1.
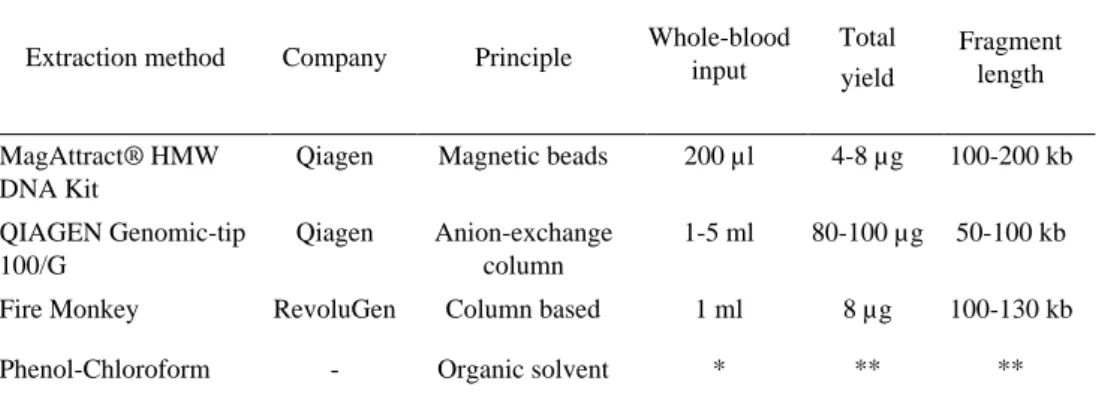
Table 2. Summary of tested HMW-DNA extraction protocols. All specifications were obtained from the corresponding manufacturers.
Extraction method Company Principle Whole-blood input Total yield
Fragment length
MagAttract® HMW DNA Kit
Qiagen Magnetic beads 200 µl 4-8 µg 100-200 kb
QIAGEN Genomic-tip 100/G
Qiagen Anion-exchange column
1-5 ml 80-100 µg 50-100 kb
Fire Monkey RevoluGen Column based 1 ml 8 µg 100-130 kb
Phenol-Chloroform - Organic solvent * ** **
*Sample volume can vary. **Metric varies according to sample quality and volume.
2.2.1 MagAttract® HMW DNA Kit
The MagAttract® HMW DNA Kit is a magnetic bead-based protocol manufactured by Qiagen (Qiagen, Hilden, Germany). Samples GRE1_1 and SVH1_1 were extracted using this kit following the manufacturer’s instructions that are described below.
For this protocol, 20 µl of proteinase K were pipetted into an empty 2 ml Eppendorf tube, followed by 200 µl of fresh whole-blood, 4 µl of RNase A (100 mg/ml), and 150 µl of Buffer AL. This was mixed very carefully by tilting and tapping the tube. After 30 minutes of incubation at room temperature (RT), 15 µl of MagAttract Suspension G (magnetic beads) and 280 µl of Buffer MB were added. The magnetic beads were resuspended by gently tapping the tube and then spun down by microcentrifugation. Next, the tube was incubated in a thermomixer at RT for 3 min at 1,400 rpm and then placed into a magnetic rack for ~1 min or until the magnetic beads were completely pelleted. The supernatant was removed, and the tube detached from the magnetic rack. Then, a first wash step was performed: 700 µl of Buffer MW1 were added, followed by an incubation at RT for 1 min at 1,400 rpm. After this, the beads were pelleted again by placing the tube into the magnetic rack and the supernatant was removed. A second wash was carried out following the same steps as the first one. With the tube still attached to the magnetic rack and without disturbing the pellet, 700 µl of distilled water were added, incubated for 1 min at RT, and then removed. This step was repeated twice. Finally, the tube was removed from the magnetic rack and 100 µl of Buffer AE (10 mM Tris-Cl; 0.5 mM EDTA, pH 9.0) were added followed by an incubation at RT for 3 min at 1,400 rpm. Once again, the beads were pelleted in the magnetic rack and the supernatant, which contains the final product, was pipetted out and transferred into a clean 1.5 ml Eppendorf tube.
2.2.2 QIAGEN Genomic-tip 100/G
The QIAGEN Genomic-tip 100/G, in combination with Qiagen’s Genomic DNA Buffer Set, is an anion-exchange, gravity-flow, column-based protocol that allows the isolation of high yields of HMW DNA (Qiagen, Hilden, Germany).
QIAGEN Genomic-tip 100/G: Leukocyte nuclei extraction
The QIAGEN Genomic-tip 100/G protocol requires a pre-sample preparation, where leukocyte nuclei are isolated from whole-blood and used as starting material for gDNA extraction.
Figure 11. Nuclei pellet.
For the nuclei isolation, fresh whole-blood from each dog was divided into several aliquots of 2-5 ml in 50 ml Falcon tubes (Figure 10 and Table 3). Each blood aliquot was treated in the following manner: a volume of ice-cold Buffer C1 (1.28 M sucrose; 40 mM Tris-Cl, pH 7.5; 20 mM MgCl2; 4% Triton X-100) and 3 volumes
of ice-cold distilled water were added, followed by a 10 minutes ice incubation. The lysed blood was then centrifuged in a swing-out rotor at 4 °C for 15 min at 1,300 x g and the resulting supernatant was discarded, leaving a pink nuclei pellet at the bottom of the tube.
To wash the nuclei pellet, 1 ml of ice-cold Buffer C1 and 3 ml of ice-cold distilled water were added, mixed by vertexing, and then centrifuged at 4 °C for 15 min at 1,300 x g. The supernatant was removed and the whole wash process was repeated until the pellet turned white (Figure 11).
The nuclei were stored at -20 °C until required for DNA extraction. All reagents used in this protocol are part of Qiagen’s Genomic DNA Buffer Set (Qiagen, Hilden, Germany).
Table 3. Nuclei extraction sample list.
Dog ID Breed Whole-blood volume
LAB1_1 Labrador Retriever 3 ml
LAB1_2 Labrador Retriever 3 ml
LAB1_3 Labrador Retriever 3 ml
LAB1_4 Labrador Retriever 3 ml
LAB2_1 Labrador Retriever 3.9 ml
LAB2_2 Labrador Retriever 3.9 ml
LAB3_1 Labrador Retriever 5 ml
LAB3_2 Labrador Retriever 3.5 ml
LAB3_3 Labrador Retriever 3 ml
LAB3_4 Labrador Retriever 500 µl
LAB3_5 Labrador Retriever 500 µl
GRE1_2 Golden Retriever 3.5 ml
DSF1_1 Danish-Swedish Farmdog 3.5 ml
DSF1_2 Danish-Swedish Farmdog 3.5 ml
DSF1_3 Danish-Swedish Farmdog 3.5 ml
GOH1_1 Gotland Hound 3.5 ml
GOH1_2 Gotland Hound 3.5 ml
GOH1_3 Gotland Hound 3.5 ml
SVH1_21 Swedish Vallhund 4 ml
1Nuclei extraction performed 15 days after blood draw.
QIAGEN Genomic-tip 100/G: HMW-gDNA extraction (O)
A total of 9 samples (Table 4) were processed with Qiagen’s Genomic-tip 100/G following the manufacturer’s instructions, which are described below.
DNA was extracted by using nuclei as starting material. The nuclei were lysed and digested by adding 5 ml of Buffer G2 (800 mM guanidine HCl; 30 mM Tris-Cl, pH 8.0; 30 mM EDTA, pH 8.0; 5% Tween-20; 0.5% Triton X-100), 95 µl of proteinase K, and incubated for 60 min at 50 °C. Thereafter a Genomic-tip was placed on top of a 50 ml Falcon tube and equilibrated with 4 ml of Buffer QBT (750 mM NaCl; 50 mM MOPS, pH 7.0; 15% isopropanol; 0.15% Triton X-100) (Figure
12).The lysed product was loaded into the Genomic-tip and left to drain completely
by gravity flow. Next, two washes of 7.5 ml of Buffer QC (1.0 M NaCl; 50 mM MOPS, pH 7.0; 15% isopropanol) were applied. The Genomic-tip was placed on top of a new 15 ml Falcon tube and the gDNA was eluted by adding 5 ml of pre-warmed (50 °C) Buffer QF (1.25 M NaCl; 50 mM Tris-Cl, pH 8.5; 15% isopropanol).
DNA was precipitated by adding 3.5 ml of RT isopropanol and then pelleted at >5,000 x g (~7,000 x g) for 15 min at 4 °C. After removing the isopropanol supernatant, two washes of 2 ml of cold 70% ethanol with centrifugations at >5,000 x g (~7,000 x g) for 10 min at 4 °C were performed. Finally, the DNA pellet was dried at RT for 10 min, resuspended in a suitable buffer (e.g. TE, pH 8.0; nuclease-free water; or 10 mM Tris-HCl, pH 8.0), and dissolved at 55 °C for 2 hours.
QIAGEN Genomic-tip 100/G: HMW-gDNA extraction modified version (MV)
The original protocol does not include an RNase treatment, wherefore this was added prior to the digestion step with proteinase K. For every 5 ml of G2 Digestion Buffer, 10 µl of RNase A (100 mg/ml) were added, followed by a 30 min incubation at 37 °C. Additionally, to prevent clogging the Genomic-tip by sample overloading, a two-Genomic-tip per sample system was implemented. A list of the samples extracted using this protocol can be found in Table 4.
Table 4. QIAGEN Genomic-tip 100/G sample list. O = Original protocol; MV = Modified Version.
Dog ID Breed Genomic-tip protocol
LAB1_1 Labrador Retriever O
LAB1_2 Labrador Retriever O
LAB2_2 Labrador Retriever MV
LAB3_2 Labrador Retriever MV
DSF1_2 Danish-Swedish Farmdog O
DSF1_3 Danish-Swedish Farmdog MV
GOH1_2 Gotland Hound O
GOH1_3 Gotland Hound MV
SVH1_2 Swedish Vallhund MV
2.2.3 Fire Monkey
RevoluGen’s Fire Monkey is a mini-column-based protocol with the distinctive feature of including a size selection step that purifies long-fragments and removes fragments smaller than 10 kbp (RevoluGen, Berkshire, UK). Two samples (DSF1_1 and GOH1_1) were tested using this protocol and the nuclei isolated with Qiagen’s Genomic DNA Buffer Set were used as starting material.
Fire Monkey’s lysis and digestion steps were carried out by adding 300 µl of LSDNA, and 20 µl of proteinase K (10 mg/ml) to the nuclei pellet. After an incubation of 20 min at 56 °C, 350 µl of BS Buffer and 400 µl of 75% isopropanol were added, and the tube was carefully mixed. A 600 µl aliquot of the sample was pipetted into a spin column and centrifugated at 8,000 rpm for 1 min. The remaining sample was added to the same spin column and centrifuged at 8,000 rpm for 1 min. Next, 500 µl of WS Buffer were added and centrifuged at 8,000 rpm for 1 min. A wash with 500 µl of 90% ethanol was performed with a subsequent centrifugation at 14,000 rpm for 3 min, followed by an additional 1 min centrifugation step to prevent ethanol carryover. Then, the spin column was transferred to a pre-warmed Eppendorf tube, and 100 µl of pre-warmed (80 °C) EB Buffer were added. The tube was incubated at 80 °C for 1 min and then centrifuged at 4,000 rpm for 2 min. The resulting eluate, which contains the smaller DNA fragments, was discarded as it would not be used for sequencing. Once again, the spin column was transferred into a new pre-warmed Eppendorf tube, 100 µl of pre-warmed EB Buffer were added, the tube was incubated at 80 °C for 1 min, and centrifuged at 4,000 rpm for 2 min. The resulting eluate was kept for downstream applications.
2.2.4 Phenol-Chloroform
Phenol-Chloroform extraction is the only tested method that does not come as a kit. The protocol used in this study was developed by Jain et al. (2018), which is a modified version of the original protocol developed by Sambrook and Russell (2001). The samples extracted with this method are listed in Table 5, and the nuclei extracted with Qiagen’s Genomic DNA Buffer Set were used as starting material.
In their protocol, Jain et al. (2018) use TLB (100 mM NaCl; 10 mM Tris-Cl, pH 8.0; 25 mM EDTA, pH 8.0; 0.5% SDS; 20 µg/ml Qiagen RNase A) as digestion buffer. However, this reagent was unavailable during the testing phase of this project, therefore, Qiagen’s Digestion Buffer G2 was used as replacement.
Firstly, the nuclei pellet was lysed and digested using 5 ml of Qiagen’s Buffer G2 mixed with 10 µl of RNase A (100 mg/ml). The mixture was incubated for 30 min at 37 °C, and then 95 µl of proteinase K were added, followed by an incubation of 60 min at 50 °C. A 1x volume of TE-Saturated phenol was added and the tube was manually mixed by constant inversion for 10 min. Then, the mixture was centrifuged at 4,500 rpm for 10 min and the aqueous phase was carefully removed and transferred into a new tube.
A 0.5x volume of TE-Saturated phenol and 0.5x Chloroform-Isoamyl Alcohol (24:1) were pipetted into the tube and then mixed manually for 10 min. Centrifugation was carried out at 4,500 rpm for 10 min and the aqueous phase was transferred into a clean tube. Next, 2M of Ammonium Acetate and 2x volumes of ice-cold 96% ethanol were added. Once the DNA pellet was visible, it was spooled with a glass rod and submerged in a 70% ethanol wash, lightly dried, and resuspended in 10 mM Tris-HCl pH 8.0 Buffer.
Table 5. Phenol-Chloroform protocol test samples. Samples LAB3_4 and LAB3_5 were extracted using 1.5 ml Eppendorf tubes. The remaining samples were extracted using 50 ml Falcon tubes.
Dog ID Breed Whole-blood volume
LAB1_3 Labrador Retriever 3 ml
LAB1_4 Labrador Retriever 3 ml
LAB2_1 Labrador Retriever 3.9 ml
LAB3_1 Labrador Retriever 5 ml
LAB3_3 Labrador Retriever 3 ml
LAB3_4 Labrador Retriever 500 µl
2.3 DNA Quality Control
The quality and concentration of all samples were assessed using NanoDrop (Thermo Scientific NanoDrop 8000 Spectrophotometer V2.3.2) and Qubit® dsDNA BR assay (Invitrogen Qubit® 2.0 Fluorometer) respectively. Any sample with an absorbance ratio of ~1.8 for A260/280 and ~2.0-2.2 for A260/230 was considered
of good quality.
Gel electrophoresis was carried out to evaluate fragment length and level of DNA degradation. The agarose concentration used was 0.5% and 1µl of HMW-DNA sample was loaded in each well. All gels were run at 30 V for 2 hours.
2.4 DNA Purification and Size Selection
2.4.1 AMPure XP Purification
For those samples that passed quality control, an additional purification step with Agencourt AMPure XP beads was performed (Beckman Coulter, IN, USA). The protocol followed was developed by Brandt (2019), and it also served as a pre-size selection step as it filters out fragments smaller than 100 bp.
To a 70 µl volume of DNA, 20 µl of nuclease-free water and 45 µl of AMPure XP beads were added. The mix was resuspended by gently flicking, incubated at RT for 10 min, spun down with a microcentrifuge, and placed in a magnetic rack to pellet the beads. Without disturbing the pellet, 150 µl of 80% ethanol were added and removed immediately. This step was repeated twice. The tube was taken from the rack, spun down, and placed again in the magnetic rack. Any trace of ethanol was pipetted out with a 10 µl pipette tip. Following, 30 µl of nuclease-free water were added, and the beads were resuspended by gentle flicking. After a 10 min incubation at RT, the tube was placed in the magnetic rack until the beads were pelleted. The supernatant containing the DNA was retrieved and placed in a new Eppendorf tube.
2.4.2 Circulomics Size Selection
Size selection was performed using Circulomics’ Short Read Eliminator Kit (Circulomics, MD, USA). This kit eliminates fragments shorter than 10 kbp, favouring the sequencing of long-reads.
For this protocol, 60 µl of DNA with a concentration of 150 ng/µl were placed in a LoBind Eppendorf tube, and 60 µl of Buffer SRE were added. The tube was mixed gently and centrifuged at 10,000 x g for 30 min. The supernatant was
removed takin care of not disturbing the pellet. To wash the pellet, 200 µl of 70% ethanol were added and the tube was centrifuged at 10,000 x g for 2 min. This wash step was performed twice. The DNA was resuspended in 100 µl of EB Buffer and incubated for an hour at 50 °C.
2.4.3 Needle Shearing
To test the effects of DNA fragmentation on the ONT platform, needle shearing was performed on sample DSF1_2. This was done by passing the sample 3 to 4 times through a 27-gauge needle prior library preparation.
2.5 Library Preparation and Sequencing
All sequencing runs were performed using an ONT’s MinION device (MIN-101B) and R9.4.1 flow cells (FLO-MIN106D) (Figure 13).
Figure 13. MinION sequencing device and flow cell components.
For library preparation, three ONT kits were tested: Ligation Sequencing Kit LSK109), Rapid Kit RAD004), and the Rapid Barcoding Kit (SQK-RBK004).
2.5.1 Ligation Sequencing Kit (SQK-LSK109)
The Ligation Sequencing Kit (SQK-LSK109) was the primary kit used throughout this project. From the various protocols that have been standardized to be used with this kit, the basic protocol ‘1D Genomic DNA by Ligation (SQK-LSK109)’ was selected (ONT, Oxford, UK). Additionally, a third-party protocol developed by Quick (2018), as well as a final protocol that combines the strengths of ONT’s and Quick’s protocols were tested.
SQK-LSK109: 1D gDNA by Ligation (LSK109)
The library was prepared as per manufacturer’s instructions with the following modifications: to avoid an additional tube-transfer that could further increase DNA shearing, the incubation for DNA repair, end-prep, and adapter ligation was performed not on a thermal cycler, which requires a sample transfer to 0.2 ml tubes, but on a block heater suited for 1.5 ml Eppendorf tubes. For the clean-up step that follows the adapter ligation, the Long Fragment Buffer (LFB) was used. The full protocol is described below.
The DNA input was prepared by transferring 200 fmol (~2µg) of gDNA into a LoBind tube and adjusting the volume to 47 µl with nuclease-free water. DNA repair and end-prep were performed by adding 1 µl of DNA CS, 3.5 µl of NEBNext FFPE DNA Repair Buffer, 2 µl of NEBNext FFPE DNA Repair Mix, 3.5 µl of NEBNext Ultra™ II prep reaction buffer, and 3 µl of NEBNext Ultra™ II End-prep enzyme mix to the input DNA and incubating it for 5 min at RT, and 5 min at 65 ºC in a block heater. A volume of 60 µl of AMPure XP beads were added to the mixture, followed by an incubation of 5 min at RT. The mixture was washed twice with 200 µl of freshly prepared 70% ethanol and eluted in 61 µl of nuclease-free water.
Adapter ligation was performed by adding 25 µl of Ligation Buffer (LNB), 10 µl of NEBNext Quick T4 DNA Ligase, and 5 µl of Adapter Mix (AMX). The tube was mixed gently by flicking and incubated at RT for 10 min. A second clean-up step was carried out by adding 40 µl of AMPure XP beads, incubating for 5 min at RT, and washing the mixture twice with 250 µl of LFB. The washed beads were resuspended in 15 µl of Elution Buffer (EB), incubated for 10 min at RT, and pelleted in a magnetic rack. The supernatant (library) was retrieved and transferred into a new tube. Then, the library was prepared for loading by adding 37.5 µl of Sequencing Buffer (SQB) and 25.5 µl of Loading Beads (LB).
The MinION flow cell was primed by loading 800 µl of priming mix (30 µl of Flush Tether FLT and 1 tube of Flush Buffer FLB) into the priming port, and letting it incubate for 5 min. Next, the SpotON port was opened and additional 200 µl of
priming mix were added into the priming port. The sample was loaded in a drop-wise fashion with a P1000 pipette into the SpotON port (Figure 13).
SQK-LSK109: One-pot ligation protocol for Oxford Nanopore libraries (One-pot)
The One-pot library was prepared following Quick’s (2018) instructions. This protocol uses an older version of the ligation kit (SQK-LSK108), therefore some modifications needed to be made. Firstly, the incubation time for the DNA repair and end-prep reaction was extended from 10 min to 15 min. Also, the volumes of the reagents used for the ligation step were modified to 5 µl of AMX, 33 µl of NEBNext® Ultra™ II Ligation Master Mix, and 1µl of NEBNext® Ligation Enhancer. For the clean-up step, 30 µl of AMPure XP beads were used, and the washes were performed using 250 µl of LFB. The reagents and volumes used for the final library preparation step were also modified to 37.5 µl of SQB, 25.5 µl of LB, and 12 µl of library. The full version of this protocol is described below.
Approximately 200 fmol of DNA were transferred into an LoBind Eppendorf tube and the volume was adjusted to 24 µl with nuclease-free water. For the DNA repair and end-prep 1.75 µl of FFPE DNA Repair Buffer, 1 µl of FFPE DNA Repair Mix, 1.75 µl of Ultra™ II prep Reaction Buffer, and 1.5 µl of Ultra™ II End-prep Enzyme Mix were added and incubated for 15 min at RT, and 15 min at 65 ºC in a block heater.
Thereafter, adapter ligation was performed by adding 5 µl of AMX, 33 µl of Ultra™ II Ligation Master Mix, and 1 µl of Ligation Enhancer. The mixture was flicked gently and incubated for 20 min at RT. After that, the sample was cleaned by adding 30 µl of AMPure XP beads, incubating at RT for 10 min, pelleting the beads in a magnetic rack, and washing the mixture twice with 250 µl of LFB. The beads were eluted in 12 µl of EB, incubated for 10 min at RT, and pelleted in the magnetic rack. The supernatant was recovered and transferred into a new tube and placed on ice. Finally, the library was prepared for loading by adding 37.5 µl of SQB and 25.5 µl of LB and mixing gently by tapping the tube. The library was loaded into a primed flow cell through the SpotON port in a drop-wise fashion.
SQK-LSK109: Modified version (LSK109mv)
For the LSK109mv, the library was prepared using a combined protocol that follows
the instructions of the LSK109 protocol with the enzyme incubation times of the One-pot protocol. Therefore, instead of 5 minutes, 15 minutes of incubation time for the DNA repair, end-prep, and ligation steps were applied.
2.5.2 Rapid Sequencing Kit (SQK-RAD004)
The Rapid Sequencing Kit is one of ONT’s fastest library preparation kits (circa 10 minutes). Unlike the SQK-LSK109 and SQK-RBK004 kits that were purchased at the start of this project, the SQK-RAD004 kit was acquired the prior year (2018). All SQK-RAD004 libraries were prepared following the manufacturer’s instructions, which are described below (ONT, Oxford, UK).
In a clean 1.5 ml tube, 400 ng of gDNA were transferred and adjusted to a volume of 7.5 µl with nuclease-free water. After this, 2.5 µl of Fragmentation Mix (FRA) were added, and the tube was mixed by flicking and incubated for 1 min at 30 ºC and 1 min at 80 ºC. For the adapter attachment, 1 µl of Rapid Adapter (RAP) was pipetted into the tube followed by a 5 min incubation at RT. The library was prepared for loading by adding 34 µl of SQB, 25.5 µl of LB, and 4.5 µl of nuclease-free water. The library was loaded into the SpotON port of a pre-primed flow cell in a drop-wise fashion.
2.5.3 Rapid Barcoding Kit (SQK-RBK004)
The RBK004 protocol follows the same instructions as those of SQK-RAD004, with the exception that there is a barcoding step instead of a fragmentation step with FRA buffer. The sample barcoding was performed as follows: 2.5 µl of Fragmentation Mix (RB) with a barcode from 1 to 12 were added to the input DNA and then incubated at 30 ºC for 1 min and at 80 ºC for 1 min. This kit was used when samples needed to be loaded into a flow cell that had been previously used with another individual’s DNA.
2.6 ONT Flow Cell Wash and Nuclease Flush
Each flow cell was cleaned and reused at least once. After every run, the flow cell was washed utilizing the Flow Cell Wash Kit (EXP-WSH002) and stored at 4 °C until its next use.
Before starting a new run with a used flow cell, a nuclease flush was performed to unblock the pores that might be clogged with leftover DNA. This was done by mixing 290 µl of Buffer A (300 mM KCl; 2 mM CaCl2; 10 mM MgCl2; 15 mM
HEPES, pH 8.0) and 10 µl of DNase I and loading the mixture through the flow cell’s priming port. After an incubation period of ≥ 1 hour at RT, the flow cell was primed, and a new sample was loaded.
2.7 Data acquisition and analysis
The experiments were run using version 3.1.19 of ONT’s MinKNOW™ software on Ubuntu 16.04. Summaries of pore and channel performance, output quantity, and read length distribution were collected as .pdf files at the beginning and end of each run for quality assessment and troubleshooting purposes.
Basecalling was thereafter applied to the obtained raw data using Guppy version 3.0.3. For those samples that were barcoded using the SQK-RBK004 kit, a demultiplex step was added.
The quality control for each run was performed using an R script developed by ONT: “Nanopore_SumStatQC_Tutorial.Rmd.” (ONT, 2019e). This script processes the summary text-file created by Guppy and generates a .pdf report containing key metrics, basic statistics, and sequencing performance visualizations (Figure 14).
All the basecalled data was concatenated into a single collection per individual and then mapped against the dog reference genome CanFam3.1 using the mapping program MiniMap2 v.2.16, which generated .sam and .bam output files. Thereafter, the SAMtools application was used to calculate basic statistics (e.g. number of reads, average read length, longest read, shortest read, and mean read length) and average coverage.
Finally, to have a better understanding of the power of long-reads, a portion of the canine MHC region, also known as dog leukocyte antigen (DLA), was extracted as a .bam file, mapped against the CanFam3.1 reference genome, and visualized using the Integrative Genomic Viewer (IGV) application (Robinson et al., 2011). The selected region was the MHC class II DLA-DRB gene (12:2,151,409-2,164,562).
A complete list of the software used in this project and their references has been included in Appendix 2.
3.1 HMW-DNA Extraction
The isolation of high quality HMW-gDNA is a crucial step for obtaining high quality long-read data, therefore, finding a suitable DNA extraction method was one of the most important and challenging tasks of this study (Mayjonade et al., 2017; Gong et al., 2019).
Four extraction methods were tested using canine whole-blood and leukocyte nuclei as starting material to determine which one is the most suitable for Oxford Nanopore sequencing. Four key metrics were utilized in this assessment: yield, final concentration, average fragment length, and DNA purity determined by A260/280 and
A260/230 absorbance ratios.
The results obtained, which have been compiled in Table 6, reveal that Qiagen’s MagAttract® protocol produces insufficient total yield and volume for carrying out more than two nanopore sequencing runs per sample, reducing the total amount of data that can be gathered from a single extraction. Samples extracted with Fire Monkey presented some column-clogging issues and fragmentation, with a comparatively low mean read length of 3,572 bp (Figure 22 and Table 10). The attempts at extracting DNA following the Phenol-Chloroform protocol were unsuccessful (Table 6). It is suspected that this was due to a low pH environment, which pulls the nucleic acids into the phenolic phase (organic phase), and the presence of guanidine HCl in the lysis buffer, a salt that is used for separating gDNA from RNA in RNA extraction protocols (Xu et al., 2011, 2019). There is, however, no conclusive evidence to support this theory; further testing would be required to reach a verdict.
After comparing the metrics for total DNA yield, concentration, average fragment length, and DNA purity,it was determined that the modified version of QIAGEN Genomic-tip 100/G protocol (MV) yielded the best results. All samples
maintained an absorption ratio within or close to the desired range (A260/280 ~1.8,
A260/230 2.0-2.2), and the concentration and total DNA yield of the final product was
enough for preparing from 5 to 10 libraries, thereby increasing the amount of data generated per extraction (Table 6 and Table 10). Additionally, the average fragment size achieved with this protocol was greater than 20 kbp, a size comparable to that of MagAttract® and Fire Monkey, as revealed by gel electrophoresis (Figure 16).
Two key factors that might have contributed to the success of this method were the use of a two-Genomic-tip system, and the resuspension and storage of DNA in 10 mM Tris-HCl pH 8.0 instead of TE buffer (25 mM Tris pH 8.0, 1 mM EDTA) or nuclease-free water (Table 6).
The two-Genomic-tip system was implemented as a solution to the issue of tip clogging due to sample overloading, which occurred on a number of occasions, with the most extreme case being sample GOH1_2 which required to be manually pumped out of the Genomic-tip by positive pressure. This problem arose despite all samples having an initial whole-blood volume of 2-4 ml, which agrees with Qiagen’s recommendations of input material for the Genomic-tip 100/G (1-5 ml). The result of using this system was a faster extraction, with two DNA aliquots per sample that could either be kept separated or merged in a single Eppendorf tube. Although successful extractions were obtained with this method, a larger Genomic-tip such as the 500/G would potentially minimize clogging and eliminate the need to use a double-tip configuration (Qiagen, Hilden, Germany).
Three different DNA storage buffers were tested throughout this project: TE buffer, 10 mM Tris-HCl pH 8.0, and nuclease-free water. From these buffers, 10 mM Tris-HCl pH 8.0 was found to be the most suitable. Its pH buffering properties prevent the environment from reaching an acidic state, which can cause DNA denaturation, and unlike TE buffer, it does not contain EDTA, a chelating agent that is known to cause interference in downstream applications due to its binding properties to metal ions, such as Mg2+, which are cofactors needed for enzymatic
catalysis (An et al., 2014).
DNA pellets that were resuspended in nuclease-free water had higher levels of fragmentation and couldn’t be fully homogenized (e.g. DSF1_2 and GOH1_2;
Table 6). DNA is known to dissolve better in alkaline mediums such as TE or
Tris-HCl pH 8.0, however nuclease-free water’s pH is slightly acidic (pH 5-6) (Kim et
al., 2012; An et al., 2014).
It is suspected that incomplete DNA resuspension and storage in water might have had a negative impact on DSF1_2 and GOH1_2, being these the only samples that had a large discrepancy between Qubit and NanoDrop measurements, which is an indicator for DNA degradation(Table 6).
NanoDrop works on the principle that nucleic acids absorb UV light at 260 nm, however this could become a problem since it cannot distinguish between dsDNA,