The Financial Effects of Going Public
on Football Clubs
Paper within Master Thesis Authors: Fredrik Karlsson
Gareth Low
Tutor: Andreas Stephan
i
Acknowledgements
Without the help of certain individuals and institutional bodies we would have not been able to fulfill our purpose with this paper.
We would like to express our gratitude to our mentor and tutor throughout the whole process, Andreas Stephan for his time and interest in our subject.
We would also like to offer a special thank-you to the personnel of Jönköping University in assisting us in subject matters regarding academic research papers and databases, which helped us in gaining necessary data and knowledge for our study.
Another source of support and feedback was that of the individuals in our seminar group, and for that we would like to offer our thanks.
The help and guidance received in the process of completing our work assisted us in compiling a valid study and an enjoyable journey and experience.
ii
Master’s thesis within Finance
Title:
The Financial Effects of Going Public on Football Clubs
Author: Fredrik Karlsson & Gareth LowTutor: Andreas Stephan
Date: 11 May 2015
Subject Terms: IPO, Cumulative Abnormal Returns, Jensen’s Alpha, Under-performance, Underpricing.
Abstract
In this thesis we analyze the financial performance of Football clubs following an initial public offering (IPO). We conduct several analyses using time series stock data with a focus on finding evidence of long-run underperformance and IPO over/underpricing. To this end, we estimate cumulative abnormal returns (CAR) and Jensen’s Alpha. We also analyze coefficients such as beta to describe the volatility and the link football clubs’ stocks have to the general market. We look at historical events that may have affected the movement of stock prices and confirm this by benchmarking an index (STOXX in-dex) compiled of a number of European football teams. Our results show that football clubs do in fact follow the clear pattern of other entities and sectors and previous re-search with regard to underperformance in the long run. We find that football clubs’ stocks are less volatile than the general market and have a low beta. With regards to over/underpricing, we only obtain data for a few football clubs. We find small signs of underpricing but are not able to confirm that this is statistical significant due to the size of our sample.
“The achievements of an organization are the results of the combined effort of each in-dividual.” - Vince Lombardi
iii
Table of Contents
1
Introduction ... 1
1.1 Background ... 1
1.1.1 Introduction to the topic ... 1
1.1.2 History of IPOs ... 2
1.1.3 History of IPOs within sport clubs ... 3
1.2 Focus of Study ... 5
1.3 Problem Discussion ... 6
1.4 Purpose ... 7
1.5 Earlier Research ... 7
1.5.1 The Effects of Going Public ... 7
1.5.2 Risk of Becoming Publicly Traded ... 10
1.5.3 On-Field Performance Relation to Stock Performance ... 11
1.5.4 Valuation of the Firm ... 12
1.5.5 Earnings per Share (EPS) ... 12
1.5.6 Return on Equity ... 13
1.6 Delimitations ... 14
2
Frame of Reference ... 16
2.1 Underpricing/Overpricing ... 16
2.2 Profit-Maximizers vs Win-Maximizers ... 17
2.3 Long-Run Performance after IPO ... 18
3
Method ... 20
3.1 Methodology ... 20
3.2 Method ... 21
3.2.1 Assessing the effect of an IPO using Performance Measures ... 22
3.2.2 Abnormal Return & Cumulative Abnormal Return ... 23
3.2.3 Jensen’s Alpha ... 25
3.2.4 Beta ... 29
3.2.5 Assessing the performance of an IPO with regards to underpricing and overpricing ... 29
3.2.6 Comparison of firms based on STOXX index and market index ... 30
3.2.7 Newly listed stocks versus seasoned stocks ... 32
3.3 Quality Assurance ... 34
4
Collection of Data ... 35
4.1 Time Series Data ... 35
4.1.1 Individual Sports Clubs Historical Stock Price ... 35
4.1.2 Historical Market Prices ... 35
4.1.3 STOXX Data ... 36
4.2 IPO Data ... 36
4.3 Risk Free Rate ... 36
4.3.1 Excess Return ... 37
iv
5.1 Jensen’s Alpha ... 38
5.1.1 Statistical Test ... 40
5.2 Cumulative Abnormal Returns ... 43
5.2.1 Statistical Test ... 44
5.3 Beta ... 45
5.4 STOXX Index for bundle of Football Clubs ... 46
5.5 IPO vs. Seasoned Stocks Performance ... 49
5.5.1 Statistical Test ... 50 5.6 IPO Data ... 53
6
Conclusion ... 56
7
Further Research ... 58
8
References ... 59
9
Appendix ... 64
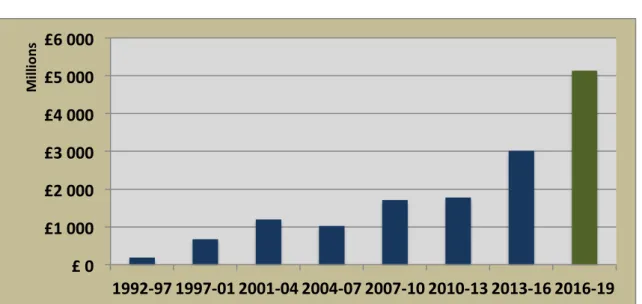
9.1 Rise in TV Contracts Premier League ... 64
9.2 Football Clubs included in Sample ... 64
9.3 Underpricing (in percentage) Country by Country ... 65
9.4 Entities Included in STOXX index ... 66
9.5 Alpha Movements for Individual Football Clubs ... 67
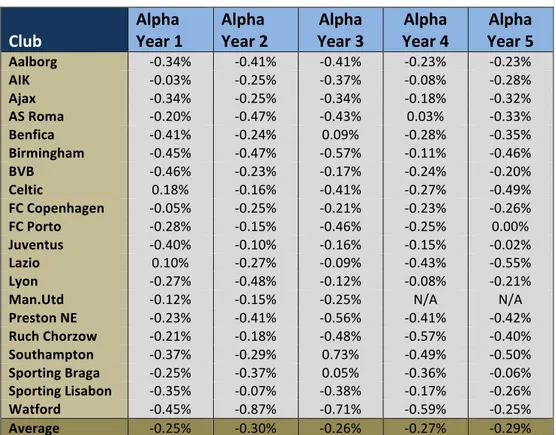
9.6 Result Table for Alpha Calculations ... 69
9.7 Alpha Return Monthly ... 70
9.8 CAR Movements Yearly for Individual Clubs ... 71
0
Definitions
Beta = Measures the volatility of the independent variable versus dependent. The slope
of a regression model.
Jensen’s Alpha = Measuring the excess return of a stock against the market risk
premi-um adjusting for systematic risk. Intercept coefficient of a regression.
Overpricing =Overpricing amount is defined as the (positive) difference between issue
price and the first day of listing closing price.
Profit Maximizing = When motives of owners benefit firm financially Publicly Traded = Outstanding shares are being traded on a stock exchange.
Underpricing/Money Left on the Table = Defined as the (negative) difference
be-tween the issue price and the first day of listing closing price.
Win Maximizing = When motives of owners is for “on-field success”
Abbreviations
AR = Abnormal Returns
CAR = Cumulative Abnormal Returns – The cumulated difference between the
ex-pected return and the actual return of a stock.
DAX = 30 Largest entities on Frankfurt Stock Exchange EPS = Earnings Per Share
FTSE = London Stock Exchange
IPO = Initial Public Offering, the issuing and first sale of stocks for a private
firm/organization to the public.
MRP= Market Risk-Premium MLB = Major League Baseball
NBA= National Basketball Association NFL = National Football League NYSE = New York Stock Exchange
OMX Copenhagen = Danish Stock Exchange
OMX 30 Stockholm = Swedish 30 Largest Entities on Stock Exchange ROE = Return on Equity
1
1 Introduction
In this chapter the reader will be introduced to Initial Public Offerings (IPO) and the specific topic and background of IPO’s within the sports industry. This will let us develop a problem discussion, after which the purpose of this thesis will be stated. Finally the reader will be in-formed of earlier research regarding this topic that may be of interest.
1.1 Background
Why do organizations go public and what will the ex-post effects of this process be? This is something researchers have been trying to answer over decades within different studies including Bauer & McKeating (2011), Cheffins (1999) and Kesenne (2008) in-volving Initial Public Offerings (IPOs). This thesis will be specifically focusing on a particular phenomenon regarding IPOs, the effects of an IPO on the current market for professional sport clubs.
1.1.1 Introduction to the topic
When discussing IPOs we need to first look closely at financial markets and what their function is. Financial markets grant individuals, firms and organizations the ability to borrow and invest money, allowing for time consumption. Financial markets allow the-se parties also to transfer specific risks to the shareholders and to the-separate ownership from management of the firm.
Firms can take advantage of financial markets by publicly listing the firm, allowing in-dividuals and institutions to purchase shares of the ownership of that particular firm. This move allows for more liquidity and for the firm to gain better access to a low cost capital, which can be used to facilitate project investments and so forth. The process of changing the ownership of a firm from private to public is known as an Initial Public Offering (IPO). Disadvantages of going public include the dispersion of equity holders,
2
which causes a lack in ownership concentration and the ability for investors to monitor company management. This in turn can be solved through certain regulations on finan-cial disclosure to protect investors but this is a costly and lengthy process (Berk & De-Marzo, 2013).
In general, firms usually make the transition from private ownership to public owner-ship when it reaches a certain size or structure, however in the case of sport clubs and what they entail, this procedure is far less common (Baur & McKeating, 2011).
1.1.2 History of IPOs
Issuing and offering stocks to the public may sound like a simple way of raising capital for firms/organizations, but there are some common pitfalls connected to an IPO. Two standard pitfalls that firms and organizations have historically experienced when going public are: underpricing of stocks and underperformance (Ritter, 1991). In research conducted by Banerjee, Dai, & Shrestha (2011) they state that many IPOs tend to be underpriced, meaning that the offering price is often lower than the first day’s closing price of the stock. This phenomenon creates an opportunity for investors to profit on a short-term basis and it is often described as “leaving money at the table”. This phenom-enon makes the whole IPO inefficient since the issuer could have received a higher price and thus more capital initially before the first trading day. In Ritter (1991) the au-thor argues that the stock’s performance tends to underperform three years ahead after the IPO has been conducted compared to competitors operating in the same industry. He also mentions that evidence of long-run underperformance differs between industries and that it is not as strong as the evidence for short-term underpricing of IPOs. In Banerjee et al. (2011) research tells us that on average the stocks of a Swedish IPO suf-fer from 21.79% underpricing initially which is five times higher than neighboring country Norway’s average result of 4.33%. In the U.S. the average underpricing in the market of IPOs is at a 24% level. This phenomenon creates a window of opportunity to exploit IPOs without actually being interested in a long-term relationship to the compa-nies’ development. It should be mentioned that Banerjee et al. (2011) research scope
on-3
ly stretches between 2000-2006, so the sampling may be biased to some extent. This matter will be further discussed in the section “Earlier Research”.
In our research we will be looking at different kind of sports clubs that are traded pub-licly and some operate in different manners regarding share offerings to the public. Pri-mary offerings are the initial sale of a new large block of shares to the public, which will be looked at when considering recent IPO’s such as the Manchester United and AIK along with other clubs. The details that will be analyzed are how they perform with respect to seasoned stocks or entities that have been listed for a significant period of time. This will be discussed in further detail later on in this paper.
1.1.3 History of IPOs within sport clubs
When looking at sport clubs, it is currently a rare phenomenon to go public but histori-cally this has not always been the case. Only a small number of sport clubs are currently traded publicly. We will first examine football clubs as an example and England in par-ticular. When the EPL (English Premier League) was founded in 1992, owners of foot-ball clubs raced to realize potential earnings in broadcasting and TV-rights etc. In only a few years there were 27 football clubs with listed stock (The Economist 2012). The downside of these clubs being traded publicly was that most of the income earned went often to purchasing new players due to huge competition, rather than to shareholders. Without any payouts or dividends the stock prices suffered and many clubs had to pull out when the stock market took a downward turn in the 2000’s leaving the clubs in fi-nancial trouble along with unhappy shareholders. Currently in the UK there are now on-ly four clubs with listed stocks (Celtic, Arsenal, Birmingham City and Manchester United).
The latest of these clubs to actually conduct an IPO was Manchester United, a club who was delisted in 2005 before being introduced on the American Stock market with partial admission (Approximately 5% of the market value) in 2012 by owner Malcolm Glazer1 (Maurice, C., 2014).
4
A local example in a market both financially and in sporting terms perhaps unknown to most around the world is the case of AIK in Sweden. Since 1999, AIK has been a lim-ited liability company. AIK was introduced to the Nordic Growth Market Stockholm stock exchange through an IPO in 2006. Certain legal restraints are placed on publicly owned sport clubs in Sweden, with a requirement of 51% ownership from the club itself (Andersson & Bäckström, 2011). Throughout our research we will be analyzing AIKs stock price and how it fares when benchmarked against other newly listed entities along with its performance when compared to seasoned equity stocks.
An example of a sport club owned completely by the public is the Green Bay Packers of the National Football League (NFL). Although the Packers never conducted an IPO, in-stead offering ownership to the community when facing financial struggles the public ownership is a rare phenomenon in North American sports leagues. The Packers have in fact approximately 350,000 owners who are all fans of the club and is currently the only major league sports club in North America that is not privately owned (Zirin, D., 2011). Another example is the Kitchener Rangers of the Ontario Hockey League where the 40 person board of directors is made up of volunteer season ticket holders meaning the club is not therefore under pressure to issue dividends (Kitchener Rangers, 2015). This is a special case and further example of how fans can contribute to the wellbeing of the club while not expecting certain payouts and dividends, an unusual phenomenon in any other business sector. Much like the Green Bay Packers club, the Kitchener Rangers is a club for the community. This community strength is one of the reasons why public sports clubs can survive and compete with privately owned entities and the psychologi-cal aspect is something which may be of interest in further research.
Borussia Dortmund is perhaps the best example of a purely publicly owned football club2 . Unlike Manchester United who offered only 5% of the club when conducting an IPO in 2012, Borussia Dortmund is 81.05% owned by individuals and institutions with no association to the club (i.e. fan club members) (Harty, C, 2014). Borussia Dortmund conducted their IPO in 1999. After conducting the IPO, the extra available funds al-lowed Borussia Dortmund to sign renowned international football players along with
5
the expansion of its stadium making it the largest in Germany. The years following the 1999 IPO were filled with “on-field” success for Dortmund both nationally and interna-tionally, increasing sales revenues, which contributed to the financial well-being of the club. During the 2003/04 season however the club missed out qualifying for any inter-national competition thus having a huge negative impact on sales revenues and earn-ings. Over the next two years the club struggled to finance its operating and interest ex-penses, forcing them to restructure and install a new management board to try and res-cue the club (Büchler & Jücke, 2012). In Lewing’s (2005) article on the German league and specifically Borussia Dortmund, he states that Borussia Dortmund are struggling to avoid insolvency mainly due to bad investments with regard to player recruitments and not able to complete all rent payments on the arena. He states that the financial situation of Borussia Dortmund and many other publicly listed football clubs means that it is un-likely any other football clubs will go public in the near future. This along with the pre-vious examples in turn shows the difficulties of running a publicly owned sport club and are one of many reasons why many stock prices are faltering.
1.2 Focus of Study
The financial performance of a sports club is understandably often determined by the results on the field along with the other factors already mentioned. Any investments and financial predictions of a sport club have to be based on “on-field” performance and how the club is expected to perform from year to year. Therefore the financials and stock price of a sport club are very sensitive to a drop in form and in missing intended targets, as was the case with Dortmund. This is an important factor therefore to account for when analyzing a sports club’s financial performance.
We believe that this area of research is of significant interest for contemporary sport clubs as the focus of their business shifts towards a more competitive market with a more financial oriented management than before. Our ambition is therefore to increase the awareness of the effects of an IPO, both for the public and also the community as well as for the managers of sport clubs. This thesis will mainly focus on the financial impacts of an IPO on sports clubs, considering this specific topic to a large extent has
6
not been researched, with much research focusing on “on-field” activity, which will be discussed in the section earlier research. Our selection of this topic and our research in depth into this specific case of IPOs will benefit potential investors with key financial information and also help supply information that will be of use in the decision making of sports clubs with regard to going public.
1.3 Problem Discussion
With regard to issues such as “underpricing,” expressed in the section above by earlier researchers about IPOs in general, do the same issues apply to a case of an IPO of a sport club? We believe that there is a difference in the preferences and background thinking of investors due to the specifics of the industry they are investing in. This is apparent for example when it comes to sport clubs going public, there is often a chance that investing activities will be fan-based due to the love or support of a club (Green-berg, 2013), and not always based on a rational investment consideration with financial gains. In today’s modern society people seems to be focusing a lot more on their pas-sions in life, thus the supporter culture among sport clubs has naturally grown over time.
To summarize, the questions we will look at and attempt to answer in this thesis are:
- What is the financial impact of an IPO on a sports club when looking at time se-ries performance indicators?
- How do the prospects look for an IPO of a sports club compared to that of a sea-soned stock within the sports market and also benchmarked against the market as a whole?
- Do normal issues regarding IPO’s such as underpricing affect a sports club in the same way it does a normal entity?
- What are the pros and cons for a sports club to conduct an IPO (With respect to historical examples among other things)?
7
1.4 Purpose
What we are going to investigate in this thesis is the possible financial effects of going public for sports clubs initially and the long-term performance of these entities follow-ing an IPO. We will look into specific sport clubs and in particular those who have re-cently performed IPOs along with those that have been public for a longer time and into the general financial performances of these entities. We will attempt to evaluate the fi-nancial performance of sport clubs after an IPO when benchmarked against companies in other sectors along with comparing the financial performance of newly listed sports clubs to that of seasoned sport clubs. Also in our research we will be looking at the overpricing and underpricing phenomenon, which arise often when IPOs are conducted and examine whether sport clubs follow a similar pattern to those entities in other mar-kets with regard to the underpricing phenomenon.
We will base our study on and examine European publicly traded football clubs. Our focus will be on their financial performance after the IPO. Very little research has been conducted with regard to the financials within IPOs of sport clubs in the world, and even less with regard to domestic Swedish sport clubs. Thus our ambition is to extend that knowledge gained about the financial performance of publicly traded sport clubs and also the effects of IPOs on sport clubs, especially with a more specific focus on Eu-ropean football clubs. With our results obtained, our purpose is that our research would favor European sport clubs that are investigating the possibility of going public along with potential investors considering entering this market.
1.5 Earlier Research
1.5.1 The Effects of Going Public
There has not been a significant amount of studies conducted about how an IPO affects a sport club in terms of its financial performance. Few individuals have touched on this specific subject, though Cheffins (1999) is one who has analyzed to a certain extent the
8
case for American sport clubs’ possibility to gain in total financial terms from an IPO. Cheffins (1999) also believes that the main reason why sport clubs contemplate going public is that their belief of raising new capital for building large arenas will attract more interest both from supporters of the club and from commercial companies to spon-sor and/or establish themselves within the arena, leading to increased revenues. This along with increased TV-rights revenue would help increase the realized value of a pub-licly traded stock. Cheffins (1999) also mentions that there are many costs connected to an IPO and a loss of flexibility for the club due to legislation and rules of disclosure when you are publicly traded.
Some research has previously been conducted within this field regarding in particular Football clubs and the effect of going public on their performance. As mentioned, a lot of this work is focused on the “on-field” side of things with a lot of studies looking in particular at results (wins and losses) before and after the IPO. Baur and Mckeating (2011) show in one particular study that going public does most commonly not affect “on-field” performance both domestically and internationally and the only real cases where there was a distinctive change was in the lower domestic leagues, where the extra source of capital allowed them to be more competitive than rivals.
In Dobson and Goddard’s (2001) book on The Economics of Football, they touch on the subject of going public. They discuss sport clubs and how they differ from other organi-zations and how they have changed over time. They discuss the specific example of Manchester United, when first floated were undersubscribed by 50 per cent and traded under their offer price 18 months after flotation. This brings us back to the topic of overpricing and the studies already mentioned and how it applies to sport clubs. This topic will be discussed in more depth to gain an understanding whether overpricing is a common phenomenon within sports clubs.
When looking at direct influencing factors on the share price level, the TV-revenue con-tracts of many publicly owned football clubs led to an appreciation of the share prices and is one of the factors affecting share prices and financial well-being.3 After a big tel-evision contract over the period 1992-1997 of 191m GBP, in 1995 the share price was
9
affected by expectations regarding a new improved contract and optimistic views (Dob-son & Goddard 2001). These optimistic views have shown to have foundation, with the latest deal from 2016 to 2019, a record figure of 5.136bn GBP (Rumsby, 2015) See Ap-pendix (Figure 9.1). Another factor discussed in their research was the potential share-holders offers, (BSkyB bid for Manchester United) positively affecting the share price and the blockage of these movements causing a negative effect. Along with these finan-cial factors they found the “on-field” factors also affected clubs share price. Many mathematical methods have been used to calculate the fluctuations in share price and the contributing factors to these shifts, which we will be looking close at in the method section (Dobson & Goddard, 2001).
In previous research made by Ritter (1991), it was found that there is statistical evidence that companies who have conducted an IPO tend to underperform in terms of their ad-justed returns and cumulative average adad-justed returns measurements in relation to al-ready established companies on the NYSE in the same industry. The statistical analysis was based on the adjusted returns and cumulative average adjusted returns over a 36-month period for each individual company who conducted an IPO between the years 1975-1984, with the sample size of 1526 IPOs. Ritter, (1991) also explains that this is a sign of overpricing in the long run concerning IPOs since the stock’s performance does not always coincide with the financial performance of the company. Ritter’s research may not be the most recent one conducted, but he proves a point of underperformance in the long run of IPOs that may be an important factor to be considered before contem-plating the process of publicly listing a company.
As briefly introduced in the introduction section, Leleux & Muzyka (1997) mention that IPOs have historically been underpriced as Alm et al. (2009) and Ritter (1991) also dis-cuss. This phenomenon seems to be one of the most common issues regarding IPOs as many authors mention it in their articles concerning IPOs. The phenomenon of under-pricing “leaves money at the table”. The pattern shows that companies’ lose a part of their potential earnings from an IPO since the newly issued stocks commonly increase quite rapidly during the first trading days/weeks (Dimovski & Brooks, 2004). Dimovski & Brooks (2004) believes that the pattern of IPOs and the initial gains acknowledge an undervaluation of the company's equity according to the market’s movement. Earlier
re-10
search made by Banerjee et al. (2011) suggests that, on average, in Sweden the IPOs stock price initially increased by 21.79% considering IPOs conducted between 2000 and 2006. The same figure for USA was 24% between 2000-2006 (Banerjee et al., 2011). The figures mentioned by Banerjee et al. (2011) may not be completely accurate and may be somewhat deceiving due to the short time scope of their study. Some particular IPOs can be considered as being overpriced according to research conducted by Shayne & Soderquist (1995). Underpricing or overpricing, both phenomena are evidence for in-efficiency in the market of IPOs (Shayne & Soderquist, 1995).
1.5.2 Risk of Becoming Publicly Traded
There has been research done on a new kind of risk exposure to an entity after going public. This is something Greenberg (2013) discusses; the risk of experiencing a hostile takeover after becoming public4. This means sport clubs that possess the resources and believe being publicly traded has preferable assets and/or are believed to be misman-aged can purchase a sufficient amount of stocks to become the largest owner and then execute all the changes they prefer even though this is not what the current owners had in mind. Greenberg (2013) also illustrated an example of when this phenomenon could have occurred; when the Major League Baseball (MLB) club Texas Rangers went bank-rupt in 2010 and subsequently arranged a sale of the club. Two major investors were bidding for the ownership of the club; Mark Cuban (a media tycoon and the owner of the NBA club Dallas Mavericks) and Nolan Ryan (one of the greatest pitchers in MLB history and who had also played for Texas Rangers earlier in his career). Nolan Ryan won the bidding war but still he was in the danger zone of a hostile takeover. Mark Cu-ban could have implemented stealth acquisitions of the club’s stocks offered to the pub-lic on an exchange and slowly taken over the voting rights of the club, forcing Nolan to cooperate with Mark. Nolan could have also recognized this and implemented defensive mechanisms to prevent a hostile takeover of the club (Greenberg, 2013).
11
1.5.3 On-Field Performance Relation to Stock Performance
Greenberg (2013) briefly mentions the sensitivity of a sport club’s performance to its stock price and how contracts with players could be established to reassure the absolute best performance from the players. One suggestion by Greenberg (2013) is offering players stock options in their contracts that are tied to an agreement of reaching a cer-tain position in the league standings. This matter has also been covered in a research pa-per by Renneboog & Vanbrabant (2000) where they created a statistical model5 investi-gating the correlation between English football clubs’ sport related performance to their stock’s performance. The statistical model of choice consisted of a dependent variable explaining the stock’s continuous weekly return measured on the subsequent Monday after each week (since most games are played during weekends when the stock markets were closed.) On the other side of the model the explanatory variables were the market return and three different dummy variables which would, individually, be activated if the club experienced a victory, draw or a defeat during the previous week of games.
Renneboog & Vanbrabant (2000) received a result that stated a positive correlation be-tween the football clubs’ performance and their stock’s price development meaning a positive result (win) in a game increased the stock’s price while a negative/neutral result (defeat/draw) would decrease the stock’s price. If a club won, the stock price would on the subsequent trading day increase (on average measured in abnormal return) by almost 1% while a loss or draw would penalize, respectively, the price of the stock by decreas-ing 1.4% and 0.6%. The above mentioned statistical model again confirms the correla-tion between “on-field” performances and the financial results of a sport club as men-tioned in the “Background” section which is shown with the sole purpose of informing the reader about this link.
5 lnPi,t = ai + b1*lnMarkett + b2*Dvictory + b3*Ddefeat + b4 *Ddraw + ei,t
12
1.5.4 Valuation of the Firm
With a focus on individual clubs, a study was conducted by Andersson & Bäckström (2011) on the valuation of the football club AIK and with a main purpose in seeing if the firm was over or undervalued. This is directly linked to underpricing/overpricing and the IPO process a firm goes through in setting a share price. This is somewhat linked to the purpose and research that will be conducted in this thesis as it takes into consideration the public identity of the club and its corporate ownership. Results have been discussed regarding recommendations for investments, factors affecting financial ratios and through a comparison with other clubs, the authors found that AIK struggle financially compared to larger structured clubs and would not be a valid or recommend-ed financial decision. Our intentions are to find whether, basrecommend-ed on over/underpricing and long-term underperformance studies, sporting entities are generally viable invest-ment decisions.
In Bauer & Mckeating (2011) research, it was stated that a measure of performance af-ter an IPO is the value of the firm and how the financial markets value the firm follow-ing the listfollow-ing (Bauer & Mckeatfollow-ing 2011). Valufollow-ing a firm before and after an IPO gives an indicator of how that particular firm has been affected by this process. There are sev-eral ways in which one can proceed in valuing a firm i.e. Free Cash-Flow to Firm (FCFF) and Free Cash-Flow to Equity (FCFE) are two commonly known methods. There will be no direct focus on valuation methods in this thesis but we believe it is something that should be mentioned as the valuation method has a bearing on the stock price and thus the stock’s performance both in short and long-run. Some of the financial methods brought up by Bauer & McKeating (2011), regarding the performance of foot-ball clubs are briefly touched on below.
1.5.5 Earnings per Share (EPS)
Earnings per share (EPS) define how much profit a firm makes in terms of an individual share, in turn allocating the profit of the firm over the number of shares. EPS is one of
13
the most common ways to measure the performance of a firm over time and is used to set the price of a share amongst other things (Berk & DeMarzo 2013).
In our analysis we do not intend to use this performance based financial ratio in as-sessing the performance of a sports club after an IPO, as it may be difficult to judge the viability of going public using this model. A key factor to take into consideration and one of the disadvantages when looking at EPS in sports clubs is that they unlike firms in other sectors often do not pay out dividends. Another disadvantage of using this model when performing comparisons to other firms is that it does not take into consideration capital spent on investments and research & development (Menon, 2013). Therefore we will be looking at other specific financial ratios later on such as Cumulative Abnormal Returns (CAR) and alphas (𝛼).
1.5.6 Return on Equity
Return on Equity (ROE) measures the return a firm has had on past investments. ROE is a key ratio often used in analyzing and evaluating return on investments by analysts and financial managers and is obtained by comparing the income of the firm to its invest-ments (Berk & DeMarzo 2013). The level of the ROE shows how successful past in-vestments have been and in that way the performance of the entity in question. A high ROE therefore could translate to profitable investment opportunities found by the firm.
Again, much similar to the other financial models and ratios, this method is based on accounting data which is not always entirely accurate, also it does not include the cost of capital which may be a telling factor when discussing these figures (Bernhardt, 2015). Mixing financial account data and stock price data is something which can be somewhat misleading and can be difficult to form links between the two, meaning most of our focus will be with regards to performance based measures on time series stock data.
14
1.6 Delimitations
Our ambition with this thesis is to investigate the hypothesis about the effects of an IPO. This study starts with a broader approach on the effects of IPOs mainly in Europe, fur-ther on it will be isolated to football clubs going public. The input sample of the clubs’ financial performances after an IPO will be restricted to European football clubs mainly since it is more feasible considering the time restriction of this master thesis. Due to this factor and the complexity of reaching all publicly traded European football clubs we de-cided to spend our limited time collecting quantitative data instead of conducting inter-views to obtain qualitative data. We also believe that the qualitative data will not con-tribute to the same degree as the quantitative data, which will give us unbiased and pre-cise results in the process of achieving our purpose. We will from now on focus solely on quantitative measurements of the financial performance regarding the football clubs listed on the STOXX Europe Football index6 along with a number of others not listed in the index.
We will limit ourselves to measuring the financial performance in the short-term by cal-culating the initial discrete return of the first trading day. We measure the long-run per-formance by calculating continuous returns and sampling daily prices to calculate cu-mulative abnormal returns (CAR) and the Jensen’s alphas for the publicly traded clubs included in our sample (Table 9.2).
One of the limitations when performing time series data studies is the accuracy of the stock prices. We found that different databases gave us different stock prices, meaning we settled for the reliable Datastream software for our data rather than online-based sources. We also decided to not include the Turkish clubs that are publicly traded due to not being able to find suitable sources regarding the risk free rate of interest in the Datastream database. The figures we obtained were too large and would affect the
6The STOXX Europe Football Index covers all football clubs that are listed on a stock exchange in Eu-rope or Eastern EuEu-rope, Turkey or the EU-Enlarged region. The index accurately represents the breadth and depth of the European football industry.
15
sults of our data too much, completely changing the beta and alpha parameters to give an unfair evaluation when combined with all other entities.
The sample size of our study is another factor that may affect our results. We are per-forming studies on 20 different football clubs, meaning that the sample size does not reach the central limit theorem7. This limits us to statistical models, which do not as-sume normal distribution, such as the t-test. In the method section, we will attempt to in-troduce the disadvantages of using each specified model.
7 When the given number of variables is large enough to assume normal distribution (Damodar & Dawn,
16
2 Frame of Reference
2.1 Underpricing/Overpricing
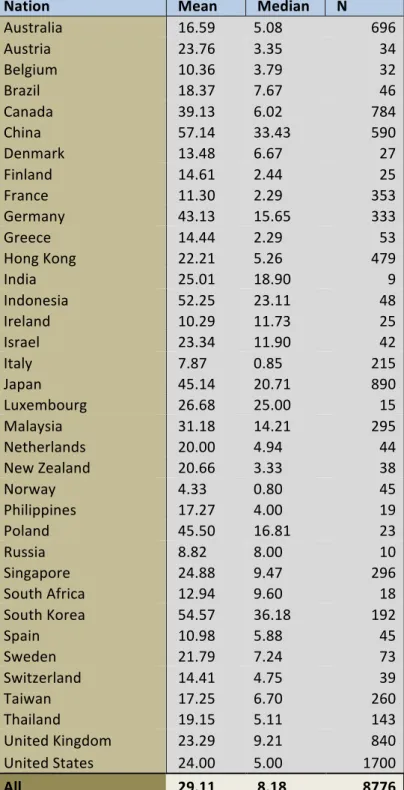
Dibrovski & Brooks (2004) explains the underpricing phenomenon as an asymmetry of information between the underwriters and the issuers regarding the market conditions. The issuers often agree on a underprice for the underwriters to avoid marketing costs of the IPO, and instead let the initial capital gain work as marketing in appropriate media. The author defines the asymmetry of information as the main contributor to underpric-ing, even though he mentions that there are some other less significant factors contrib-uting to underpricing. Banerjee et al. (2011) includes a table of the average underpricing percentage of IPOs in different countries measured on data from IPOs between 2000-2006 (See Appendix, Table 9.3). These average percentages will be used as benchmarks when comparing the price paid by underwriters for a share and the price paid at the clos-ing of the first tradclos-ing day on a stock exchange.
The opposite of underpricing is of course overpricing. Shayne & Soderquist (1995) ex-plains that the market of IPOs is inefficient. The inefficiency could both be explained by underpricing and overpricing of issuing shares, although the authors believe that there has been too much interest in underpricing, thus they focus on the overpricing phenom-enon instead. According to Shayne & Soderquist (1995) IPOs are often made during a high market i.e. the market is overvalued thus the result of it cause an overvaluation of IPOs under the circumstances. Loughran & Ritter (1995) also found that one can almost directly see if a company is overpriced, by simply looking at book-to-market value. The authors claim having a low book-to-market value is often a sign to overpricing of the firm’s stock.
This to some extent contradicts what more recent authors like Banerjee et al. (2011) and what Dibrovski & Brooks (2004) have found about IPOs. They believe that there is a strong trend of underpricing. What all authors agree on in their different research papers
17
is however those entities, which have recently conducted IPOs, tend to underperform seasoned stocks8 in its specific industry.
Shayne & Soderquist (1995) use Loughran & Ritter (1995) data to compare the differ-ence in the performance of seasoned stocks considering two different hypothetical in-vestment strategies against IPOs9. First, they buy an equivalent amount of seasoned stocks to what they would have invested in IPOs annually and hold each year’s invest-ment for five years ahead. Secondly they benchmarked it against the strategy of pur-chasing seasoned stocks directly in proportion to the number of IPOs made each year10 and hold it for five years. Shayne & Soderquist’s (1995) could conclude that, according to Loughran & Ritter’s (1995) data, the general stock market was overvalued by 22.7% during the period IPOs were made. IPOs are generally sold with 12.5 % premium on top of the overvaluation resulting in a total overvaluation of IPOs to 38% (Shayne & Soder-quist, 1995).
2.2 Profit-Maximizers vs Win-Maximizers
Kesenne (2008) discusses the difference in motives and objectives of sport club owners. Owners can either be “profit-maximizers”, where their objective is to maximize returns for the owners, or they can be “win-maximizers” where their goal is to maximize suc-cess or the utility of sucsuc-cess for a given level of profits or losses. Kesenne (2008) found that European football clubs often act as utility maximizers rather than profit maximiz-ers. This differs from for instance American sports clubs and leagues that are run more business-like. (Kesenne, S., 2008) The motives and objectives of sport clubs owners have an effect on how the new capital raised from an IPO would therefore be used. Win-Maximizers are more likely to use gained capital to invest in productive assets such as players or stadium that will guarantee success and therefore utility for the own-ers. Profit-Maximizers are more prone to use that gained capital to financially restruc-ture the club, by for example reducing debt and to become more stable financially.
8 More mature stocks who have been in the market during a longer time. 9 Based on a sample size of 4,753 IPOs made in the U.S. between 1970-1990.
10 The return of the strategy was calculated by weighting the returns of the seasoned stocks by the number
18
erally this is a key factor in explaining the differences between sports clubs and firm in a different industry. In a competitive financial market, shareholders and owners are prone to be profit-maximizers as they are keen to reap financial gains from investments. Psychological factors play into that of owners of sports clubs, where the utility of “on-field” success can be just as or more important than financial gains causing irrational decisions regarding the financial well-being of the club.
2.3 Long-Run Performance after IPO
In Leleux & Muzyka (1997) work they examined the long-run performance of European IPOs with negative results, thus finding an underperformance trend in the European IPO market. Leleux & Muzyka (1997) measured the long-run performance by calculating cumulative abnormal returns (CAR) of the newly issued stocks in a time period of 36 months (three years) after the issue. The results from measuring the CAR of the Euro-pean IPOs over the 36 months gave the authors a similar pattern of the long-run perfor-mance as when they conducted a cross-sectional regression, which evaluated both ab-normal returns and systematic risk. This finding in Leleux & Muzyka (1997) enforces the result previously found by Rydqvist (1993) and Ritter (1991) regarding the long-run underperformance of IPOs.
Loughran & Ritter (1995) argued in their research that issuers tend to time entering the market with new shares when their firm is relatively overvalued. This to maximize the amount of raised capital limited to the amount of issued shares. Doing this however contributes to a low book-to-market value and therefore the issuing firm’s stock will underperform in the longer run when benchmarked against index to equalize previous overvalue (Loughran & Ritter, 1995). In Brav, Geczy & Gompers, P.A. (2000) they also found that long-run performance of newly issued stocks measured in abnormal returns and cumulative abnormal returns often matched the book-to-market value connected to the firm. As much research uses the CAPM11 to find expected returns and to find con-nections to valuation and performance of a stock, this model has shown a small ability to explain the cross-sectional returns (Brav et al., 2000). On the other hand the
19
tive abnormal return (CAR) has shown a great ability in replicating cross-sectional data and thus it has been considered an appropriate tool (Leleux & Muzyka, 1997).
Another way to measure the long-run performance of a stock against the market (or an-other comparable index) is to calculate the Jensen’s alpha where you risk-adjust the stock’s historical performance against the market (Berk and DeMarzo, 2013). A positive alpha indicates an outperformance of the market the stock is benchmarked against and a negative alpha indicates an underperformance (Flaherty & Li, 2004). One should though be careful with drawing conclusions about the positive alpha, even if it is statistically significant, since positive alphas are often due to chance12 (O’Sullivan, Hutchinson, & O’Connell, 2009).
20
3 Method
In this section the relevant methods that will be used to analyze our data will be introduced, ex-plained and determine what way we will be able to use the data available to us. One will also be able to read at the potential advantages and disadvantages of each method.
3.1 Methodology
● DEDUCTIVE (top-down approach; considering we investigate a hypothesis like underpricing/overpricing and long-run underperformance.)
● METHOD STRATEGY
○ Quantitative⇒ Journals, Financial Ratios, Financial and Accounting statements, Time Series Data.
● PHILOSOPHICAL APPROACH
○ Pragmatism ( uses multiple methods with quantitative data, values play a large role in interpreting results, external multiple view chosen to best enable answering of research questions)
(Saunders, Lewis, & Thornhill, 2009)
When deciding on how to construct a method, one must know whether or not they want to test a theory or build an own theory. It is also important to know how to explore and find the data needed to arrive with a conclusion of the results in the end, e.g. through qualitative or quantitative measures. Since our field of study is the financial/business field we intend to use Saunders, Lewis, & Thornhill’s (2009) as guidance in the con-struction process of our method.
We have chosen to focus our study based on quantitative data gathered from earlier re-search papers and using our own mathematical calculations based on time-series data. Our method will thus be concentrated on solely quantitative methods. We have chosen to conduct the method in a deductive manner, as we believe it will be easier for the ob-jective reader to follow us throughout our work by using this method
21
In this thesis we have chosen to test existing theories concerning the effects of IPOs previously examined by other authors in the context of corporations outside the sport business, but in our case we will investigate if the same effects apply to sport clubs who have become publicly traded on the stock exchange13. We will move from existing theo-ries to collect data to examine the relationship between IPOs and the under/overpricing phenomena and also the theory of the long-run underperformance of IPO stocks com-pared to existing competitors’ stocks in the same sector. Therefore our research ap-proach will be in a deductive manner, as we are planning to test the existing theories earlier mentioned regarding the effects of an IPO, but in the context of a sport club’s stock.
The philosophical approach of this thesis will be pragmatism14. There will be a strong focus on obtained values that will play a large role in our interpretation of the results, as we also will have a multiple method design in our research approach. The multiple method design is founded on the basis that we will have a small sample size, consider-ing the population of football clubs listed on a stock exchange in Europe is quite small in relation to other populations in a specific listed industry and considering we will still focus on the quantitative and observable data.
3.2 Method
To gain a broad picture of the effects of going public for a sports club, combined meth-ods of different quantitative measures will be used to assess this. When performing re-search it is important to perform studies that will give objective results, thus our sample must reflect the European IPO market for football clubs. It is also important to remind the reader that many of the models, methods and ratios used below can be altered in some way by the firm publishing them to give an unfair picture of finances and there-fore a subjective view on certain issues (Menon, C. 2013). Our key concern here is to give a fair and consistent view on all firms that will be applied. It is important to
13 Sport Clubs which have conducted an IPO
14 In the view of the authors you should study what interests you and is of value to you, study in the
dif-ferent ways in which you deem appropriate, and use the results in ways that can bring about positive con-sequences within your value system.
22
sider all models and methods when giving an assessment and conclusion on the perfor-mance of an entity.
3.2.1 Assessing the effect of an IPO using Performance Measures
There are a number of performance-based measures that relate to the stock price of any entity, which help us measure the period after an IPO has been conducted. These will assist us in obtaining key results, giving us useful insights into the performance of sports clubs in a comparable nature and setting of performance-based methods. For this section and for the methods to be introduced below we require historical time series da-ta, based on the stock price movements of the entity or market in question, and to create certain indicators as to how the club or the firm has performed since going public. As will be discussed later in this section, a comparison between a newly listed sports club and seasoned stocks can also be made using these quantitative measures. We will base our methods on the return of the stock/market prices, which will be calculated using a logarithmic approach. This gives us a more accurate and effective return based on our sample size and time period. We used this approach as the returns are continuously compounded, meaning that we can compare certain assets without regard to the number of times they have been compounded. Logarithmic returns can be assumed to being normally distributed over a number of trades, which is beneficial for the accuracy of our data analysis and statistical tests (Hudson & Gregoriou, 2010). Logarithmic returns can be calculated by using the following formula:
𝑳𝒐𝒈 𝑷𝒓𝒊𝒄𝒆 𝑻
𝑷𝒓𝒊𝒄𝒆 𝑻!𝟏 = 𝑪𝒐𝒏𝒕𝒊𝒏𝒖𝒐𝒖𝒔 𝑹𝒆𝒕𝒖𝒓𝒏
Once this has been calculated for each period of our dataset, we can continue in per-forming the calculations based on the following models.
23
3.2.2 Abnormal Return & Cumulative Abnormal Return
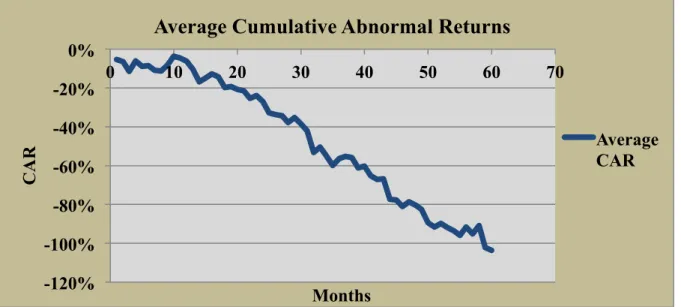
Cumulative abnormal returns is a useful indicator in assessing how an investment fares with respect to its predicted return based on an index or the market. The predicted return is what a potential investor should expect to receive on an investment, based on the par-ticular index price movements (Berk and DeMarzo 2013). The long-run underperfor-mance in relation to seasoned stocks15 and the market in general, will be measured in terms of the annual growth in stock price for each individual in the sample bench-marked against the annual growth in price for a seasoned competitors stock. As earlier researchers (Ritter; 1991, Rydqvist; 1993 and Leleux & Muzyka; 1997) have used cu-mulative abnormal returns (CAR) to measure the long-run underperformance we will utilize this measurement to enable comparison of European football clubs IPOs perfor-mances in the long run. To do this we will first calculate the abnormal returns on a daily basis as follows:
Abnormal Return = Actual Return – Predicted Return
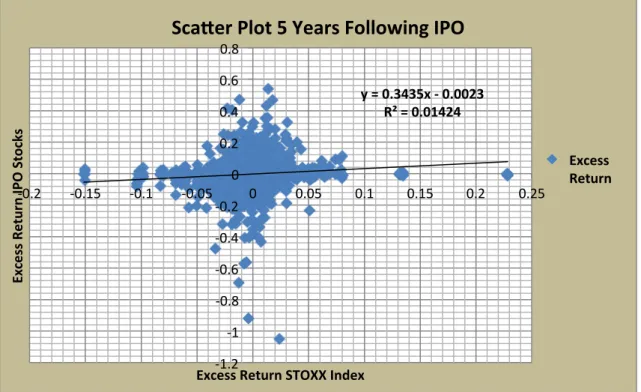
After this, the abnormal returns are aggregated to find the CAR for each club on a daily basis as well as on a yearly basis. To display the fluctuations and trends in both abnor-mal returns and cumulative abnorabnor-mal returns it will be graphed based on the daily re-sults. According to Ritter (1991), the long-run underperformance tends to last between three to six years, leading us to decide to include time-series data regarding the issued stocks five years after their IPO dates. We will also attempt to create an average of all entities we have looked at to create a more clarifying picture of the overall CAR for sport clubs.
24
3.2.2.1 Statistical Tests
Once we have gathered the data concerning abnormal returns and CAR, we will under-take a statistical study to validate the statistical significance of our results. We will per-form a test measuring whether our null hypothesis (H0) or alternative hypothesis (H1) is correct. This will be conducted using a left tailed t-test. A t-test can be used when we cannot assume normal distribution due to, among other things a small sample size. Since our sample consists of 20 different football clubs, we cannot assume normal dis-tribution and therefore use a t-test which does not require normally distributed data (Damodar & Dawn, 2009). Such a test says that the null hypothesis (H0) is greater or equal to 0 and the alternative hypothesis (H1) is less than 0.
We can obtain a t-value by using the following formula:
𝒕 − 𝒗𝒂𝒍𝒖𝒆 =𝑴𝒆𝒂𝒏 𝒐𝒇 𝑨𝒃𝒏𝒐𝒓𝒎𝒂𝒍 𝑹𝒆𝒕𝒖𝒓𝒏𝒔 𝑺𝒕𝒂𝒏𝒅𝒂𝒓𝒅 𝑫𝒆𝒗𝒊𝒂𝒕𝒊𝒐𝒏 𝑨𝑹
𝑵𝒐. 𝒐𝒇 𝑶𝒃𝒔𝒆𝒓𝒗𝒂𝒕𝒊𝒐𝒏
We thereafter will compare the value obtained to the critical value from a statistical t-table16 leading to an eventually accepting or rejecting the null hypothesis (H0), depend-ing on whether the t-value lies in the critical region or the uncritical region.
H0 = Football clubs’ abnormal Returns are ≥ 0
H1 = Football clubs’ abnormal Returns are < 0
If we accept the reject the null hypothesis (H0) we will therefore be able to conclude that the return stocks of football clubs underperform on a daily basis with regards to the return of the stock index or expected return.
25
3.2.2.2 Disadvantages of Abnormal Returns
In a study conducted by Barber & Lyon (1999), they brought up disadvantages when us-ing abnormal returns with regards to misspecifyus-ing test statistics. Abnormal returns are generally used after an event to measure the effect of it. However new listing or survi-vor bias, rebalancing bias and skewness bias were all factors that were brought up af-fecting the test statistics and the size of rejection levels when hypothesis testing (Barber & Lyon, 1999). In Coutts, et al. (1995) they discuss how the time frame that one con-ducts abnormal returns on after an event is poorly specified and is often the choice of the writer. Also differences in trading days and infrequent trading of the firms stock (seen at various points in our data) when comparing to the market index means that the CAR can at times be incomplete (Coutts, A.,et al., 1995).
3.2.3 Jensen’s Alpha
The long-run financial performance of the football clubs will also be measured by cal-culating Jensen’s Alpha for each club, also based on daily time-series stock data. Jen-sen’s Alpha will help us determine if the stock has over- or underperformed the national stock index where each individual club is listed. Jensen’s Alpha measures the excess re-turn of the stock with respect to the market risk premium17. If the stock has a majority of consistently positive excess returns the alpha will be of positive character and if the stock has a majority of consistently negative excess returns the alpha will then be of negative character instead (Berk & DeMarzo, 2013).
17 Market Risk Premium (MRP). To obtain the MRP we deducted the daily market index return by the
26 JENSEN’S ALPHA = ⍺
Finding alpha through regression:
Y=⍺0 + β1X1 + ε
Y= Excess Return Stock
β1= Beta (volatility measure for how the stock follows the market)
X1= Excess Return Market
ε= Error Term (Residuals)
The dependent variable Y in our study will be the stocks’ excess returns run against the independent variable X, the excess return of the market, also known as the market risk premium (Berk and DeMarzo, 2013).
The Alpha (𝛼) should not be significantly different from zero18; otherwise it will be a
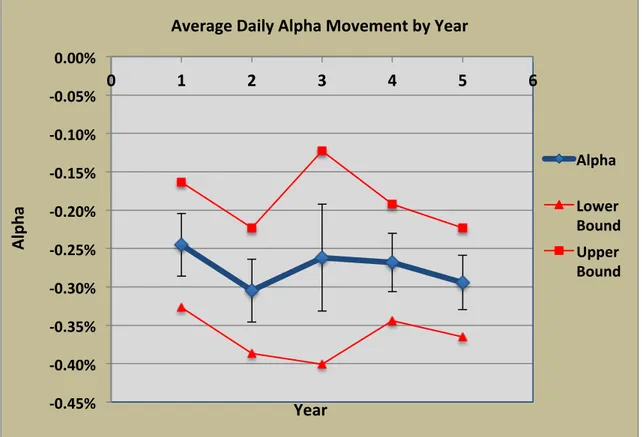
sign of either over- or underperformance (Flaherty & Li, 2004). We will obtain the al-phas for all stocks in our sample through running simple regressions, after which we will aggregate the results and find the arithmetic average. Later on the results will be plotted in a graph to show the development of alpha for the listed European football clubs over time. These graphs will work as a tool to simplify the process when analyz-ing the trend of performances. To validate our results we will also conduct a simple re-gression of the excess returns of the stocks against the excess return of the market. By running the regression on a yearly basis for each of the 20 football clubs in our sample, along with alpha we can obtain a standard error and confidence intervals. We will ana-lyze our data using confidence intervals at a 95% level, forming lower and upper bounds wherein we are 95% confident alpha will lie. We will be able to here again form a general conclusion of the performance of all football clubs by finding a mean upper and lower bound along with standard error for all football clubs and plotting these along with the mean alpha.
27
3.2.3.1 Statistical Testing for Alpha
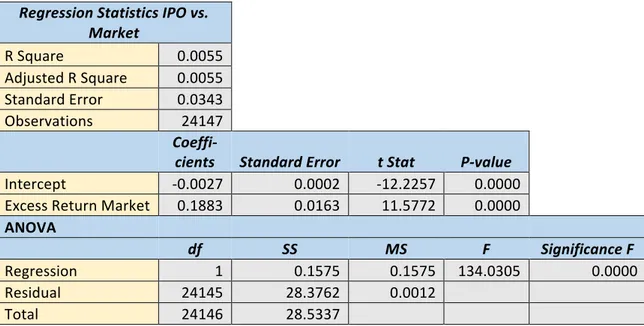
Much like the statistical measures used in the previous method, we will be attempting to analyze the statistical significance of the alpha values obtained. To gain a true under-standing of football clubs as a whole we will be required to use all data in one specific simple linear regression model. To be able to pair returns of the market on precisely the same time period as that of the stock returns since being listed we will be using the stacked data technique, simply stacking each football clubs stock returns versus market returns to create one unified sample. After this we can run a simple linear regression for a best-fit line and can proceed in testing the validity of our data.
We will again introduce a hypothesis, and test it using a simple t-test. As mentioned in the previous section, the formula for obtaining the t-value is as follows19:
𝑻 − 𝒗𝒂𝒍𝒖𝒆 = 𝑴𝒆𝒂𝒏 𝒐𝒇 𝑺𝒂𝒎𝒑𝒍𝒆
𝑺𝒕𝒂𝒏𝒅𝒂𝒓𝒅 𝑫𝒆𝒗𝒊𝒂𝒕𝒊𝒐𝒏 𝒐𝒇 𝑺𝒂𝒎𝒑𝒍𝒆 𝑵𝒐. 𝒐𝒇 𝑶𝒃𝒆𝒔𝒆𝒓𝒗𝒂𝒕𝒊𝒐𝒏𝒔
The hypothesis we will be testing is as follows:
H0 = Alpha is ≥ 0
H1 = Alpha is < 0
If we then reject the null hypothesis (H0) we will be able to conclude that the obtained alpha is significantly lower than 0. The hypothesis structure is dependent upon the fact that we are investigating potential long-run underperformance of IPO stocks versus the market and seasoned stocks20.
We will also conduct an analysis based on the R-Squared statistical measure, used to measure the goodness of fit of a model and how close the data is fitted to the regression line. Squared values range from 0% to 100% based on the goodness of fit. A low
19 Damodar & Dawn, 2009
28
Squared value therefore hints that the model does not explain well any of the variance of the response data around the mean and a high R-Squared value shows that the model to a large degree explains the variance from the mean (Frost, J., 2013). The formula for calculating the R-Squared value is as follows21:
𝑹 − 𝑺𝒒𝒖𝒂𝒓𝒆𝒅 =𝑬𝒙𝒑𝒍𝒂𝒊𝒏𝒆𝒅 𝑺𝒖𝒎 𝒐𝒇 𝑺𝒒𝒖𝒂𝒓𝒆𝒔 (𝑬𝑺𝑺) 𝑻𝒐𝒕𝒂𝒍 𝑺𝒖𝒎 𝒐𝒇 𝑺𝒒𝒖𝒂𝒓𝒆𝒔 (𝑻𝑺𝑺)
By analyzing the R-Squared value we can draw a conclusion with regards to how good of a fit the model is and can be used to form predictions or forecasts regarding the mod-el.
3.2.3.2 Disadvantages of Jensen’s Alpha
Possible disadvantages when using Jensen’s Alpha, is that the excess return depends heavily on what index you choose to benchmark the stock against. Here one should crit-ically evaluate which type of index that fit every individual case. One should also be careful in using the term “positive alpha” if using an index as benchmark since the stock’s value drivers may not be responding to the same value drivers as for the chosen benchmark index (Hedge Fund-Index, 2015). Using an inappropriate benchmark index or risk-free rate will give you an alpha with a small or large bias depending on the mag-nitude of the inappropriateness.
As O’Sullivan, Hutchinson, & O’Connell (2009) mention in their work, alpha is often misrepresented even though it is statistically significant, meaning that in some cases the alpha may be positive or negative due to special events affecting the stock or fund’s per-formance. Thereby our analysis of the result might be inaccurate since we cannot with one hundred percent certainty know if we avoided a Type 1 error22 or Type 2 error23 when rejecting or accepting the null hypothesis respectively (Damodar & Dawn, 2009).
21 (Damodar & Dawn, 2009). Can also be defined as: R-Squared = 1- (Residual Sum of Squares/TSS) 22 Rejecting the null hypothesis when it is in fact true.
29
3.2.4 Beta
There is more than one way to find the beta for a stock. We have chosen to focus on the regression beta for our listed football clubs since it will give a more valid result than other types of beta calculations considering the data we want to obtain. The beta (β) will be used to measure the volatility of the football clubs stocks in relation to the respective market index for each stock meaning that it will deliver us a sense of how sensitive the stocks are in our sample to a movement in the market as whole (Damodaran, 2013). The beta will be computed by running a regression of the known daily returns of each stock in our sample as the dependable variable against each respective market index daily re-turns as the independent variable24. The regression will only give us an estimate of how volatile the stocks are to the market movements (Damodaran, 2013).
Estimating beta through running a regression carries some limitations. The standard er-ror is small for companies that make up a large part of the index it is regressed against. The result then still, even though low standard error, will not reflect a true measurement of the systematic risk due to the heavy weight of the index it represents. The regression betas will therefore most certainly carry some noise and skewness in its result due to above factors (Damodaran, 2013).
3.2.5 Assessing the performance of an IPO with regards to underpricing and overpricing
The inefficiency apparent in the market of IPOs is generally caused by underpricing or overpricing, meaning that there is a significant difference between the issuing price and the closing price of the first day on a stock exchange (Shayne & Soderquist, 1995). One statement previous researchers all mention is that IPO stocks tend to underperform in
24 Y= Beta1*X1, where Y is the stock return and X1 is the return of the market. The regression will give
us an estimated Beta1 which is the volatility of the stock i.e. how the stock responds to swings in the market as whole.
30
terms of the stock’s price development in relation to already long-run established simi-lar stocks outstanding in the market.
To evaluate the commonly known phenomena over- / underpricing stated by earlier re-searchers such as Ritter (1991), Leleux & Muzyka (1997) and Shayne & Soderquist (1995) we decided to sample European football clubs IPO prices and their first day’s closing price after their IPO date. This data will then be used to compute the initial dis-crete return25 for all clubs in our sample representing the level of over-/underpricing26.
Potentially, there will be a pattern of over- or underpricing when looking at sport clubs listed on a stock exchange. The issuing prices will be gathered from different sport clubs’ prospectuses and news articles mainly. The first day’s closing price of each indi-vidual sport club’s stock in the sample will be received from Yahoo Finance or DataStream.
To measure the short-run performance considering IPOs and under/overpricing we will use our sampled data including IPO prices and first day’s closing prices to calculate the initial discrete return of each newly issued stock’s first trading day to see if it appreciat-ed or depreciatappreciat-ed. The outcome of this simple investigation will be concludappreciat-ed with a ta-ble exhibiting each observation in the sample, as we will also calculate the average of the sample to get an overview of the initial returns.
3.2.6 Comparison of firms based on STOXX index and market index
Looking at historical movement in prices of an index compiled of football clubs and comparing it both to the stock exchange or market and firms in other sectors will give us an overall picture of the overall performance of European football clubs over that pe-riod of time to a certain extent.
25 Initial Discrete Return = (Closing Price first day- IPO Price) / IPO Price 26 Underpricing= IPO Price < First day’s closing price
31
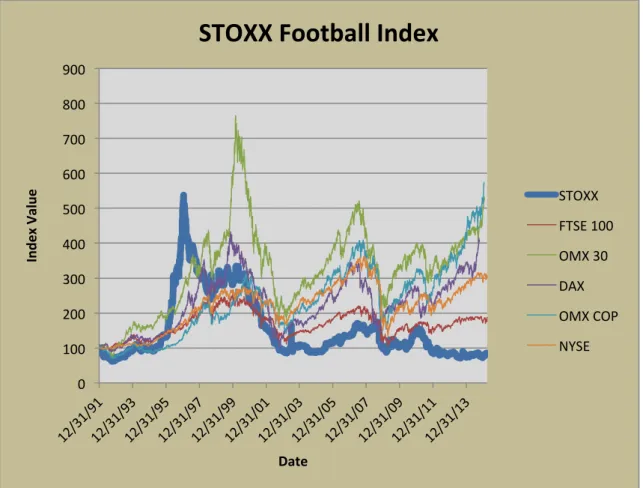
STOXX.com (2015) offers information on a bundle of all 22 publicly traded European football clubs listed on the Dow Jones STOXX European Football Index and historical stock price data and movements of these components (See appendix 9.4 for list of enti-ties). As well as just analyzing individual football clubs and their historical stock price data, we can get a more general picture of how football clubs perform as a whole. Using an index compiled of 22 different football clubs rather than an individual firm and com-paring it to a stock exchange index will give us a more fair evaluation of this sector as a whole and gives us a more accurate analysis and conclusion. “The STOXX Europe Football Index covers all football clubs that are listed on a stock exchange in Europe or Eastern Europe, Turkey or the EU-Enlarged region. The index accurately represents the breadth and depth of the European football industry.” (STOXX.com, 2015). By ob-taining historical time series data provided by Datastream, we can later analyze the overall performance of publicly listed European football clubs.
After obtaining historical stock prices since the index started operating in 1991 we will also strive to obtain beta values of the stock movement benchmarked against different indices, which are important factors for investors giving an insight on volatility, and therefore risk amongst other things (King, B 1966).
A correlation analysis between the STOXX index and the market and different indices, helps us in analyzing whether there is a strong or weak link between the two. 27We in-tend to select a variety of different indices based on which exchanges the football clubs have been listed. A strong correlation would suggest that the football clubs’ stock price moves in a similar pattern to the rest of the market. A beta analysis as mentioned in pre-vious sections will be important in analyzing the volatility of the STOXX index and football clubs in whole when benchmarked against the market. A beta larger than one would imply that the index is more volatile than the market, posing higher risk to an in-vestor. A beta smaller than one would suggest that the index is less volatile and also pose a lower risk to an investor.
We will attempt to create graphs showing the movement of the stock price to give us a clearer picture of how in turn certain events may have affected the price movements. In