Human Detection Using Ultra Wideband
Radar and Continuous Wave Radar
Division of Communication Systems Department of Electrical Engineering
Linköping University SE-581 83 Linköping, Sweden Copyright 2021 Atheeq Ahmed
Master of Science Thesis in Electrical Engineering
Human Detection Using Ultra Wideband Radar and Continuous Wave Radar
Atheeq Ahmed LiTH-ISY-EX--17/5026--SE
Supervisors:
Daniel Verenzuela
ISY, Linko ping University
Dan Axelsson
Cinside AB Examiner:
Mikael Olofsson
a
Abstract
A radar works by radiating electromagnetic energy and detecting the reflected signal returned from the target. The nature of the reflected signal provides information about the target’s distance or speed. In this thesis, we will be using a UWB radar and a CW radar to help detect the presence and rough location of trapped survivors by detecting their motions. Range is estimated in the UWB radar using clutter removal with SVD and for the dual frequency CW Radar using STFT and median filtering. The effect of the algorithm parameters on their performance was analyzed. The performance of the implemented algorithms with regards to small motion detection, distance estimation and penetration capability was analyzed. Both systems are certainly capable of human detection and tracking.
b
Acknowledgement
I would like to express my special thanks and gratitude to everyone involved in
this mater thesis. Dan Axelsson for providing me this wonderful opportunity to
work on this project and for his constant support throughout the course of this
thesis. Daniel Verenzuela for his valuable advice and encouragement. Mikael
Olofsson for his useful inputs and supervision. I would also like to thank my family
and friends for their moral support. Special thanks also to everyone who helped
proofread my report and gave useful feedback. This thesis would not have been
possible without all your support and I am deeply grateful.
i
Table of Contents
1 Introduction ... 1
1.1 Background and Motivation ... 1
1.2 Problem Statement ... 2
1.3 Limitations ... 2
2 Theoretical Background ... 3
2.1 Radar Theory ... 3
2.2 UWB Radar Technology ... 4
2.3 Dual Frequency Continuous Wave Doppler Radar ... 6
3 Hardware ... 8 3.1 HumanFinder ... 8 3.2 CIP ... 9 4 Software ... 10 4.1 HumanFinder ... 10 4.2 CIP ... 11 5 Related Work ... 12
5.1 Signal Processing for Close Perimeter Protection using UWB Radar ... 12
5.1.1 Background cancellation ... 13
5.1.2 Range detection based on maximum energy ... 13
5.2 Singular Value Decomposition (SVD) ... 14
5.3 Signal Processing Algorithms for CIP Dual Frequency CW Radar ... 16
5.3.1 Hilbert Transform ... 16
5.3.2 Distance estimation by phase accumulation ... 17
5.4 Distance estimation using STFT and Median Filtering ... 18
5.4.1 Short-time Fourier transform... 18
5.4.2 Median Filtering ... 18
6 Method ... 19
6.1 HumanFinder ... 19
6.1.1 Experimental Setup ... 19
6.1.2 Analysis of Received signals from hardware... 19
6.1.3 SVD Implementation ... 21
6.2 CIP ... 22
6.2.1 Experimental Setup ... 22
6.2.2 Time domain analysis of received radar signal ... 23
6.2.3 Phase extraction using STFT ... 24
ii
7 Results ... 27
7.1 Small Motion Detection ... 27
7.2 Distance Estimation Accuracy ... 28
7.3 Penetration Capability ... 29
8 Discussion and Analysis ... 30
8.1 Effect of SVD dimension size (N) ... 30
8.2 Effect of STFT window size on distance estimation ... 31
8.3 Small Motion Distance Estimation ... 33
8.4 Practical tests with walking human ... 34
9 Conclusion... 36
iii
Acronyms
UWB - Ultra Wide Band CW - Continuous Wave FFT - Fast Fourier Transform
SVD - Singular Value Decomposition STFT - Short Time Fourier Transform
FCC - Federal Communications Commission Agency PRF - Pulse Repetition Frequency
EIRP - Effective Isotopically Radiated Power FMCW - Frequency Modulated continuous wave
1
Human Detection Using Ultra Wideband Radar and
Continuous Wave Radar
1
INTRODUCTION
1.1 Background and Motivation
The deadliest forces of nature, earthquakes, landslides and tsunamis can cause massive destruction and loss of life. There is not much we can do about these natural forces yet but there is a lot we can do to be prepared for such an event and its aftermath. Locating and rescuing people trapped in rubble is a time critical task of great importance and to the unfortunate victims a question of life or death. This thesis is part of a project to develop a device that will be useful in search and rescue operation in such critical situations. Human detection and tracking has been recently researched and has many potentially useful applications.
Radars are known for their use in detecting and tracking various objects like planes and ships. Radars have also been long used for imaging the subsurface and only in the past few decades, radar technology is being applied for through-the-wall imaging [1].
Through-the-wall radar surveillance technology is still in its infancy and more research needs to be done to fully understand its capabilities and limitations. In this thesis, we will analyze two such through-the-wall radars systems and their ability to detect and track humans behind obstacles.
A radar works by radiating electromagnetic energy and detecting the reflected signal returned from the target. The nature of the reflected signal provides information about the target’s distance or speed. In this thesis, we will be using an Ultra-Wide Band (UWB) radar and a Continuous Wave (CW) radar to help detect the presence and rough location of trapped survivors by detecting their motions. A CW radar operates by transmitting a fixed frequency wave while the UWB radar operates typically using very short duration impulse signals or stepped frequencies over a wide frequency bandwidth.
The thesis is being done under the supervision and with the collaboration of Cinside. Cinside AB is a Swedish company based in Linköping Sweden that develops and markets high resolution hand-held radar systems to detect motion behind walls and other obstacles. Cinside is currently developing multiple radar systems for Human Detection and this thesis is part of this research. In this thesis, two such radar systems will be studied and developed, namely the HumanFinder which is a UWB Radar system currently under development and the CIP which is a CW Radar system. The goal is to implement new signal processing algorithms for both radars to detect human motion with better reliability and to perform a comparative study on their effectiveness. The aim of this thesis is to help optimize the use of available technologies to support development of an accurate human detection device that will help save lives in the future.
2 1.2 Problem Statement
The focus of this Thesis is to improve the software and signal processing algorithms for HumanFinder and CIP radar systems. The developed systems will be tested and compared based on the performance metrics that are defined in the next section.
The main objectives of this thesis are described as follows:
1. Evaluate and implement one new distance estimation algorithm for the HumanFinder system and one for the CIP radar system (see section 5.2, 5.4). 2. Analyze the implemented algorithms and find the parameters for best
performance (see section 8.1, 8.2).
3. Evaluate the performance of the implemented algorithms in terms of small motion detection, distance estimation and penetration capability (see section 7.1, 7.2, 7.3).
1.3.1 Performance Metrics
One of the main potential applications for the radars is to detect human movements and ideally even very small movements like breathing. As these radars, will be used in critical situations, they will need to have a high degree of accuracy for detection. The following performance metrics will be used to estimate and compare the performance of the two systems and implemented algorithms.
1. Small motion detection- The ability of the radar to detect small motions will be evaluated by doing tests with a revolving target with different radiuses. The performance will be measured using the Signal to noise ratio (SNR).
2. Distance estimation accuracy- This accuracy will be measured by the root mean square error (RMSE) between the estimated distance and the true distance value. Tests will be conducted with a moving target placed at different distances from the radar.
3. Penetration capability- This will be measured using SNR of the two radars for detecting the same target through different thickness of obstacles between the target and the radar. In this case, we will use homogeneous concrete cinder blocks as obstacles.
1.3 Limitations
The thesis will focus on implementing different signal processing algorithms on two specific hardware architectures provided by Cinside AB. Due to the time constrains only two algorithms will be chosen for implementation and analysis.
3
2
THEORETICAL BACKGROUND
This chapter will provide the basis to understand the different concepts within radar systems that are used in the thesis.
2.1 Radar Theory
Radar stands for Radio Detection and Ranging and is used to find the presence of a target and its location [2]. A radar works by radiating electromagnetic energy and
detecting the reflected signal from the target object. The nature of the signal reflected from the target provides information of the target like its distance, direction and speed. Radars have been used for a long time, like in World War II for air and marine navigation. Over the years, they have gained important significance in civilian and scientific applications. Some examples of the fields where radars have useful applications are,
• Military: Surveillance, missile control, moving target indication (MTI), etc. • Security: Perimeter surveillance, detection of concealed weapons, etc. • Remote sensing: Terrain mapping, profiling of ice thickness, etc.
• Aeronautical: Radar assisted landing, detection of debris on runway, etc. • Automotive: Parking sensor, cruise control, autonomous navigation, etc. • Medical: Contactless monitoring of vital signs, etc.
• Industrial: Silo depth sensors, assisted vision in mining environments, etc. • Meteorological: Cloud profiling, precipitation measurements, etc.
• Safety: Survivor detection under rubble, etc.
4 2.2 UWB Radar Technology
The UWB radar technology has been used for many decades now for remote sensing applications and research in this filed is growing at a fast pace [3-4]. The basic principle
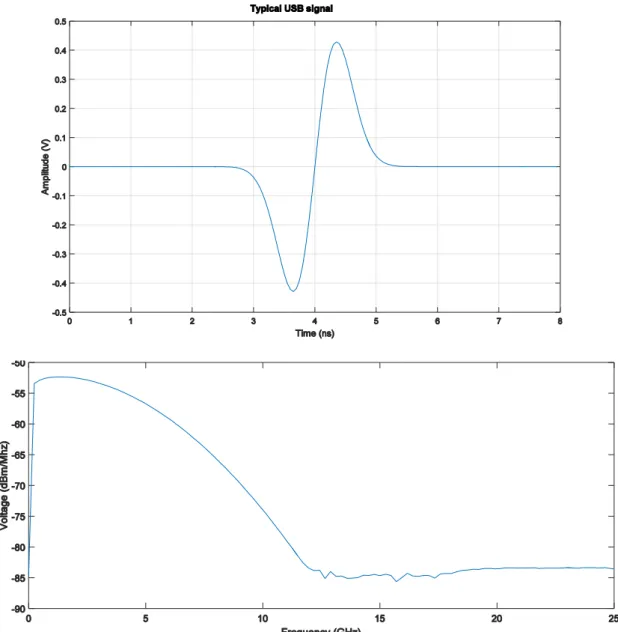
behind UWB is to transmit electromagnetic wave impulses instead of the more common transmission methods where information is modulated on a carrier wave which is narrowband. An ideal impulse will have infinite bandwidth covering all possible frequencies however this is not possible due to practical limitations and FCC (Federal Communications Commission) regulations. Hence in UWB, a pulse with finite frequency span and a very short duration is used as a good practical approximation. This pulse even though not ideal will still have a very wide frequency spectrum.
The FCC states that frequencies of a transmitted UWB signal must be within 3.1GHz-10.6Ghz. For a signal to be recognized as UWB, its bandwidth must be greater than 500Mhz or its fractional bandwidth (2𝑓𝑓𝐻−𝑓𝐿
𝐻+𝑓𝐿) greater than 0.2 where 𝑓𝐻 and 𝑓𝐿 are the upper and lower boundary points respectively on the frequency spectrum that are 10dB below the highest radiated emission, as based on the complete transmission system including the antenna. Permitted emission level must be limited under -41dbm/MHz which is referred to as the maximum limit of effective isotropically radiated power (EIRP).
The UWB radar typically uses a Gaussian pulse or its derivatives due to their simplicity. A basic Gaussian pulse can be described by the formula,
𝑥(𝑡) = 𝐴
√2𝜋𝜎𝑒 −𝑡2
2𝜎2 (2.1)
However due to the derivative characteristics of the antenna, the transmitter output can be modelled by the first order derivative of the Gaussian pulse [21] which can be
described by the formula,
𝑥1(𝑡) = 𝐴𝑡 √2𝜋𝜎3𝑒
−𝑡2
2𝜎2 (2.2)
where t is time and 𝜎 is a constant that relates to how ‘fat’ the pulse is and determines the pulse width 𝑇𝑝 which is defined as the interval which contains 99.99 % of the pulse energy. For the first derivative of the Gaussian pulse, the pulse width is can approximated as 𝑇𝑝 ≈ 7𝜎 [22].
5
Figure 2: Example of a typical UWB first derivative Gaussian impulse in time and frequency domain
In UWB radar, a short pulse is transmitted and the reflected signals are monitored. A simple impulse based UWB radar system transmits a pulse and then after a certain delay time looks at the echo signal on the receiver antenna. If the time delay is known, we can look at what is happening at a certain distance away from our radar as we know the speed of the transmitted pulse. If the surroundings are static, then the received signals from successive pulses will be identical and in the case of movement there will be differences in the received signals which can be used to extract information of the surroundings.
6
2.3 Dual Frequency Continuous Wave Doppler Radar
Doppler radars exploiting continuous-wave (CW) waveforms are often used in the detection of moving targets due to their cost effectiveness. Because Doppler radars typically use a single frequency, they are impractical for estimating the range of a target. Frequency modulated continuous wave (FMCW) radar is a type of CW radar in which the range information is obtained by frequency modulating a continuous signal [5]. A
simple and low-cost FMCW is a dual-frequency CW radar [6-7] which employs two
different frequencies and simultaneously measures the phase change with respect to time, for each of the two frequencies. The range is estimated based on the phase difference between the two frequencies. The basic principle is explained below.
For a dual frequency CW radar, transmitting two CW signals with frequencies 𝑓1 and 𝑓2,
the signal can be expressed as,
𝑠1(𝑡) = exp(𝑗2𝜋𝑓1𝑡)
𝑠2(𝑡) = exp(𝑗2𝜋𝑓2𝑡) (2.3)
Here for sake of simplicity the initial phases of the two transmitted CW signals are assumed to be zero and the amplitudes of the signals are set equally to 1. Supposing the target a point target and there are no amplitude attenuations, the echo of the transmitted signal from the target received by the receiver will be,
𝑟1(𝑡) = exp(𝑗2𝜋𝑓1(𝑡 − 2𝑅(𝑡)
𝑐 )
𝑟2(𝑡) = exp(𝑗2𝜋𝑓2(𝑡 − 2 𝑅(𝑡)
𝑐 ) (2.4)
where R(t) is range of the target and c is the speed of light. The phase difference between the above two signals is,
𝜑𝑟1(𝑡)− 𝜑𝑟2(𝑡) = 4𝜋
𝑅(𝑡)
𝑐 (𝑓2− 𝑓1) (2.5)
Thus, target range can be estimated from the phase difference,
𝑅(𝑡) = 𝑐
4𝜋∆𝑓(𝜑𝑟1(𝑡)− 𝜑𝑟2(𝑡)) (2.6)
where ∆𝑓 is the difference in frequency of the two frequency signals in the dual frequency radar.
7
Due to phase wrapping both phases in the equation (2.6) are measured in the [0,2𝜋] range then,
𝜑𝑟1(𝑡) = −4𝜋𝑓1𝑅(𝑡)
𝑐 + 2𝑛𝜋
𝜑𝑟2(𝑡) = −4𝜋𝑓2𝑅(𝑡)
𝑐 + 2𝑚𝜋 (2.7)
where m,n are unknown integers. Therefore,
𝑅(𝑡) = 𝑐
4𝜋∆𝑓(𝜑𝑟1(𝑡)− 𝜑𝑟2(𝑡)) −
𝑐(𝑛−𝑚)
2∆𝑓 (2.8)
As the range can assume infinitely different values for the same phase difference separated by 2∆𝑓𝑐 , there exists ambiguity in the range. Hence, the maximum unambiguous range (Ru) of the target is,
𝑅𝑢 = 𝑐
2Δ𝑓 (2.9)
This maximum unambiguous range depends on the separation between the two distinct carrier frequencies. For example, a 5-MHz difference in the carrier frequencies yields an unambiguous range of 30 m.
8
3
HARDWARE
In this chapter, details have been provided about the hardware that is going to be used in this thesis. The hardware has been developed by Cinside AB and is part of their ongoing research and development of radar systems for human detection. As some of the technology used in these hardware is of commercially confidential nature, only a general explanation is provided.
3.1 HumanFinder
The HumanFinder is an impulse UWB radar system with multiple transmitter and receiver antennas. Its transmission frequency is around 1-2GHz. It is a portable UWB radar system consisting of 9 pairs of transmitting and receiving antennas. It consists of 9 UWB radar chip NVA6100 [20] which are fully integrated nanoscale impulse radar
transceivers. The chip can produce 1st order Gaussian pulses and records the echo
signals as samples in a digital format which can then be used for digital processing in an embedded system or host computer. Having multiple transmitter and receiver antennas gives us the possibility to implement MIMO beamforming. The humanFinder system is a prototype still under development.
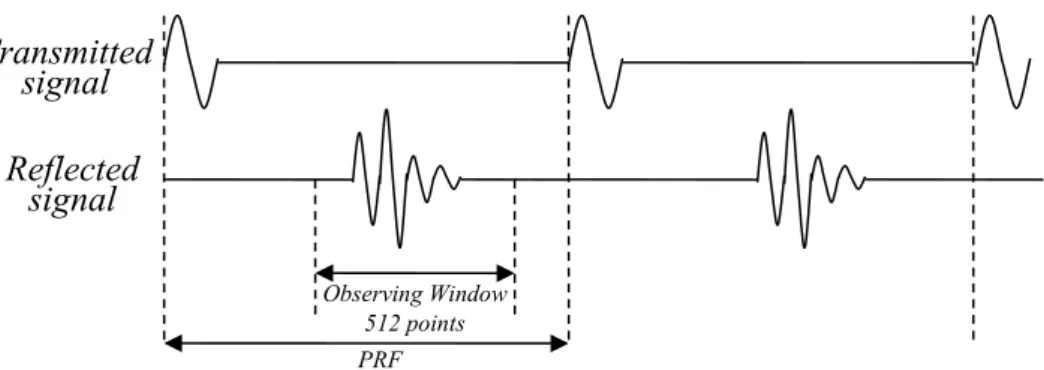
The hardware can only be used to observe a part of the reflected signal, called observing window. This is good as we can use the window to focus only on the interesting part of the received signal and thus do less processing than if we were to use the received signal in its entirety. The observing window will contain reflected radar signals from the area of interest. One such observing windows contains at most 512 samples though the starting point (receiver delay offset) of this window is adjustable.
Figure 3: UWB Radar waveforms
An observing window belonging to a transmitted pulse is called a sub-frame. To obtain more accurate data, several sub-frames are averaged in hardware and form an averaged data frame, which will be henceforth referred to as frame in this work. Only frame data can be obtained from the chip output and used for future processing. After the averaging, at the output of the chip ten frames are supplied in a second and each frame contains 512 samples.
PRF Observing Window 512 points Transmitted signal Reflected signal
9
The NVA6100 employs 32bit digital integration and 512 parallel samplers to maximize frame depth and sensitivity. The frame offset is fully programmable for an extensive detection range. The equivalent sampling rate is 38GHz which equals to a sample interval of 26ps and distance resolution of around 0.4 cm. The total observable time interval is 512x26ps=13.3µs, corresponds approximately to 2m which gives us a 2m observable range window. The Pulse Repetition Frequency (PRF) which is the rate of repeated pulses in a second is set to 100MHz in the hardware.
Figure 4: HumanFinder Hardware
3.2 CIP
The CIP is dual frequency continuous wave handheld wall penetrating radar that can sense movements such as a person hiding or trapped several meters behind a wall. Its transmission frequency is around 10GHz(+/- 5MHz). It is also capable of giving further information of the movements such as its direction, speed and distance. The CIP is a much more mature system compared to the HumanFinder in terms of development. However, extracting useful information from the radar is not easy and requires digital signal processing which still is being developed and perfected.
The CIP is a small hand-held portable battery-powered radar of dimensions 18x12x4 cm. It has one switch for turning the device on and off. It has a USB port that is used for powering the unit and charging its internal battery and communication of data between the device and its user-interface software CiMon. It has a dual frequency radar on the front side and a single frequency radar on the back to detect and compensate for movement from the user. It also has inbuilt accelerometers which can detect self-motion of the device. As the device, must be static for meaningful measurements, the accelerometers are useful in determining if the radar is static and avoid erroneous measurements.
10
4
SOFTWARE
In this chapter, details are provided about the software that is going to be used as part of this thesis. Software has been developed by Cinside to operate and develop the HumanFinder and CIP hardware using a windows platform. For the purpose of this thesis MATLAB will also be employed for simulation and post-processing analysis.
4.1 HumanFinder
The data from the hardware can be collected using the Cinside windows development platform as a 2-D matrix in which each column is one frame of data. Assume T seconds of data is collected; the matrix size would be 10T columns and 512 rows. It can read out data at around 10 frames per second. A windows application is available to use and operate the hardware. It can be used to set various parameters of the radar system such as sampling rate, receiver and transmitter delay. Below is a screenshot of the windows application for the HumanFinder radar system.
11 4.2
CIP
The CIP comes with its accompanying software called CiMon which provides a user-friendly development and testing platform. CiMon is a windows application built by Cinside. It gives the user the ability to operate and monitor the CIP hardware. It also has functionality to record observations which can later be used for post processing.
12
5
RELATED WORK
This section will contain information on the existing works which were used as the basis for this thesis. A literature study was carried out in the first month in which many research papers and articles related to the thesis were studied. They are mostly research articles within the field of UWB [15-18] radar and CW radar [8-11]. The existing
algorithms in sections 5.1 and 5.3, along with the algorithms in sections 5.2 and 5.4 that were implemented in this thesis are explained below.
Most of the existing through-the-wall radars employ either UWB impulse signals or complex modulated waveforms with wide bandwidth to achieve high range resolution
[11]. The frequency range used by these radars makes it possible to penetrate obstacles
like walls to a certain degree and we can analyze the reflections to make estimations of the surroundings in the scope of the radar beam. A static surrounding will produce a static signal while moving objects will cause changes in the signal which we can detect using some signal processing. The distance, direction and nature of movement can be estimated using the UWB radar, however, robust and accurate estimation algorithms need to be developed for the HumanFinder radar system.
While the UWB radars are expensive in cost and complex in design, the CW Radar using a single frequency signal is known for its simplicity, cost-effective design and narrow frequency band usage. Research on dual-frequency CW Radar has shown promising results for its use for through-the-wall target localization [8-10]. The CIP radar falls under
this ongoing research in the field of dual frequency CW Radars.
Work has already been done on both the HumanFinder radar system and the CIP system by former Cinside intern Wu Zhenzhi. In this thesis, we will be building upon and expanding the work [13-14] done by Wu. The algorithms developed by Wu are described in brief in sections 5.1 and 5.3.
5.1 Signal Processing for Close Perimeter Protection using Ultra Wide Band Radar [13]
In this paper, signal processing algorithms for UWB radar system are introduced to get the range estimations. Here the scenario is that the background is static with a moving target, a single person in this case. Range is estimated using background cancellation and calculation of peak energy points from the received frames of data from the HumanFinder hardware.
13 5.1.1 Background cancellation
The HumanFinder transmits UWB impulses and records their reflections from the surroundings. Assuming the surrounding is static then the frames of received signals over time will be exactly the same ideally. But if there were a moving object in the environment then there will be changes in the received signal over time that will be related to the moving object. Thus, by subtracting the background from the received signal these changes can be analyzed and information about the moving object can be extracted.
Wu considered two alternatives for subtraction background namely, 1. Start-up calibration
2. Real-time calibration
The start-up calibration can be done when the system initializes. As it is known that there are no moving objects during the calibration procedure, we obtain a reference background that can be used to detect moving targets. However, in this method, the environmental changes are not traced and could lead to errors in detection. The alternative method is performing calibration using the real-time data, which can be updated along with time. However, in this method, the frames containing moving targets should be excluded as they do not form part of the static background. In this implementation, the real-time calibration with data selection is employed. That means only part of the real-time incoming data is used for updating the background.
5.1.2 Range detection based on maximum energy
Assume 𝑌(𝑛) represents a single frame of the received radar signal from the HumanFinder in which the background has been removed and 𝑛 is the sample number of this frame which has a total length of 512. This signal with the background removed will contain the signal generated due to the moving target. The energy detector algorithm calculates the total energy over a period of time, which is denoted by,
𝐸(𝑛) = ∑𝑛+𝑘 |𝑌(𝑚)|2, 𝑛 =
𝑚=𝑛−𝑘 𝑘, 𝑘 + 1, … … ,511 − 𝑘 (5.1)
Figure 8: Range detection using sliding window
Where 𝐸(𝑛) is the total energy within the sliding window of length 2𝑘 + 1 centered at the sample 𝑛. The peak location is recorded as,
𝑝 = max
𝑛 [𝐸(𝑛)] + 𝑘 (5.2)
As there is a linear relationship between the distance and time of the reflected signal, the range R can be obtained from the peak location p after the right calibration.
𝑅 = 𝑐.𝑡
2 = 𝑐.𝑝.𝑇𝑠
2 (5.3)
14 5.2 Singular Value Decomposition (SVD)
Based on the literature study [18] about similar systems, singular value decomposition
(SVD) is found to be a good alternative to the above background subtraction algorithm.
SVD has multiple uses in digital signal processing such as noise reduction, compression, and patterns detection [23-34]. It works on the mathematical principle of matrix
factorization. The SVD of a matrix A is its factorization into the product of three different matrices U, D and V in such a way that the columns of U and V are orthogonal and the matrix D is diagonal with positive real entries which is mathematically represented by the expression 𝐴 = 𝑈𝐷𝑉𝑇.
We can reduce our radar system into a simple model as shown in the below figure. A moving object is placed in front of the radar. The curve represents the environment. The transmitter transmits UWB impulse which will then reflect of the object and the environment. The receiver gathers these reflections. We can say that the received signals are made up of three components namely reflection from the object, clutter and noise.
Figure 9: Simple radar system model
Clutter is the reflection from the surrounding environment of the object. Noise is the random part of the signal that are undesirable. So, the received signal R is a summation of the reflection from the object 𝑟𝑜, clutter 𝑟𝑐 and noise 𝑛.
15
The SVD is a suitable tool that can separate the clutter from the rest of the signal. It can split the data matrix into complementary subspaces which separate the noise from the signal to increase SNR which is useful for clutter reduction [17].
The consecutive frames of data obtained from the HumanFinder can be represented by a rectangular matrix 𝐴𝑖𝑗 of dimensions 𝑀×𝑁 (M being the length of each Frame and
N being the number of frames), where 𝑖 represents the time index of each individual frame (1,2, … . . ,512) and j is the frame number. For the assumption 𝑀 ≥ 𝑁 the SVD of 𝐴 is given by,
𝐴 = 𝑈𝐷𝑉𝑇
Where U and V are unitary matrices of dimensions 𝑀×𝑀 and 𝑁×𝑁 respectively. U and V are basically the eigenvectors of {𝐴𝐴𝑇} and {𝐴𝑇𝐴} respectively and D is a diagonal
matrix with positive entries which can be represented as 𝐷 = 𝑑𝑖𝑎𝑔(𝜎1, 𝜎2, … , 𝜎𝑟)
where 𝜎1 ≥ 𝜎2, ≥ ⋯ , ≥ 𝜎𝑟 ≥ 0 and 𝑟 = 𝑁 < 𝑀. By expanding D, the SVD of 𝐴 can be
given as, 𝐴 = 𝜎1( ⋮ 𝑢1 ⋮ ) (⋯ 𝑣1𝑇 ⋯) + 𝜎2( ⋮ 𝑢2 ⋮ ) (⋯ 𝑣2𝑇 ⋯) + ⋯ + 𝜎𝑁( ⋮ 𝑢𝑁 ⋮ ) (⋯ 𝑣𝑁𝑇 ⋯) 𝐴 = 𝑀1+ 𝑀2+ ⋯ + 𝑀𝑁
where 𝑀𝑖=𝜎𝑖𝑢𝑖𝑣𝑖𝑇 are matrices with the same dimensions as 𝐴 and are called as modes
or ith eigen-image of A. It was found that mode 𝑀
1 (strongest singular values) provides
the clutter information, 𝑀2 (second strongest singular values) the target information
and rest of the modes represent the noise.
𝑟𝑐 = 𝜎1𝑢1𝑣1𝑇
𝑟𝑜 = 𝜎2𝑢2𝑣2𝑇
𝑟𝑛 = ∑ 𝜎𝑖𝑢𝑖𝑣𝑖𝑇
𝑁
16
5.3 Signal Processing Algorithms for CIP Dual Frequency CW Radar [14]
In this paper signal processing algorithms for dual frequency CW Radar signal are introduced to get the distance, velocity and direction of the human movements. At first, several algorithm models are introduced and proved to be efficient. Then, several simulations and rotation cylinder tests are utilized to verify the algorithms. Results show that based on accumulation of phase information, we can obtain accurate range estimation reliability with the CIP hardware.
5.3.1 Hilbert Transform
In this algorithm, the phase and amplitude of the complex signal (also referred to analytic signal) is calculated using the Hilbert Transform. Using one-channel signal and treating it as the In-phase channel, the Quadrant channel can be generated from the Hilbert Transform. When digital signal processing is employed, the Hilbert transform can be operated using FFT.
Figure 10: Hilbert Transform
The complex signal 𝑆(𝜔) can be viewed as the positive frequency remaining version of the original signal. However, it can not distinguish the positive Doppler frequency offset or negative Doppler frequency offset, which indicates the direction of the movement.
After complex signal S(t) is obtained, the phase 𝜑(𝑡) can be easily calculated from it,
𝜑(𝑡) = arctan [𝑅𝑒(𝑆(𝑡))
𝐼𝑚(𝑠(𝑡))] (5.4)
We know that from that the range is function of the phase difference between the two signals,
𝑅(𝑡) = 𝑐
4𝜋∆𝑓(𝜑𝑟1(𝑡)− 𝜑𝑟2(𝑡)) (5.5)
Hence the range can be estimated from the phase difference between the two echo signals obtained from CIP.
17 5.3.2 Distance estimation by phase accumulation
Considering a short period of time t past from an initial time 𝑡𝑜 with initial distance 𝑅𝑜,
the offset distance 𝑅𝑑 and the distance 𝑅(𝑡) can be represented by
𝑅𝑑 = ∫ 𝑣(𝑡)𝑑𝑡0𝑡 (5.6)
𝑅(𝑡) = 𝑅𝑜+ 𝑅𝑑(𝑡) (5.7)
where 𝑣 is the velocity of the moving target.
For object detection, especially human detection, we cannot assume velocity as a constant value or any other determined format. Instead, it can be treated as a distribution which has the mean value as the base velocity and other components which contributes no distance change.
Assuming the target object is not moving but rather swinging about a fixed point, these little swings can incur to Doppler frequency offset in echo. This assumption meets the situation where human is trapped in a confined space and cannot move significantly, he may impact the reflected waveform by breath, heart beat and little body movement. Here, the velocity is a zero-mean distribution which leads to,
∫ 𝑣(𝑡)𝑑𝑡0𝑇 = 0 (5.8)
Where T is a long time period to satisfy the statistical attribute, equals to N samples, which means 𝑇 = 𝑁𝑇𝑠. Over a longer period of time, the phase can be more accurately
estimated by using the mean of phase samples. The estimated range is calculated using the mean of the estimated phase samples and the linear relationship between the phase and the range (equation 5.5).
18
5.4 Distance estimation using Short-time Fourier transform and Median Filtering Based on the literature study [11] of similar systems, a good alternative algorithm for the
DFCW is phase estimation from short-time-Fourier-transform (STFT) followed by median filtering.
5.4.1 Short-time Fourier transform
The STFT adds a time dimension to the base function parameters by multiplying the infinitely long complex exponential with a window to localize it. This allows STFT a resolution in both time- and frequency domain by applying a windowing function w(m) which is moved over the time signal x(n). The window function is usually real and symmetric with the property 𝑤(0) = 1.
The STFT of the time discrete signal x(n) [18] is obtained by sliding the window function
w(m) over the signal x(n) and implementing the DFT on the product of x(n) and window at the current position,
𝑆𝑇𝐹𝑇(𝑛, 𝑘) = ∫ 𝑥(𝑛 + 𝑚). 𝑤(𝑚). exp (−𝑗2𝜋𝑘𝑚 𝑁 ) 𝑁 2−1 𝑚=−𝑁2 𝑑𝑡 = 𝐷𝐹𝑇[𝑟(𝑛 + 𝑚)𝑤(𝑚)] 5.4.2 Median Filtering
We utilize a one-dimensional median filter to improve the output extracted using the STFT algorithm. The basic principle of such a median filter is illustrated below. Given a discrete sequence {𝒙𝒊}, 𝟏 ≤ 𝒊 ≤ 𝑵, if the filtering window length employed is L (odd
number generally), the steps of computation for median filtering resulting in the mth
point 𝟏 ≤ 𝒎 ≤ 𝑵 in the sequence can be shown as follows,
1. L points are selected from the sequence with the mth point as its center;
2. The L points are arranged per the order from smallest to largest;
3. The center data point of the sequence after arrangement is chosen as the mth
19
6
METHOD
This section contains details of experiments conducted to analyze the performance of the two newly implemented algorithms, namely the SVD algorithm for the HumanFinder system and the STFT with median filtering algorithm for the CIP system (see section 5.2 and 5.4). Implementation of the algorithms has been done using MATLAB. Plots and figures are also included for better understanding of the implemented algorithms.
6.1 HumanFinder
For the HumanFinder the SVD algorithm was selected for implementation as it is a suitable tool to separate the clutter from the received signal. Tests were performed to analyze the performance of the implemented algorithm.
6.1.1 Experimental Setup
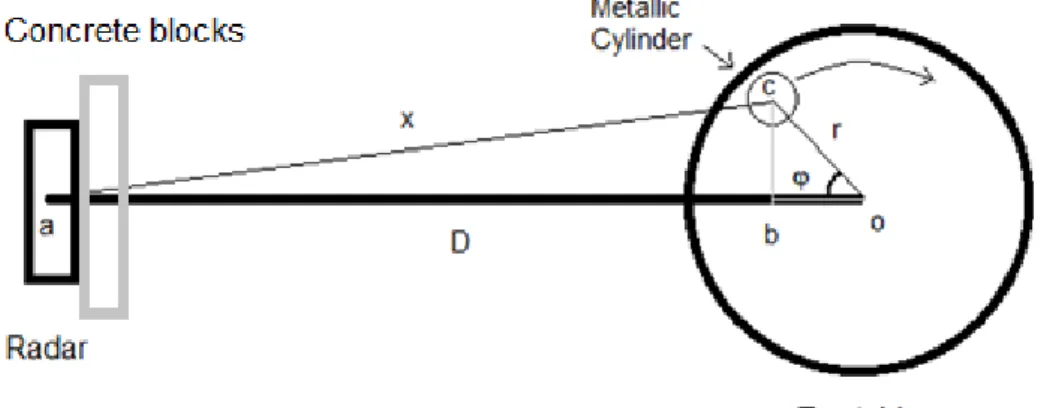
Experiments were carried out in which the radar was placed behind blocks of rectangular homogeneous concrete cinder blocks and a metallic cylinder (target) of 6.5 cm diameter and 11 cm height was placed on a moving turntable in front of the radar. The only variables in the different iterations of the tests are, distance of the turntable from the radar to measure distance estimation accuracy, the radius of revolution of the metal cylinder on the rotating turntable for small motion detection and the thickness of the concrete cinder blocks used between the radar and the target for measuring penetration capability.
Figure 11: Experimental setup model
6.1.2 Analysis of Received signals from hardware
On analysis, it is found that the raw received data is noisy and has imperfections. The signals have a DC component and this DC component varies for the successive frames of the raw data. Below is the plot of the raw signal from the hardware without any big obstacles in the path of the radar. The horizontal axis is time and the vertical axis represents the amplitude of the received signal. The sampling rate of 38Ghz gives us a
20
distance resolution of 0.4cm per sample and the 512 samples on the horizontal axis represent a total distance of approximately 2m. The frames of data from the multiple impulses are superimposed on the same plot. Ideally if the environment in front of the radar is static, all the impulses should be perfectly uniform and superimposed so that we see only one signal waveform in the plot. But we can see from the below plot that this is not the case. Here the target is a moving metallic cylinder on a turntable at 1m from the radar revolving with a radius of 10cm having closest approach at 90 cm and furthest at 110 cm approximately.
Figure 12: HumanFinder raw received signal
From the above plot we can see that there is an UWB impulse at the start of the signal even though there are no obstacles corresponding to that distance that will cause a reflection. This impulse is due to direct coupling between the transmitter and receiver which are placed close to each other in the hardware. The rest of the signal is a clutter which slowly diminishes in amplitude.
On detrending the signals in the individual frames, we get more uniform signals centered along the horizontal axis which enables us to focus on the useful fluctuations in the data. Below is the plot of the signal after detrending the received signal in order to get a more uniform signal.
Figure 13: HumanFinder-Detrended reflected signal
21 6.1.3 SVD Implementation
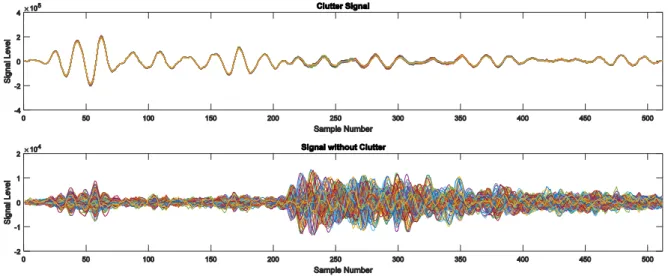
SVD was applied to the above signal matrix and it was separated into submatrices. Here are the submatrices which contain the cutter signal and the signal without clutter respectfully.
Figure 14: HumanFinder-Clutter Signal and Signal without clutter
(Target- Metallic cylinder on turntable placed 1 meter away with revolution radius of 10cm) On taking a contour plot of the signal without clutter which contains the information about the moving target. We can see that the peaks of the signal level over time in the consecultive frames correspond to the movement of the target.
Figure 15: HumanFinder- Contour plot of Signal without clutter
(Target- Metallic cylinder on turntable placed 1 meter away with revolution radius of 10cm) The sample number along the vertical axis corresponds to distance and the Frame number corresponds to time as we have a constant frame rate of 10 frames per second. Each sample in the vertical axis is equal to 0.4cm on distance and each frame number is equal to 0.1s in time. Each frame represents one tenths of a second. Extracting the estimated distance from the contour plot we can see that it is close to the true distance.
22
Figure 16: HumanFinder- Estimated Distance Vs True Distance
(Target- Metallic cylinder on turntable placed 1 meter away with revolution radius of 10cm)
6.2 CIP
For the CIP, the STFT algorithm with median filtering was chosen for implementation. Tests were performed to analyze the performance of the implemented algorithm.
6.2.1 Experimental Setup
The experimental setup is the same as the one used for the UWB radar. Radar data is collected for different setups like with the HumanFinder radar experiments.
23 6.2.2 Time domain analysis of received radar signal
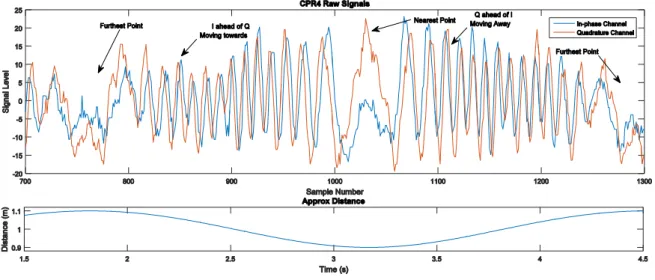
As the metal cylinder on the turntable rotates it moves closer and farther from the radar periodically. For the turntable placed at a distance 1m from the radar with the center of the cylinder placed 10 cm from the axis of rotation of the turntable the cylinder will have a closest approach at 90 cm and furthest at 110 cm approximately. From the received echo signal data from the CIP radar with include the two in-phase (I) and quadrature (Q) channels, we can see that the amplitude of the signals corresponds with the distance of the cylinder with stronger signal amplitude at the cylinder being at the nearest point and weaker for it being at the furthest point.
Figure 18: CIP-I/Q channel amplitude changing with distance
(Target- Metallic cylinder on turntable placed 1 meter away with revolution radius of 10cm) We can also see that the phase of the I and Q signal correspond to the direction of motion of the cylinder with respect to the radar. The phase of the I channel is ahead of the Q channel in the case when the cylinder is moving towards the radar and vice versa for the case in which it is moving away from the radar.
Figure 19: CIP-I/Q channel phase changing with direction
24 6.2.3 Phase extraction using STFT
Using the STFT algorithm we extract phase difference between the two signals over time. We can see that the sign of the phase clearly gives us the direction of motion of the target cylinder. Also, see that the algorithm does not give any good phase information around the points where the direction of the cylinder changes. This is because at these transition points the time domain signal has too low energy to extract any useful phase information. In such cases the algorithm sets the phase to zero.
Figure 20: CIP- phase and Direction estimation
(Target- Metallic cylinder on turntable placed 1 meter away with revolution radius of 10cm) As we know the distance is a linear function of the phase difference between the I and Q channels we can calculate the distance from their phase difference. The distance estimate from the phase does not seem to resemble the distance changes of the cylinder. But by taking a moving average over the distance estimate where the window size of the moving average is equal to the period of rotation of the cylinder we can see that the averaged distance estimate is very close to 1m which is the mean distance of the revolving cylinder.
Figure 21: CIP-Average Distance Estimate
25 6.3 Performance Measurements
Unfortunately, it is very difficult to compare the two systems even though they have the same application, they both work in very different ways. While for the HumanFinder it is easy to separate the signal from the noise to calculate the SNR, the same cannot be done with the CIP. For the HumanFinder the SNR is estimated by using the average signal energy within a fixed window over the noise part and the useful signal part (as shown in the Fig 22) of the signal which is obtained after removing the clutter using the SVD.
Figure 22: HumanFinder- SNR Estimation example
Similarly, for the CIP the SNR is calculated by using the average signal energy over a fixed window of the noise part and the useful signal part of the received signal. In the plot of the signal below, the environment was static and midway the turntable with the revolving metal cylinder was switched on.
26
Even though experiments were performed with a walking human they have only been used as a proof of concept and not for performance metric measurements. Comparing distance estimations using Humans in an objective way is difficult to accurately measure as human motion is not simple to define and impossible to exactly replicate. Hence for the distance estimate comparisons we use the turntable as it has a more well defined motion that can be easily replicated. The distance estimate is compared using the RMSE of the estimated distance with regards to the true distance of the moving target which in this case is a revolving metal cylinder on a turntable.
The formula used for calculating the RMSE is,
𝑅𝑀𝑆𝐸 = √∑ (𝑡𝑖− 𝑜𝑖) 2 𝑛
𝑖=1 𝑛
where 𝑡𝑖 is the ith true distance value in meters, 𝑜𝑖 is the ith observed distance value in
meters and n is the total number of sample values used. For the HumanFinder we use the actual distance as t and estimated distance as o (as seen in the Fig 16). However, for the CIP we use the averaged estimated distance as o and the averaged actual distance as t.
27
7
RESULTS
This section contains the results for the performance metrics obtained from the various tests performed with the two radar systems using the new implemented algorithms. Both the algorithms were tested under similar conditions and the data collected has been used to compare the two systems.
7.1 Small Motion Detection
Small Motion detection for the two systems was analyzed by conducting experiments with the rotating cylinder with varying radiuses. For this analysis, tests were done using the revolving metallic cylinder with varying radiuses of 12cm, 8cm, 4cm and 2cm at a distance of 1m away from the radar with a concrete cinder block of 7cm between the target and the radar. The target movement for these 4 cases will be 24cm, 16cm, 8cm and 8cm respectively. Detection is performed using the increase in energy of the signal when there is a motion with respect to the energy when there no motion (noise). Below is the plot with the SNR of the detected motions for the two systems.
Figure 24: Small Motion Detection- HumanFinder Vs CIP
(Target- Metallic cylinder on turntable placed 1m away with movements of 4cm, 8cm, 12cm, 24cm)
It can be clearly seen that both systems can detect small motions as small as 4cm. The detection is done by using a SNR threshold and as the SNRs of the radars is quite high, it is no problem to detect motion. The SNR of the detected motion using the CIP system is higher than the HumanFinder system for all four distances. This difference is probably due to the CIP being a more mature system in terms of development than the HumanFinder, being less noisy and having better sensitivity to motion.
28 7.2 Distance Estimation Accuracy
For this analysis, tests were done using the revolving metallic cylinder with a radius of 10cm placed at different distances of 1m, 2m and 3m away from the radar with a concrete cinder block of 7cm between the target and the radar. Distance is estimated for the target using both the systems for the 3 distances and the RMSE is calculated for the estimated distance. From the results, it is seen that the HumanFinder has lower RMSE for distance estimation compared to the CIP system.
Figure 25: Distance estimate comparison of HumanFinder and CIP
(Target- Metallic cylinder on turntable placed 1m,2m,3m meter away with revolution radius of 10cm)
The HumanFinder has a more accurate distance estimation capability than the CIP system.
29 7.3 Penetration Capability
For this analysis, tests were done using the revolving metallic cylinder with a radius of 10cm placed at a distance of 1m away from the radar with concrete cinder block of varying thickness between the target and the radar. The penetration capability of the two systems was estimated with respect to the varying thickness of the concrete cinder blocks. The results indicate that the SNR in dB of the CIP radar decreases linearly with increasing thickness. The penetration capability of the CIP is much higher than the HumanFinder. However, the HumanFinder’s SNR in dB does not decrease as steeply as the CIP radar, due to the lower operating frequency of the CIP radar. We cannot make good comparison from this plot as the two systems do not transmit with equal energy.
Figure 26: Penetration Capability- HumanFinder Vs CIP
(Target- Metallic cylinder on turntable placed 1m meter away with revolution radius of 10cm with concrete cinder blocks in-between of varying thickness)
The penetration capability of the CIP appears better than the HumanFinder. This is due to the CIP being a more mature system in terms of development than the HumanFinder and having better sensitivity to motion. The HumanFinder system suffers lesser attenuation for increase in thickness in comparison to the CIP system.
30
8
DISCUSSION AND ANALYSIS
After analyzing various experiments, the different types of target movements that we are interested in analyzing can be broadly classified into two groups.
Moving target: Here the entire target is moving over a certain distance. For example, a Human walking 3m away or towards the radar.
Near-stationery target: Here even though parts of the target are moving over small distances, the mean position of the target remains the same over time. For example, a human standing still in front of the radar and moving his hands back and forth.
8.1 Effect of SVD dimension size (N)
It was observed for the detected moving targets that smaller the SVD dimension size (N), the better is the distance estimation, with 2 which is the minimum possible SVD dimension size (N) being the best. This is because for moving objects there is sufficient differences in the received signals of two successive frames. However, for near-stationery objects the opposite is true. In the below contour plot (Fig. 27), the movement of the target is most clear at small values of N. In this experiment the target was slowly moving away from the radar.
31
In the below contour plot (Fig. 28), we measure a near-stationary target with the HumanFinder. Here we get better results using higher values of N.
Figure 28: Effect of SVD dimension size (N) for near-stationery target
8.2 Effect of STFT window size on distance estimation
The two major parameters of the CIP distance estimation algorithm are STFT window size and the FFT size. Data was collected from the CIP for a rotating cylinder at different radiuses of 15, 20 and 30 respectively. The period of rotation is the same, hence other than the distance moved, the rotating cylinders at different radiuses vary in speed where higher radius of rotation means faster speed. This can be observed in the histogram below of the frequency index of the strongest signal components that were used for distance estimation. The frequency index is proportional to the speed of the moving target.
32
The distance estimate algorithm was run for the same data at different STFT window sizes and two FFT sizes of 256 and 512 respectively and the results are presented below (Fig 31). The algorithm gives a distance estimation for each sample of input data for which motion was detected, here it is represented on the vertical axis of the top two plots in the below figure. It is better to have more distance estimations as the cylinder is target is moving continuously. The accuracy here is the fraction of these distance points that are within 50 cm of the true mean distance.
Figure 30: Effect of STFT window size for near-stationery moving targets of different speeds
It was observed that the most significant parameter is the STFT window size. For faster targets, smaller STFT windows give best results and vice versa for slower targets. It is also seen that for fast motions, smaller FFT is sufficient and there is no significant benefit in increasing the FFT size. However, for slower motions a bigger FFT size is beneficial.
33 8.3 Small Motion Distance Estimation
Small Motion distance estimation for the two systems was analyzed by conducting experiments with the rotating cylinder with varying radiuses. For this analysis, tests were done using the revolving metallic cylinder with varying radiuses of 12cm, 8cm and 4cm at a distance of 1m away from the radar with a concrete cinder block of 7cm between the target and the radar. In Fig 31 we have taken the absolute mean value of the HumanFinder signal without clutter over time. Here we can see that there are two distinct pulses that stand out and these approximately correspond to the nearest and farthest point of the target from the radar as it is at these points the targets is the slowest. In Fig 32 the spread of histogram of the distance estimate is shown. For smaller radiuses, the spread of the distance estimate signal is expected to be narrower.
Figure 31: Mean Signal without clutter for HumanFinder system
Figure 32: Histogram of the Distance estimate for the CIP radar
Both systems can detect small motions. The distance estimate of the HumanFinder system is much better than the CIP system for small motions. In the HumanFinder we can get the distance directly from the detection, however in the CIP the distance is recovered indirectly from the phase difference of the two signals.
34 8.4 Practical tests with walking human
Practical tests were performed using the implemented algorithms for a walking human as a proof of concept. Both systems show encouraging results.
HumanFinder
Here we have the distance estimation using the SVD algorithm and the HumanFinder radar in which the target human is slowly walking away from the radar behind a concrete brick wall of 30cm thickness.
Figure 33: HumanFinder- Tracking of walking human
In the above plot the vertical axis is the sample number of the signal in a single frame and its corresponds to distance with 512 samples approximately equal to 2 m for the sampling rate of 38Ghz. While the Frame number corresponds to time with 10 frames equal to one second.
CIP
The new implemented algorithms using the STFT and median filtering show promising results with the CIP radar for practical test for tracking walking human. Here we have tracked a human walking in two different patterns. In the first pattern (fig 34) the human walks continuously at a normal pace without stopping from zero meters to 8m away from the radar, stops turns around, waits still for a few seconds, and walks back with the same pace back to zero meters. In the second pattern (fig 35) the human walks the same as the first pattern along with stopping and holding still for a few seconds every 1m.
35
Figure 34: CIP tracking walking human pattern-1
36
9
CONCLUSION
In this thesis, two new algorithms, namely, the SVD algorithm for the HumanFinder UWB impulse radar system and the STFT median filter algorithm for the CIP dual frequency continuous wave radar system were analyzed and implemented. The effect of the algorithm parameters on their performance was analyzed. The performance of the implemented algorithms with regards to small motion detection, distance estimation and penetration capability was analyzed. Both systems are capable of easily detecting small motions as small as 4cm with good accuracy. The HumanFinder system has better distance estimation than the CIP system. The HumanFinder system suffers lesser attenuation for increases in thickness of concrete cinder blocks in comparison to the CIP system. Practical tests were performed for a walking human target and both implemented algorithms showed promising results. Both systems are certainly capable of human detection and tracking. However, the systems still need more analysis and improvements before they are ready for practical applications.
37
10
REFERENCES
[1] S. Gauthier and W. Chamma, “Through-The-Wall Surveillance,” Technical Memorandum DRDC, Ottawa, Oct. 2002.
[2] Skolnik, Merrill. Radar Handbook, Third Edition. United States of America: McGraw-Hill, 2008.
[3] J.D. Taylor, Introduction to Ultra-Wideband Radar Systems, CRC press, 1995. [4] J.D. Taylor, Ultra-wideband Radar Technology, CRC press, 2001.
[5] D. G. C. LUCK, Frequency Modulated Radar, 1949, McGraw-Hill.
[6] W. R. Faris, “Diplexed multi-frequency CW Doppler radar”, U.S. Patent 3750171, 1973
[7] C. P. Tresselt, “Range cutoff system for dual frequency CW radar”, U.S. Patent 3766554, 1973
[8] M. Amin, P. Zemany, P. Setlur, F. Ahmad, “Moving Target Localization for Indoor Imaging using Dual Frequency CW Radars”, Proc. The Fourth IEEE Workshop on Sensor Array and Multi-Channel Processing (SAM’2006), Waltham, MA, July 2006, pp.367-371 [9] F. Ahmad, M. G. Amin, P. Setlur, “Through-the-Wall Target Localization Using Dual-Frequency CW Radars”, Proc. SPIE Conference on Sensors, and Command, Control, Communications, and Intelligence (C3I) Technologies for Homeland Security and Homeland Defense V, Orlando, FL, April 2006, Vol.6201, 62010H
[19] Y. Zhang, M. G. Amin, F. Ahmad, “A Novel Approach for Mulitple Moving Target Localization Using Dual-Frequency Radars and Time-Frequency Distributions”, Proc. 41st Annual Asilomar Conference on Signals, Systems, and Computers, Pacific Grove, CA, November 2007, pp. 1817-1821
[11] C. Zhengyu, C. Wenwu and C. Rushan, "FM interference suppression for PRC-CW radar based on STFT and median filtering," 2010 International Conference on Microwave and Millimeter Wave Technology, Chengdu, 2010, pp. 1610-161
[12] D. D. Ferris Jr, N. C. Currie, “A survey of current technologies for through-the-wall surveillance”, Proc. SPIE Conference on Sensors, C3I, Information, and Training
Technologies for Law Enforcement, Boston, Massachusetts, November 1998, Vol.3577 [13] Wu Zhenzhi Signal Processing Algorithms for CIP Dual Frequency CW Radar 2013 (Cinside internal document)
[14] Wu Zhenzhi Signal Processing for Close Perimeter Protection using Ultra Wide Band Radar 2013 (Cinside internal document)
[15] Yinan Yu et al. A Compact UWB Indoor and Through-Wall Radar with Precise Ranging and Tracking 2012
[16] Xiaoyang Li et al. Sense-through-wall human detection using the UWB radar with sparse SVD 2013
[17] Ashith Kumar et al. Experimental study of through-wall human detection using ultra wideband radar sensors 2013
[18] P. K. Verma, A. N. Gaikwad, D. Singh, and M. J. Nigam, "Analysis of clutter reduction techniques for through wall imaging in UWB range," Progress In Electromagnetics Research B, Vol. 17, 29-48, 2009.
[19] D. R. Wehner, High Resolution Radar. Boston, MA: Artech House, 1994.
38
[21] Adrian POPA, "An Optimization of Gaussian UWB Pulses", 10th International Conference on DEVELOPMENT AND APPLICATION SYSTEMS, Suceava, Romania, May 27-29, 2010
[22] D. Kn Hongsan Sheng, Philip Orlik, Alexander M. Haimovich, "On the Spectral and Power Requirements for Ultra-Wideband Transmission "
[23]. Abujarad, F., A. Jostingmeier, and A. S. Omar, \Clutter removal for landmine using different signal processing techniques,"Proceedings of the Tenth IEEE International Conference on Ground Penetrating Radar, GPR 2004, 697{700, Jun. 2004.
[24]. Wall, M. E., A. Rechtsteiner, and L. M. Rocha, \Singular value decomposition and principal component analysis," A Practical Approach to Microarray Data Analysis, Chapter 5, 91{109, Boston, MA, USA, 2003.