Postal Address: Visiting Address: Telephone:
Optimization of the Internal Logistics
Served by an AGV System
A case study at Kinnarps Production AB
Grigor Mishev
Omid Shahidi
THESIS WORK 2008
Optimization of the Internal Logistics
Served by an AGV System
A case study at Kinnarps Production AB
Grigor Mishev
Omid Shahidi
This thesis work is performed at Jönköping Institute of Technology within the
subject area of Industrial Engineering and Management. The work is part of
the university’s two-year master’s degree. The authors are responsible for the
given opinions, conclusions and results.
Supervisor: Mikael Thulin
Points: 30 points (D-level)
Datum: 2008-05-28
Archive number:
Logistics plays a crucial role in companies’ ability to sustain competitive on the market. Time is regarded as one of the important metric in terms of logistics, since time influences the lead time of the products, which results in the vital advantage of speed. The recent business environment forces Kinnarps Production AB, a manufacturer of furniture, to optimize their inventory material flow in a way of increasing their capability and capacity to load more distribution containers with goods daily. The present circumstances of the material flow are associated with number of negative factors. An automated guided vehicle (AGV) system is operating and handling the distribution of goods. Wrong sequence of activities, long transportations, high transportation delays, waiting time, varying numbers of AGVs, wastes, bottlenecks are among the important issues to be considered.
The purpose of this thesis is to analyze the material flow in Kinnarps Production AB’s inventory seven and to improve the AGV system activities within.
Concepts associated with identifying waste were used by separating value-adding activities from the non-value added ones. The usage of ideal reference systems techniques were the base for identifying problems. Concrete literature regarding AGV’s design system was applied in establishing different statements about the material flow and identification of problems. Different methods and techniques were used in approaching the research, but most above others is the case study approach. Numerous amounts of secondary data have been employed in verifying the collection of other data carried out by primary data collection as well as verifying the qualitative and quantitative analysis.
A mapping of the current system was established with respect to orders, times and distances. Numbers of congestion points were identified, non-value adding activities were eliminated or decreased, rearrangement of sequencing of different activities was considered and different pallets arrangement system was established. A stochastic model was used in identifying the AGV’s time variables in the system and estimating appropriate amount of AGVs within the inventory.
All the findings from different calculations and estimations were associated with Kinnarps Production’s future increased demand. Different issues and considerations were analyzed and appropriate suggestions were given for elimination of the negative factors in the inventory or their decrease. Among the most influencing results was the proper amount of AGVs in the inventory area, pallets rearrangement, different stocking policy, rearrangement in the sequence of activities, increase of the buffer for pallets used for loading containers, new conveyor system for the incoming goods in the inventory, transportation layout changes resulting in blocking free routines, separate control system, decrease of the effect of stoppages. All these findings are considered to optimize the material flow and increase the system capacity contributing to an increase of the daily containers outgoing from Kinnarps Production AB.
Keywords: AGV system, Improvement, Lean Principles, Logistics, Material flow, Material
This thesis of 30 points is a concluding part of a master program in Industrial Engineering and Management, which was carried out in Kinnarps Production AB. The project was carried out in the field of Logistics and gave the authors of this thesis a good picture of the processes in the field and Kinnarps as a company.
We would like to express our deep gratitude to Kinnarps Production AB and all the people being involved in our research. The warmth and interest about our research from Kinnarps Production’s side gave us a confidence and stimulation in our work. The devotion and the response from the people being involved in the processes we investigated helped us in carrying out our work in a good structured manner, with a clear picture about the field of research. We would like to express our gratitude to Leif Ericson providing us the possibility to carry out this research. We would like deeply to greet Johan Hassel who was our supervisor in the company, for his guidance and valuable help. The outcome of this research wouldn’t be possible without the deep support of Kinnarps Production AB.
We would like to acknowledge Mikael Thulin, our supervisor in Jönköping University, for his guidance and help during our work. The discussions and advices given by him helped us in carrying out this research. We are also grateful to the department of Industrial Engineering and Management at Jönköping University for helping us.
Jönköping may 2008
• AGV Automated Guided Vehicle
• A, B, C and D Classification of pallet places according to their dimensions • O Places for oversized products
• P Loading places • LF Loading gate • E Empty pallets places
• R, L Right and left position at the loading gate • PL Automatic storage place
• 20-30 Numeration of the available lines among the rack system • L27 Inventory place at line 27
Table of Content
1
Introduction ... 1
1.1 BACKGROUND PROBLEM... 2
1.2 PURPOSE AND GOALS... 3
1.3 LIMITATIONS... 4 1.4 OUTLINE... 4
2
Theoretical background ... 5
2.1 LOGISTICS FLEXIBILITY... 5 2.2 MATERIAL FLOW... 6 2.3 MATERIAL HANDLING... 72.4 LEAN THINKING AND CONCEPTS... 8
2.4.1 Waste Categories ... 8
2.5 PROCESS ANALYSIS AND MAPPING... 9
2.5.1 Mapping guidelines and tools... 11
2.6 AGV SYSTEM... 15
2.6.1 AGV design systems... 16
2.6.2 Methods for estimating the required number of AGVS ... 18
2.6.3 Simulation versus Analysis ... 20
3
Methodology... 21
3.1 RESEARCH PROCESS... 21
3.2 CASE STUDY... 22
3.2.1 Explanatory (analytical) survey... 23
3.2.2 Longitudinal studies (cohort/panel studies)... 23
3.3 DATA ANALYSIS... 24
3.3.1 Qualitative and quantitative analysis ... 25
3.3.2 Primary data... 26
3.3.3 Secondary data ... 29
3.4 TRIANGULATION... 29
3.5 VALIDITY AND RELIABILITY... 30
4
Results... 31
4.1 CURRENT STATE OF THE INVENTORY... 31
4.1.1 Transportation activities... 31
4.1.2 Pallets and rack system ... 33
4.1.3 Loading area... 34
4.1.4 Empty pallets area ... 36
4.1.5 Goods arriving in the inventory... 36
4.1.6 Distribution of goods from inventory 7 to the loading area ... 37
4.1.7 Stocking policy... 37
4.1.8 AGV routing, lines and transportation control ... 38
4.1.9 Planning ... 40
4.1.10 Stoppages and Errors ... 40
4.1.11 Process mapping activity ... 41
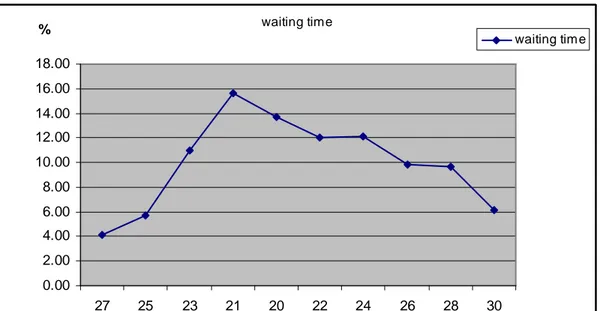
4.1.12 Waiting time and transportation delay ... 42
4.2 COMPARISON BETWEEN THE PRESENT AND PAST STATE OF THE INVENTORY... 44
5.1.2 Loading area... 52
5.1.3 Empty pallets area ... 53
5.1.4 Goods arriving in the inventory... 53
5.1.5 Distribution of goods from inventory 7 to the loading area ... 53
5.1.6 Stocking policy... 54
5.1.7 AGV routing, lines and transportation control ... 54
5.1.8 Future state demands... 58
5.1.9 Process mapping activity ... 60
6
Analysis ... 62
6.1 TRANSPORTATIONS AND DISTRIBUTION OF GOODS... 62
6.2 PALLETS AND RACK SYSTEM... 64
6.3 TRANSPORTATION LAYOUT... 65
6.3.1 Transportation control and routing ... 66
6.3.2 Number of AGVs ... 67
6.4 LOADING AREA... 69
6.5 EMPTY PALLETS AREA... 72
6.6 STOCKING POLICY... 72
6.6.1 Stoppages and Errors ... 75
6.7 PROCESS MAPPING ACTIVITY, TRANSPORTATION DELAY AND WAITING TIME... 76
7
Conclusions ... 83
7.1 DISCUSSION... 84
7.2 FUTURE RESEARCH... 84
7.3 CRITICISM OF THE THESIS... 84
8
References ... 86
List of Figures
FIGURE 2-1.EVALUATION METHODOLOGY AIMING TO IMPROVEMENTS IN THE MATERIAL FLOW (JOHANSSON
AND ÖJMERTZ,1996) ... 13
FIGURE 2-2.PROCEDURE FOR EVALUATING THE MATERIALS FLOW EFFICIENCY OF A STUDIED SYSTEM WITH RESPECT TO A REFERENCE ONE,(ÖJMERTZ,1998). ... 14
FIGURE 2-3.FACTORS INFLUENCING THE REQUIRED NUMBER OF AGVS (MANTEL AND LANDEWEERD (1995); UJVARI AND HILMOLA,(2006)). ... 16
FIGURE 2-4.PART WAITING TIME AND VEHICLE TRAVEL TIME,(KOO,JANG AND SUH,2005). ... 18
FIGURE 2-5.FLEET SIZING ESTIMATION PROCEDURE,(KOO,JANG AND SUH,2005). ... 19
FIGURE 4-1.LAYOUT OF INVENTORY 7 ... 32
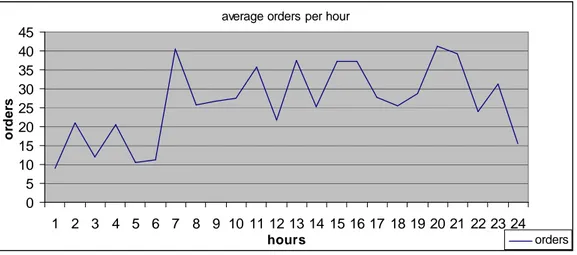
FIGURE 4-2.AVERAGE ORDERS PER HOUR FROM THE LOADING AREA... 37
FIGURE 4-3.A MATERIAL FLOW MAP BETWEEN STATIONS, WITH RESPECT TO TRANSPORTATION ACTIVITIES CARRIED OUT BY THE AGV SYSTEM... 41
FIGURE 4-4.PERCENTAGE OF THE WAITING TIME OF ORDERS IN THE RACK SYSTEM CORRESPONDING TO THE LINES WITHIN IT... 42
FIGURE 4-5.AVERAGE WAITING TIME PER ORDER... 43
FIGURE 4-6.COMPARISON OF VARIABLES FROM THE PAST AND PRESENT SYSTEM... 45
FIGURE 4-7.IMPROVEMENTS RANGE OF THE VARIABLES, IN TERMS OF HIGHER ORDER OUTPUT... 45
FIGURE 4-8.CONNECTION OF THE WAITING TIME ERRORS WITH RESPECT TO AREA IN THE INVENTORY... 46
FIGURE 4-9.CONNECTION OF THE BUMPER ERRORS WITH RESPECT TO AREA IN THE INVENTORY... 47
FIGURE 5-1.CAUSE AND EFFECT DIAGRAM FOR KINNARPS’ INVENTORY... 48
FIGURE 5-2.FUTURE STATE LAYOUT OF KINNARPS’ INVENTORY... 50
FIGURE 5-3.AVERAGE ORDERS PER HOUR FROM THE RACK SYSTEM TO THE LOADING AREA, FUTURE DEMAND ... 59
FIGURE 5-4.A MATERIAL FLOW MAP BETWEEN STATIONS, WITH RESPECT TO TRANSPORTATION ACTIVITIES CARRIED OUT BY THE AGV SYSTEM IN THE FUTURE STATE MODEL... 61
FIGURE 6-1.COMPARISON OF VARIABLES FROM THE PRESENT AND THE PAST STATE, WHEN THE EMPTY PALLETS ARE NOT SERVED BY THE AGV SYSTEM... 70
FIGURE 6-2.IMPROVEMENTS RANGE OF THE VARIABLES, IN TERM OF HIGHER OUTPUT ORDER, WHEN THE EMPTY PALLETS ARE REMOVED BY THE AGV SYSTEM IN COMPARISON TO 2007 ... 71
FIGURE 6-3.IMPROVEMENTS RANGE OF VARIABLES, IN TERMS OF HIGHER OUTPUT ORDER, WHEN THE EMPTY PALLETS ARE REMOVED BY THE AGV SYSTEM (2008) ... 71
List of Tables
TABLE 4-1.AVAILABLE PLACES WITHIN THE INVENTORY ACCORDING TO THEIR CLASSIFICATION... 33
TABLE 4-2.AVAILABLE PLACES FOR LOADING AT THE CORRESPONDING GATES FOR LOADING... 34
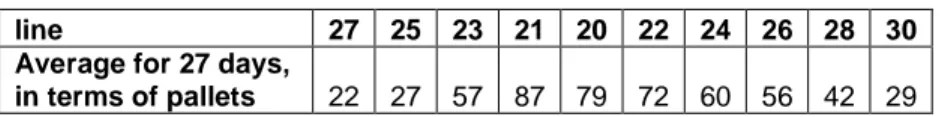
TABLE 4-3.AVERAGE PALLETS ORDERS FROM THE DIFFERENT LINES IN THE RACK SYSTEM... 38
TABLE 4-4.AVERAGE DELAY TIME IN ACCORDANCE TO THE POSITIONS IN THE INVENTORY... 44
TABLE 5-1.PALLET PLACES AVAILABLE IN THE NEW SYSTEM... 52
TABLE 5-2.NUMBER OF LOADING PLACES WITH RESPECT TO DIFFERENT LOADING GATES AND POSSIBLE ALTERNATIVE METHODS FOR RETRIEVING EMPTY PALLETS... 53
TABLE 5-3.AVERAGE OVERALL NUMBER OF ORDERS FROM THE INVENTORY SPREAD AMONG THE RACK SYSTEM... 54
TABLE 6-1.AVERAGE TIME NECESSARY FOR DELIVERING GOODS FROM THE DIFFERENT LINES IN THE RACK SYSTEM TO THE LOADING AREA... 73
TABLE 6-2.AVERAGE TIME NECESSARY FOR DELIVERING GOODS FROM THE DISTRIBUTION CONVEYORS TO THE DIFFERENT LINES IN THE RACK SYSTEM... 74
TABLE 6-3.AVERAGE TIME NECESSARY FOR A MATERIAL HANDLING ACTIVITY RESPECTFULLY BOTH TO THE RACK SYSTEM AND THE LOADING AREA. ... 74
1
Introduction
This chapter defines a background description in the area of the research, Kinnarps Production AB and its problem area and the purpose and goal of this thesis.
Logistics is regarded as the process that combines all the activities that are associated with the movement and positioning of the inventory to fulfill the customer requirements (Bowersox, 1999). Logistic includes plenty of functions among which the transportation, warehousing, and inventory management are considered important. The definitions of logistics involve the management of the inventory, with respect to materials and information (Goldsby, 2005; Harrison, 2002). Today companies are facing a severe competition in the recent global market and this is expressed in shorter product life cycle, increased expectations of the customers, service level, customized products and various services (Simchi-Levi, 2003).
From the market value perspective the logistic effectiveness is measured by the customer satisfaction. The successful evaluation of the logistics is measured by the service performance goals with respect to on-time deliveries, availability and accessibility of the delivery (Bowersox, 1999). In today’s market, which is becoming more customer-driven the measure of the customer satisfaction is more orienting towards the impression of the external services and the customer value (Simchi-Levi, 2003).
Logistics is mainly oriented in managing inventories and the point where the products are sold, by having the right inventory with the right amount of goods results in satisfying the final customers (Goldsby, 2005).The external measurements of a successful logistical integration are significantly related to the internal integration of the processes (Bowersox, 1999), by that it is significant to integrate the operations that are associated with reduction of duplication, waste and redundancy.
According to Goldsby (2005) transportation is an important aspect of activities in the logistics with respect to fast and efficient transportations. Big consideration is emphasized on the time the goods spend in transition stage. Time plays an important issue in logistics which is a subject to the lead time of the deliveries of goods. The management of the materials is carried out by the inbound and outbound logistics, where the inbound logistics deals with the deliveries materials necessary for the production and the outbound logistics is managing with the physical distribution of finished goods (Harrison, 2002).
The material flow is an essential part of the logistics and it tracks the flow from the source to the end customer (Harrison, 2002). According to Wagner (2006) material flow management corresponds to the analysis and the optimization of materials of products and services, where the internal flow of material refers to the flow of materials within an organization. All the negative aspects within the material flow result in building up inventories and slow response to the customers (Harrison, 2002).
Material handling activities are important aspect of the logistics and play a major role (Coyle et al., 1996). The material handling activities should be looked upon as value-adding activities, but deeper analysis of the material flow presents the non-value added ones within the overall flow (Öjmertz, 1998; Liker, 2004). Material handling corresponds to the context of transportation. All the factors within this activity should be considered and investigate those parts associated with wasted time and transportations. Optimizing the motions and activities in a way of achieving optimal value-adding activity is ultimate goal (Shingo, 1981).
Important category according to Tompkins (1991) in the material handling methods is the consideration of the material handling equipment in a way of optimizing and utilizing the automated guided vehicles (AGV) in achieving smoother flow in the material handling. In order to improve the effectiveness of the material handling in more value-adding manner there is a need for analysis which can present the understanding of the materials handling contribution to the value-adding aspect of the material flow. Activity analysis has been considered as important for understanding the non-value activities that create unnecessary time, considered as waste (Shingo, 1981; Monden, 1998).
The design of an AGV transportation system is regarded as a complex one, since it involves many parameters influencing the material flow and handling activities. By effective analysis and optimization techniques, which considers all the variables affecting the flow a fast smooth undisturbed flow, able to serve the needed demand of orders, can be established (Koo, Jang and Suh, 2005; Ujvari and Hilmola, 2006).
1.1
Background Problem
This thesis work is carried out by two students from Jönköping University in the field of production development and management. The thesis is a master level work and is an examination for completing the program of Industrial Engineering and Management.
The project is carried out in accordance with Kinnarps Production AB, which is an office furniture manufacturer. The company has its market mainly in Europe and is considered to be the third furniture manufacturer in Europe. There are three factories that are fulfilling the production demand of the company located in Sweden; Kinnarp, Skillingaryd and Jönköping. Continual improvement of our production processes is one of the main foundations of the company’s strategy. Speeding up the production and shortening delivery lead times is not the only issue Kinnarps in aiming for, but also to improve the quality of the products. The investigated manufacturing plant that is accounted in this work is situated in Kinnarp.
The recent business environment demands an increase of the company’s capabilities and capacity. There is an increase of the orders and the products needed to be produced, due to the increase of sales and the desire of the company to reach higher goals in a long run being able to sustain competitive in the ever changing market. All the stated issues are driving Kinnarps Production AB to look after constant improvements. The distribution centre for goods within the territory of Sweden and other neighboring countries in Europe is located in inventory 7, which serves as an inventory and as a loading area.
The focus of this work is oriented in analyzing and investigating the flow of goods within inventory 7. The current condition of the inventory measures that the number of containers loaded daily is less than it is expected to be and due to the constant increase in sales there is a necessity for improvements. The improvements are aiming to increase the loading capabilities in inventory 7 by speeding the material flow.
In order to analyze the flow of materials within the inventory 7 and the dispatching area there are several aspects regarded to be important for the current condition of the area. They can be listed as follows:
• The AGV system, which is the only material handling tool used for making deliveries of materials and goods where they are necessary. The AGV’s system capacity, speed and the time during which they are not bringing any value for the company due to number of factors is a subject of analysis. These factors are associated with different breakdowns, unnecessary movements and waiting time;
• The pallets being used for distributing and storing goods within the factory. The variance of the pallets that are used and their utilization with respect to the number of stored goods on them. The improper utilization of the pallets increases the number of necessary transportations of goods;
• The inventory itself, in accordance to its layout and the material distribution. The material distribution can be considered with respect to the way the goods are delivered and stored within the inventory, and the paths on which the AGVs are making all the necessary deliveries;
• The planning of the orders in the production and the difficulties arising from the long term planning with respect to matching of the order’s batches in the inventory 7. That results in the inability to have smooth planning abilities in loading the containers.
1.2
Purpose and goals
The main purpose of this thesis is to analyze the material flow in Kinnarps Production AB’s inventory 7 and to improve the AGV system activities within. This analysis will be carried out by considering all the negative factors that are influencing the flow, which results in the slow distribution of the goods.
The main goal for this thesis is to identify the negative factors that are preventing the ability to load distribution containers at the desirable level the company is aiming for, and propose solutions for their reduction or elimination. In order to fulfill this goal number of areas will be investigated:
• Mapping the current physical transportation of finished goods within the investigated inventory 7;
• Investigating the material flow with respect to times, number of transportations, the timing of goods being delivered, the number of automated guided vehicles being involved in the process (AGVs), which perform all the transportation of goods;
• Presenting the negative factors that are preventing the proper flow within the inventory;
• Proposing solutions and suggestions aiming to improving the present state by eliminating and decreasing all the impediments of the material flow.
The follow-up of all the steps being identified is fulfilling the attempt to create a holistic view of the inventory and the physical distribution of goods. According to the picture being created there is a convenient possibility to identify all the draw backs in the system. And by that mean managing to give an opportunity for improvements and suitable solutions that will reach the goal of the thesis.
1.3
Limitations
This thesis work will be narrowed in a way that some of the problem areas that have been identified will not be considered. The pallets will be investigated with respect to their type and position in inventory 7. The planning will not be investigated and taken into consideration in a way how it influences the distribution of materials.
The data generation during that research will cover certain periods of time in achieving the necessary picture. By sampling the data hourly during a day, some of the variables would not be registered as they are excluded, but affecting the system conditions in the sample. In this way certain connections between the variables would be lost and presumably certain data will not be used.
The suggested improvements will not be considered from a financial perspective and the eventual cost associated with their implementation. All the suggestions and proposals are conceptual and arise from the analysis and their suitability in achieving the overall goal.
1.4
Outline
This thesis is consisted of six main chapters. In their sequential order there is a theoretical part, which refers to the area of this research and presents techniques and tools for understanding and analyzing the topic. The methodology part includes the methods according to which the research has been carried out, as well as the different techniques for data collection being used. The result section presents the findings of the investigation with respect to mapping of the current system conditions. The future state system suggestion model presents the conceptual ideas and suggestions for improvements being given. The analytical section is aiming to analyze the findings from the current system and discusses the implementation of the new suggestions being given. Special emphasize has been given on the effect of the outcome from the suggestions being given. The concluding part section of the thesis is aiming to point out the importance of the findings in the research being carried out. It points out the contribution of the suggestions being given, suggestions for future research and critics associated with the work done.
2
Theoretical background
This chapter includes theoretical background referring to the research, logistic concepts, AGVs design systems, analyzing techniques and tools according to which the investigation proceeds.
2.1
Logistics flexibility
Logistics is oriented in managing inventory, as companies are aiming to selling goods and respectfully possessing products to fulfill this demand. Often it is emphasized on the importance of logistics as the ability to deliver the right products on the right place at the right needed time and the right amount needed for the right cost (Goldsby, 2005).
According to Zhang (2005) and Harrison (2002) for an enterprise to stay strongly competitive and to succeed in an uncertain environment, firms must respond to changing customer needs.
Because flexibility is multidimensional, complex and hard-to-capture concept, confusion and uncertainty are inhibited in an effective implementation (Sethi, 1990; Upton, 1995). The distinctions between internal competences that the organisations control but customers cannot see, and external competences that customers in other hand see and value are often unclear and makes the understanding of logistic flexibility difficult (Cunningham, 1996). The physical distribution flexibility is a capability that the customers value, because they see and feel the direct impact. On the other hand the physical supply flexibility is not visible to the customers since it is buffered within the company’s inventory and production process.
According to van Hoek (2001) logistic flexibility enables a higher customer service by synchronizing the delivery of the finished goods with customer demands. This is accomplished by accurate planning and controlling the flow of the goods and the related information. By eliminating non-added-value activities and reducing response time enhancement it is possible to achieve the company’s ability to respond to market‘s changes (Fung, 1998).
According to Day (1994) logistic flexibility can be divided into four components: physical supply flexibility, purchasing flexibility, physical flexibility and demand flexibility. When talking about physical distribution flexibility it should be emphasized on the firm’s ability to adjust the inventory, warehousing, packaging and transportation of physical products in order to meet customer needs at the right time and in the correct quantity (Zhang, 2002). It involves material and information handling as well as requires quickness in activities such as packaging, warehousing and outgoing transportation. These capabilities are very important since they impact the customer directly through delivery and speed, also they are visible to customers and they experience firstly the performance of the distribution system.
Improving customer services and satisfaction depends on both efficient material handling and fast information processing. The physical logistics flows are part of converting materials quickly to products, therefore creates value for customers. The logistics information system converts data into information so important decision can be made hence strengthen the effectiveness, efficiency and flexibility (Damen, 2001).
2.2
Material flow
Material flow is the term that describes the physical flow of materials and its path. It is a general term that refers to the process of the activities in terms of equipment, labor, different methods and equipments possessing the purpose of fulfilling specific objectives on a certain part of the flow of materials (Harrison, 2002).
Material flow within the logistic area is the physical movement of materials from sources to the final destination points as parts are important to be moved as quickly as possible from one place to another. The synchronization of the movements and their coordination results in an undisturbed flow and preventing the building up of unnecessary inventories and bottlenecks (Harrison, 2002).
The material flow is usually consisted of activities associated with material handling reaching the final customer and transportation needed in order to reach the orders placed. If the system is ideal there would be activities only regarded as perfect. Material handling and transportation are those activities that are connecting different parts of the supply chain, and these activities are commonly performed in indirect time periods, since the goods are placed in storages and buffers (Öjmertz, 1998b).
As the manufacturing companies are growing in size and complexity the material flow control have become an important issue for the system efficiency and manufacturing output (Koo, Jang and Suh, 2005). The main objective when dealing with material flow is to provide an improved understanding of the purpose of the material handling and at the same time ensure principles and certain procedures in utilizing the knowledge and evaluating and improving the performance with respect to efficiency and manufacturing output (Bowersox, 1999; Harrison, 2002).
Identifying the value and the stream of goods is followed by the focus on design, the orders and products and tracking the goods from the start point to the destination when the tasks are completed. The next step is to go beyond the traditional boundaries of jobs, careers and functions in order to create a flow by removing all the impediments. The last step is the evaluation of the work practices and tools to eliminate backflows, scrap and stoppages of any sort which prevents the stable and continuous flow (Harrison, 2002; Sekine, 1992).
Essential part of the supply chain is the physical flow, which includes all material handling activities, taking place at different areas in the system. A physical flow characterized as one that has short throughput times, low resource consumption and safe goods is necessary in achieving an efficient supply chain. The physical flow in a company must be designed in a manner in which constitutes a base of efficiency and effectiveness. There is a connection between the efficiency of one system and its effectiveness, since the first corresponds to the consumption of resources needed and the effectiveness is referring to the utility and the benefit the user is receiving from the product and the system itself (Öjmertz and Johansson, 1997).
2.3
Material handling
Material handling term refers to the movements associated with the manipulation of the materials within a facility. The material handling is the system that combines the methods, facilities, labor and the equipment for the movement and storing of materials in order to meet certain objectives (Harrison, 2002).
The material handling is considered as the inclusive in the internal transportations, storage and the manufacturing, and material handling activities are stated as part of the material flow (Öjmertz, 1998). Material handling plays a crucial role in warehousing since the labor and the investments in the necessary equipment is reflecting in the overall logistics costs (Bowersox, 1999; Arifin and Egbelu, 2000).
Authors classify that material handling should be minimized (Bowersox, 1999; Coyle et al., 1996), and according to others it is regarded as a waste and it shouldn’t exist. In the cases when it is impossible to eliminate all the material handling activities the efficiency of the tasks within the material handling can be improved. If it is understood why the material handling activities are performed it is possible to focus the attention in eliminating of these activities or defining the necessary requirements. According to Coyle et al. (1996) there is a system principle where there are integrated as many handling activities as the outcome of a practical nature is in a coordinated system. That is further developed in a material flow principle in providing a sequence and a layout of the equipment that optimizes the material flow and at the same time simplifying the handling by reducing, eliminating or at the end combining certain unnecessary movements or equipment. Material handling can be divided into general work simplification check where the steps are included in a way of:
• Eliminating operations by considering them as necessary or potential candidates for elimination;
• The ability for combining different operations;
• At the same time the sequence and the ability for rearranging the place and the people, in a way of changing or rearranging;
• Improving the details in a way of changing the method or the equipment to be improved.
All the activities associated with creation, ordering and good services can be created as a flow, and lining up of all the essential steps needed to accomplish the needed tasks in an uniform continuous flow, with no wasted motions and interruptions or queues is reflecting in an value-adding flow of goods (Womack, 1996).
The evaluation of the material handling activities is important in understanding the physical flow and this includes the design of the activities and the handling equipment, which results in the efficiency of the system. Material handling can add value to the activities with respect to positioning, orienting and sequencing the orders. In order to affect the improvement of the effectiveness in the material handling the proper execution of the activities is important in accomplishing their tasks in a manner that fulfills the required functions in the chain. In other words it is the execution of the material handling activities by contributing with adding of value (Öjmertz, 1998b).
2.4
Lean thinking and concepts
“The right processes will produce the right result” (Liker, 2004), this sentence can
describe clearly what the main objectives and aims are of lean manufacturing, within the principles used there are tools for improvement of manufacturing processes as well as that truly reflect in the lean production and ideas behind it. By trying to remove the waste as much as possible within the company you can achieve high productivity and clear product flow. The aim is to process only value adding activities, and remove the unnecessary non-value-adding ones (Monden, 1998). Shingo (1981) and Monden (1994) emphasize on the importance of eliminating waste, regarding the importance of eliminating all the non-value adding activities and the usage enough resources in achieving the necessary activity. Considering a picking system the fulfillment of a task is a complete execution of a picking order, which is regarded as a product of a complete logistic value arising from a material handling activity. An activity regarded as a value-adding character is the one that accomplish the desired position in a desirable state in the investigated supply chain.
The understanding and the improvement of the material handling functions and their efficiency evaluation is reflecting in achieving value-adding activities. Improvements are seen and able to be engaged by separating the value-added activities from the non-value adding ones, which results in overall efficiency advance. By decreasing and eliminating the non-value activities the overall material handling activities would be improved. The union between the material handling activities and their relation to the material flow system design presents the ability to identify the functions in deep (Harrison, 2002).
The order according to which the material handling activities are carried out with respect to the position and orientation of their existence according to other existing systems is expressing the dimensions of the state of the system. The degree of disorder can be used as a measurement and as distinguishing between the value-adding and non-value value-adding activities (Öjmertz, 1998a).
2.4.1 Waste Categories
The main objective is to design and sustain a functional system, which possess high flexibility and is designed in a way that can be constantly improved and eliminate all the wastes along the production process, (Monden, 1998). According to J. K. Liker et al, (2004) and Hines and Rich (1997), there are also seven major non-value-adding wastes in the business or manufacturing processes. They are listed as follows:
• Overproduction; • Waiting;
• Unnecessary transport or conveyance;
• Over processing or incorrectly designed processing; • Excess inventory;
• Unnecessary movement; • Defects.
The overproduction concept has been discussed and turned to be an important issue and overly affecting the whole process in the system. The waiting is associated with
the time items need in order to be handled. Unnecessary transport is due to the long distances in the factory, inappropriate layout, inefficient transport of parts and products into storage rooms and so. Incorrect processing is a big issue, which is regarding the unneeded steps necessary to process the parts. The incorrect processing lead to unnecessary motion and producing defects, and in that way waste occurs when there is a poor or inefficient design of tools and products. Excessive inventory hides problems which can be described as production imbalances, defective goods, equipment downtimes, and long setup times. The unnecessary movements are regarding the movements made by the workers, such as looking for necessary things, stocking of parts and tools like set-up times and so.
Besides the accepted wasted in the manufacturing environment, there are presented numerous of wastes in logistics as well despite the fact that there is not so much mentioned about them. The wastes in logistics are as dominant as in any other functional area of the company even though they are not as visible as in the manufacturing itself. There are several latent wastes found in logistics and they can be listed as follows (Goldsby, 2005):
• Inventory; • Transportation; • Space and facilities; • Time;
• Packaging; • Administration; • Knowledge.
Transportation is the necessary activity within the logistics concept (Goldsby, 2005). A big cost consideration is associated with the transportation, but at the same time with the time goods spend in a transition and that results in order lead time and affects the variance in order cycle time. One of the goal initiatives in transportation is to minimize the average time to move goods and to decrease that average.
Time is regarded as one of the most important metric encountered in terms of logistics. The measurement is associated with measuring the lead times and with respect to deliveries ultimately on time. These aspects are important when considering the competitive advantages in terms of speed, which is crucial (Goldsby, 2005).
2.5
Process analysis and mapping
When an existing automated system is being improved one of the essential things is to recognize the whole system with respect to task analysis, which corresponds to the fact that the environment is changing due to demand and responsibilities, which is most of the time unexpected and unplanned (Sheridan and Wickens, 2000). The analysis of an existing system in terms of the processes involved is of a great importance as well as the transparency of the variables in a way of dependency and not, among them.
Regardless of the difficulties associated with the visualization of the weaknesses of one system there are usually techniques used related to mathematical analysis, block diagrams representation, arrow influence, flow charts, statistical analysis, timelines and so forth. The useful information is synthesized, the decision made and the one expected to be, and the control of the plant process as well as the ideas generated so far. After the analytical step being carried out the decision making process is an important step as well as the feedback of the work done so far.
The analysis should be separated from the existing real conditions or distinguished to an appropriate level in order to have a better visualization of the processes. There are number of techniques existing for task analysis, but still there is not a common accepted one in a way of making allocation of the processes. There is always existing connection between the different variables even if the processes are separated, since the parameters are rarely independent and the lever of interaction differs (Sheridan and Wickens, 2000).
The supply chain mapping is used in order to generate visibility of the processes within the supply chain. And as the visibility is being achieved it is possible to estimate the processes. The processes being considered are the actual ones that are taking place. An actual picture of the processes has been established and the investigation is focusing on. The basic principle is to track certain orders within the process, and the generated map is regarded as the picture being given for the process. The workload of demands and orders can be varying from time to time depending on different factors. The mapping is carried out in terms of recording different variables that are used for the estimation of the average of the collected data (Harrison, 2002).
According to Hines and Rich (1997) in order to fully understand the different value streams it is important to map the value adding processes. The value adding activities are giving to the final product more value than it would be. The value stream term refers to a specific part of a company that adds value to a specific product or service which is considered.
Waste removal inside companies is using different techniques and tools aiming to helping identifying different kinds of wastes in individual streams and finding appropriate ways in removing them or reduction of the wastes. The usage of such waste removal techniques drives competitive advantages of the companies and it arises from the studies of Toyota production system.
According to Monden (1993) there are three types of operations that are undertaken regarded to:
• Non-value adding;
• Necessary but non-value adding activities; • Value-adding.
The first one is regarded as pure waste and has to be eliminated, which includes waiting time, stacking intermediate products and double handling.
The necessary but non-value adding activities are regarded as waste, but at the same time are necessary to be carried out. These activities are associated with long distances, unpacking deliveries and so. These changes are connected with making changes in the operation system and layout reconfigurations.
The value-adding activities are those ones which contribute to the processing of materials and goods that bring value for the customer (Liker, 2004).
2.5.1 Mapping guidelines and tools
Initially it will be difficult to map the whole processes within the supply chain, but taking an overview of the core process under investigation and deciding the priorities under investigation gives a possibility for a detailed mapping. By selecting the process there is the customer that serves the process itself and the clear start and end of the process is important to be considered (Harrison, 2002).
When the data is collected the items are being followed along the process and record their behavior in terms of different values, the term used is usually walking the process. Actual orders are followed through all the stages of the process (Harrison, 2002).
The next step is the separation of the tasks with respect to value-adding and non-value-adding activities (Harrison, 2002).
The time based process map is representing the data collected clearly and briefly so that the investigated aspects of the network can be managed in an easier manner. The final goal is to represent the process so all the issues can be easily understood. At the end of the time based process map the creation of a flow diagram is effective in presenting the linkages and dependences between the steps of the process. The flow diagram is useful in approximating the time that the process takes in order to be fully covered (Harrison, 2002).
The solution generation stage is accomplished by investigating the picture of the process being described and presenting areas of improvements. The picture gives ideas and categorizes the non-value adding activities (Harrison, 2002).
2.5.1.1 Process activity mapping
Process activity mapping is a tool that has its origins in the industrial engineering practices and its main reflection is to provide high quality goods and services quickly and inexpensively. There are five different stages in fulfilling this approach stated as (Hines and Rich, 1997):
• Study of the flow processes; • Identification of waste;
• Consideration of the processes in a way whether they can be rearranged in a more efficient manner;
• The consideration of better flow pattern, where different flow layouts or transport routing are involved;
• Consideration of the activities being done at any stage is necessary and what will be the result if certain tasks are removed.
The mapping is involving certain steps as preliminary analysis of the process, detailed recording of the items and tools used in each process. The machines and the area are recorded for the activities as well as the distances associated with movement, necessary time and number of units involved in that process with respect to times and machines. All the distances, necessary time and people involved can be recorded and calculated. The generated picture can be used for further analysis and suitable improvements (Hines and Rich, 1997).
The cause and effect diagram provides a structured and qualitative approach to problem solving. One of the main advantages it has is the generation of discussion that is oriented in the root of the cause of a focal problem. The diagram provides structure to usual analysis brainstorming and serves as a starting point for a deeper analysis. Its function is to narrow the scope of subsequent analysis. The commonly accepted categories for looking into as potential sources of the causes are people, process, technology, equipment, material and the environment. As these areas are having application in the logistics environment as well (Goldsby, 2005).
Techniques like 5whys (Why?, Who?, Which?, Where?, When, and How?) and cause and effect diagram are used in identifying the possibility for removing certain activities regarded as unnecessary and simplify others, combination of others and sequencing certain activities in achieving reduction of waste (Hines and Rich, 1997; Sekine and Arai, 1998). A certain diagram including all the data can be used as a basis for further analysis and eventual improvements.
2.5.1.2 Demand amplification mapping
Another tool is the demand amplification mapping, which corresponds to system dynamics. It is associated with the investigation of the information and material flow. The tool is effective in estimating the demand change in time and quantity along the supply chain. The information generated can be used on a basis for a decision making for further analysis in trying to redesign the value stream configuration, managing the fluctuations and reducing them as well as estimating a regular and smooth flow (Hines and Rich, 1997).
2.5.1.3 Material handling activity analysis
Analyzing the material handling activities can be carried out in several steps, which investigate the character of the flow with respect to transportations, storages and buffers (Öjmertz and Johansson, 1997).
The first step in the analysis is focused in investigating the nodes within the line, with respect to whether the node is needed and what kind of functions it has. As well as determining whether it can be moved in a different sequential order with respect to the entire material flow (Öjmertz and Johansson, 1997).
The next step is identifying the activities within the node and their importance and value-adding character to the material flow (Öjmertz and Johansson, 1997).
The next step is the identification of the localizations, the reasons for division in time and space that restrict and interrupt the proper flow. At this moment there is an investigation of the effect of fewer nodes that add value. The aim is less divisions and breaks in the flow that result in less time, space and as a result less material handling activities (Öjmertz and Johansson, 1997).
The next step is focused in identifying the possibility of reducing the steps that are necessary to be done in achieving the final destination (Öjmertz and Johansson, 1997).
The last step is the investigation of the connections that are needed with respect for the orders to reach the final destination. These activities can be divided in time or space, or the combination of both (Öjmertz and Johansson, 1997).
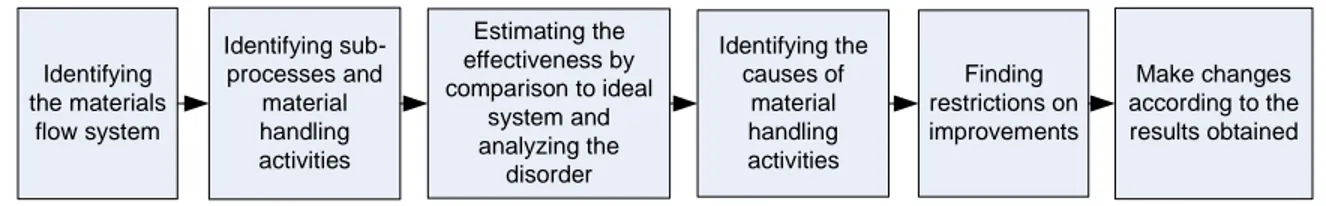
The importance of understanding the functions and performance of the activities in a system are important to identify how resources are being used and the linkages between them. This understanding is reflecting in all types of activities in companies, embracing the materials flows of production, comprising inbound and outbound logistics materials flows. It is important to analyze the material handling activities as a separate function, which is not considered as a waste, but influencing the value of the products. The following figure 2-1 recommends a certain methodology in analyzing and evaluating a materials flow system (Johansson and Öjmertz, 1996).
Figure 2-1. Evaluation methodology aiming to improvements in the material flow
(Johansson and Öjmertz, 1996)
Physical data can be used in connection to the studied field of the material handling activities, and the data used gives more stable generated picture. The resources needed for a material handling task is a measurement associated with the material handling effort. In order to estimate the material handling effort it is important to consider the time consumption as well as the number of activities associated with that. A handling operation is regarded as the taking and placing a certain unit, in case of when the unit are transported and manipulated by a fork-lift truck. A material handling activity is regarded as the procedure when each time materials are investigated along the flow, and it can contain several handling operations. It is more relevant to investigate the actual time consumptions for different material handling activities as well as the number of activities needed for executing the tasks (Öjmertz and Johansson, 1997). According to Womack and Jones (1996) if the final goal of the study is known and all the data is existing for the needed analysis there is no need for benchmarking.
Identifying the materials flow system Identifying sub-processes and material handling activities Estimating the effectiveness by comparison to ideal system and analyzing the disorder Identifying the causes of material handling activities Finding restrictions on improvements Make changes according to the results obtained
When determining the value-adding characteristic of one material handling activity in a material flow a certain reference system has to be defined. The analysis starts from defining the system boundaries, which gives the possibility to estimate the initial condition of the materials in the beginning of the material flow as well as the final conditions. The reference system is the ideal system, where there are no non-value adding activities (Öjmertz and Johansson, 1997).
When the necessary measurements are acquired for analyzing the material flow system with respect to its efficiency a reference system is used in order to present the material handling effort required. A systematic procedure for evaluating a material flow system is presented in the following figure 2-2.
Figure 2-2. Procedure for evaluating the materials flow efficiency of a studied system
with respect to a reference one, (Öjmertz, 1998).
The material handling is associated with the need for connection between processes, which are separated in time and space. And by understanding of these sub-processes and having the necessary knowledge to all the included activities along the material flow relevant suggestions can be given (Öjmertz and Johansson, 1997).
Definition of system boundaries
Mapping of the studied system with respect to: - Process localization
-Material handling operations
Definition of reference system with respect to: -Only value-adding materials
handling
-Minimum number of handling operations
Handling effort in the studied system
Handling effort in the reference
system
Evaluation of efficiency
When the looses are estimated in a material flow system it is necessary to grade the magnitude of the different categories of losses in the system and how much they influence the flow relevant to another system. This gives a picture of the magnitude of the losses existing in the system and estimating them as high and low. The knowledge is used in forming a statement of what changes are necessary in the system design that are relevant for being effective in the increase of the material flow efficiency. At the same time the classification of the losses itself can be useful itself without the necessity of comparison to other systems. This can be seen when a studied material flow system is suffering from problems in meeting certain demands with respect to number of orders needed to be fulfilled. The need for clear connection between the losses and the material flow is important in suggestion for improvements of that system depending on the magnitude with which these losses affect the system. If the losses are able to be measured and how they impact the system it can be reliable to find the cause of these losses and how they can be prevented by changing and improving the system. Losses are classified as value-reducing activities with their influence on the material flow. Another useful categorization is to relate these losses to certain activities within the material flow and in that manner estimate their influence. This can be the case for storing, transporting and material handling in reaching the final destination of the activity (Öjmertz, 1998b).
2.6
AGV system
Since the material handling activities are considered as non-value adding activities, the long term perspective is to be eliminated; hence in the real environment it is hard to be accomplished (Arifin and Egbelu, 2000). The usage of techniques and concepts aiming to decreasing the material handling activities and needs, by designing an efficient flexible system satisfying the transportation request of goods between work stations in an economical manner.
Today an AGV system can be found in many industries as serving a key role in the material handling activities (Ujvari and Hilmola, 2006). According to Arifin and Egbelu (2000) and Ujvari and Hilmola (2006) the application of an AGV system in the transportation capabilities and material handling has a significant impact on the flexibility of the manufacturing systems. The AGV system is appropriate to be used where different materials are moved from different loading points with respect to different unloading points (Groover, 2001). There have been recognized different benefits coming from the usage of an AGV system as follows:
• Flexible paths for material flow; • Flexible usage of the ground space; • Increased flexibility in manufacturing;
• Computer integration and control of the functions with respect to material handling;
• The AGVs are available 24 hours and they depend on battery changes; • The labour cost is decreased;
• The changeover time is decreased.
In most of the cases when an AGV system has to be optimized there is a need for improvements of the lead time performance of the system by applying different alternatives with the considerations of all the factors affecting the material flow
2.6.1 AGV design systems
According to Mantel and Landeweerd (1995), there are three important factors that affect an AGV system, which are track layout, proper number of AGVs required and operational transportation control. According to Koo, Jang and Suh (2005) these factors are the transportation guide path layout, the traffic flow pattern, the number of vehicles required, the capacity of the vehicles, the location of the pickups and delivery stations Among all these factors the required number of the AGVs serving this system is among the fundamental decisions after the traffic network is considered (Koo, Jang and Suh, 2005; Ujvari and Hilmola, 2006, Arifin and Egbelu, 2000).
The factors and their relations that significantly influence the required number of AGVs are represented in the following figure 2-3. As can be seen the control system and its work directly affects the empty travel and the blocking effect of the AGVs in the system. The demand variability and the rate according to which the orders are made affect the capacity need and the number of AGVs in the system. As well as the complexity of the guide-paths the travel distance would be decreased between different points and decrease the number of AGVs (Ujvari and Hilmola, 2006).
Figure 2-3. Factors influencing the required number of AGVs (Mantel and
Landeweerd (1995); Ujvari and Hilmola, (2006)). 2.6.1.1 Transportation control system
The direction of the flow path is important consideration in the AGVs’ system modelling, but special emphasize is made on the computational time required to fulfil the tasks should reasonably be estimated (Ujvari and Hilmola, 2006). Transportation systems are system-based ones and unanticipated performance downtimes affect the stability of the material flow, since that even minor change in the system modelling can have major effect on the final result. In the case of AGVs transportations it delivers goods to a destination point and blocks the guide-path during the time needed to fulfil the task.
The transportation control is either regarded as centralized or decentralized one. In the centralized system the transportation tasks are concurrently considered as the vehicles are routed and scheduled in the system. The decentralized system is when the AGVs
Control system
sophistication Arrival rate of loads Layout flexibility
Empty travel distance Travel distance
are constantly looking for the first transportation task to encounter (Mantel and Landeweerd, 1995).
There are two different situations distinguished as one of them is the think ahead control without time windows. In this case the number of orders is known and time doesn’t play a role as only the proper routing of the vehicles is taken into consideration, as the empty travel distance is minimized. One of the cases is that all the present transportation tasks are listed in a routing scheme and it is executed until new task arrives. The rates with which the tasks arrive determine the nervousness of the system. The other case is the periodic control, where all the arriving transportation tasks are listed and executed until the next tasks arrive. In both of these cases there is a delay in the transportations, and a prioritizing sequence should be adopted (Mantel and Landeweerd, 1995).
The other situation is the think ahead with time windows considerations, where for a certain period of time the orders are known, which are also connected with the production. The transportation times are already taken into a consideration, and it plays an important role. In this way since the lead time is established for a certain period of time and that affects the possibility to estimate the waiting time and empty travel time. In this way a proper routing can be established (Mantel and Landeweerd, 1995).
In all the cases the production scheduling and planning affects the nervousness of the transportation system. A better production planning will influence the easiness with which the scheduling of the transportation activities of the AGVs would be carried out (Mantel and Landeweerd, 1995; Ujvari and Hilmola, 2006).
2.6.1.2 Guideline path of the AGVs
Mantel and Landeweerd (1995) pointed out the importance that the proper design of the guide-paths of the AGV system will result in a shorter distances. As well as less blocking possibilities, which contributes to minimal waiting times at the stations, where the orders are given.
If the given track layout is existing it can be predicted, where the AGV interfere the most, which results in congestion (Mantel and Landeweerd, 1995). In the cases where the traffic is too high there is a need for finding blocking-free routes. This results in the advantage of travel time variance reductions, and this corresponds to more deterministic character of the routing.
According to Arifin and Egbelu (2000) by decreasing the number of conflicting nodes in the AGV system blocking is reduced. That results in decreasing the time variables in the AGV system, which results in ability of the AGV system to deal with more orders.
2.6.1.3 Required numbers of AGVs
Ujvari and Hilmola (2006) summarized that the driving factor of the output of the AGV system is the number of the AGVs serving the material handling transportation system. Unrealistic increase in the number of vehicles serving the system would lead
Determining the proper number of AGVs required serving the system minimizes the total travel of loaded vehicles and as well the overall travel, which includes the unloaded travel. If the number of vehicles exceeds the amount in the system, then the empty travel time decreases, but the loaded travel time increases and idle conditions of the AGVs increase as well (Ujvari and Hilmola, 2006).
2.6.2 Methods for estimating the required number of AGVS
According to Mantel and Landeweerd (1995) a way for estimating the number of AGVs required to serve the system is the sum of the total loaded time and empty travel time, and the waiting time with respect to busy period of the system. That sum is divided by the time an AGV is available during that period.
When designing the required number of AGVs in a transportation system the queuing system perspective has to be taken into consideration (Koo, Jang and Suh, 2005). The AGVs should be considered as resources and the delivery requests as the customer orders arrive, which is measured from the parts needed to be moved from one station to another. The estimation of the servers needed is dependant on the number of requests and service time. The following figure 2-4 represents the part waiting time, which consists of assigning waiting and empty vehicle travel time. The assignment waiting time is the delayed time that certain order has to wait until a vehicle becomes available to take that order. The mean and the variance of the travel time are the two parameters, which are used to approximate the expected assignment waiting time. The empty travel time is estimated by different dispatching rules. The empty travel time is a subject of different dispatching rules.
Figure 2-4. Part waiting time and vehicle travel time, (Koo, Jang and Suh, 2005).
The following figure 2-5 represents the overall fleet sizing procedure in determining the required amount of AGVs in a transportation system.
P ro p e r W a itin g T im e
Figure 2-5. Fleet sizing estimation procedure, (Koo, Jang and Suh, 2005).
The stochastic system is being considered when the delivery requests are being issued at random periods of time and being executed by vehicles assigned in real time, in this way there is a possibility for estimating the fleet size of the AGV system (Koo, Jang and Suh, 2005). According to the model proposed by Koo, Jang and Suh (2005) the following assumptions have been made:
• The travel time between pickups and delivery station is unique and deterministic;
• The average delivery request between the locations is known, but the certain time is known probabilistically;
• When there is no delivery request waiting for a vehicle the vehicle stays idle; • One vehicle serves only one delivery order at a time;
• If multiple idle vehicles are waiting for a delivery request, a certain AGV is selected by a predefined policy, and if multiple requests are waiting for an idle vehicle, the requests are served by the order in which the request arrived. The mean and the variance of the empty travel time and loaded travel time are estimated, and the expected part waiting time is calculated as well, probabilistically by the usage of the following formulas:
{
}
1 1 ( ) ( / )( ) n n l ij ij u i j E t f F t l = = = + ∑ ∑
,
(1),
is the expected loaded travel time{
2}
2 1 1 ( ) ( / )( ) ( ) n n l ij ij u l i j V t f F t l E t = = = + − ∑ ∑
,
(2),
is the variance of the loaded time1 1 ( ) ( ) n n e si k ki i k E t f fd t = = =
∑
∑
, (3),
is the expected empty travel time2 2 1 1 ( ) ( ) ( ) n n e si k ki e i k V t f fd t E t = = = −
∑
∑
,
(4)
, is the variance of the empty travel time The following variables are being considered as follows:• Number of pick-ups and drop-off locations; • Number of vehicles;
• Vehicle utilization, which is the total travel time of an AGV/ total vehicle travel time available;
• Delivery requests rate; • The vehicle travel time;
• Sum of loading and unloading time;
• The delivery request rate between the locations.
The models proposed should be designed in a way that the variables being considered, should be reflecting real demand and times, and the time when the demand is not high should be avoided where there is a slow down in the activities. The reason for that is that this data will lead to bias and unreasonable conclusion not reflecting the real circumstances (Arifin and Egbelu, 2000; Koo, Jang and Suh, 2005).
The model proposed by Koo, Jang and Suh (2005) represents with high closeness in the estimation of the required number of AGVs serving the system with comparison with other existing techniques. It can be stated that its accuracy is close to well-known simulation techniques, and it is suitable to be used for its purpose.
2.6.3 Simulation versus Analysis
Transportation simulation has been recognized as a challenging research problem, where the difficulties for estimating the system boundaries, time spend and its complexity makes it difficult to be implemented. Even though, that simulation tools have been developed recently the researchers in the area state that their usage in real time environment has been limited. This is especially the case when there is an existing system being considered (Ujvari and Hilmola, 2006).
On the other hand Lainema and Hilmota (2005) point out that simulation can be used for improvement techniques after an AGV system has been already established. In this way it serves like an optimization tool in a way of detecting bottlenecks and apply different control methods. At the same time more convenient option being pointed out for the usage of a simulation tool is the case when manufacturing facilities are being designed.
According to Arifin and Egbelu (2000) the usage of an analytical model where there is a mathematical dependence between the variables affecting the required number of AGVs in a material handling system. The usage of a real data collected from the factory is suggested to be used in the analysis, since when existing system is being investigated the data comes originally from a simulation analysis being used, when the system was designed.