J
Ö N K Ö P I N GI
N T E R N A T I O N A LB
U S I N E S SS
C H O O L JÖNKÖPI NG UNIVER SITYAre Women more risk averse than men?
An analysis of the Swedish Premium pension choices
Master Thesis within Economics Author: Emma Harrtell 820317
Tutors: Prof. Ulf Jakobsson
Ph. D. Candidate Daniel Wiberg Jönköping: May 2007
Magisteruppsats inom Nationalekonomi
Titel: Är kvinnor mindre riskbenägna än män? En analys av de Svenska premiepensionsvalen Författare: Emma Harrtell
Handledare: Professor Ulf Jakobsson
Doktorand Daniel Wiberg
Datum: Maj 2007
Ämnesord: Risk analys, risk, könsskillnader, PPM, PPM-valen, fonder
Sammanfattning
Huruvida män och kvinnors attityd skiljer sig åt när det kommer till risk är ett ämne som det bedrivits mycket forskning kring. Dock var det först med de indivuella premiepen-sionsvalen som det för första gången kunde undersökas från ett rättvisande urval, eftersom hela befolkningen valde och gjorde så under samma period samt med samma bakgrunds formation. Med implementeringen av detta nya system kom alltså en möjlighet för varje in-divid att själv påverka sin pension genom de indivudella valen. Informationen som varje individ erhöll innan valen innehöll risken associerad med varje fond samt fondens ur-sprung, dessa två variabler testas i uppsatsens empiriska analys. Följaktligen är syftet med denna uppsats att undersöka ifall kvinnor är mindre riskbenägna än män med premiepen-sionsvalen som analys. Resultaten visar att det inte finns några statistiska bevis som indike-rar att kvinnor är mindre riskbenägna än män när det kommer till pensionsplaceringsbeslut. Dock har fondens ursprung en större inverkan på kvinnor än den har på män. Eftersom kvinnor visar en tendens att vara mer benägna att investera i Svenska fonder. Detta kan dock påverkas av faktorer som t.ex. vilken sektor man är anställd i. De erhållna resultaten gör att jag kan instämma med tidigare forskning som hävdar att det inte finns bevis som indikerar att kvinnor är mindre riskbenägna än män.
Master Thesis in Economics
Title: Are women more risk averse than men?
An analysis of the Swedish Premium Pension choices
Authors: Emma Harrtell
Tutor: Professor Ulf Jakobsson
Ass.Tutor: PhD. Candidate Daniel Wiberg
Date: May 2007
Key words: Risk analysis, risk, gender differences, PPM, individual investment choices, funds.
Abstract
The subject of men and womens attitude difference towards risk has been thoroughly dis-cussed in previous research. However, with the individual allocation choices came an op-portunity to study this subject and to draw conclusions from a fair and representative sam-ple for the first time. The reason is that the entire population choose and did so at ap-proximately the same time, and were given access to the same information prior to choos-ing. With this new system came therefore the opportunity for each individual to invest a portion of their pension. The information, distributed to each individual prior to choosing, contained the risk index and also the origin of the fund and these variables are tested in the empirical analysis in the thesis. Hence, the purpose of this thesis is to investigate whether women are more risk averse than men, using the individual allocation choice as analysis. The results indicated no difference between men and women indicating that there is no sta-tistical evidence that women are more risk averse than men when it comes to individual fi-nancial decisions. However the origin of the fund has a larger impact on women in the sense that they have a tendency to be more home biased than men. However, the home bi-asedness seems to be a variable highly affected by e.g. place of employment. With the ob-tained result I can concur with previous researches that claim that women are not more risk averse than men.
Table of Contents
Sammanfattning
... i
Abstract
... ii
1
Introduction
... 1
1.1 Outline ... 22.
Theoretical Background
... 3
2.1 Factors affecting individual investment choices ... 3
2.2 Are women more risk averse? ... 4
2.3 Are women less risk averse? ... 5
2.4 Home Biasedness ... 6
3
The reformed premium pension system
... 8
3.1 The funds ... 9
3.1.1 The bond funds ... 9
3.1.2 The equity funds ... 9
3.1.3 The mixed funds ... 10
3.1.4 The generation funds ... 10
4
Empirical analysis
... 11
4.1 Variables and Method ... 11
4.2 Regression Models ... 12 4.3 Regression analysis ... 13 4.4 Regression Results ... 16
5.
Analysis
... 20
6
Conclusion
... 22
References
... 23
Appendies
Appendix I Tables ... 25
Appendix II Figures... ... 33
Tables 1 Regression variables...12
2
. Pooled least squared for equation 4.1... ... 14
3 Mean test for equation 4.1 ... 14
4 Hausman test for equation 4.1 ... 15
5 White’s General Heteroscedasticity test for equation 4.2 ... 15
6 Random effect regression result for equation 4.1...16
7 Constrained regression result for equation 4.1...17
8 OLS regression result for equation 4.2...17
Figure 1 The reformed pension system ... 8
1 Introduction
The ability to measure risk connected to a random variable, like individual investment deci-sions, is highly dependent upon the information given to the individual (Paulsson, 2001). With the establishment of the Premium Pension Authority in 1998 the Swedish population were faced with the opportunity to make active investment choices concerning their future pension (SOU, 2005). Surprisingly many showed interest in actively investing in the new Swedish pension system 67 percent of the 4.4 million individual’s subject for choosing in 2000 did not choose the default alternative (Engström & Westerberg, 2003). With this data follows an excellent opportunity to investigate women and mens different attitude towards risk in financial situations.
The purpose of this thesis is to analysis whether women are more risk averse then men. To disentangle this question the empirical investigation will be based upon the allocation choice of individual investment in the Swedish Premium Pension system.
The first hypothesis that will be tested is if there is evidence supporting that women are more risk averse than men. The second issue addressed is if women and men differ in their attitude towards the origin of the chosen fund. The empirical analysis is performed in two steps, the first analyses the individual risk preference for the two genders in a random ef-fect model and a constrained regression model the last step is to individually test every year to see if there is a time influence to acknowledge.
The thesis is limited to investigate gender differences in attitude towards financial risk using premium pension choices. The reasons are that it does not require using data that have been collected through a survey of any kind. Much of the previous research has been per-formed on experimental grounds where each individual made investment decisions based on hypothetical situations were they were not faced with any consequences of their choice. Another reason for using the individual allocation within the new premium system is that the data is reliable due to the fact that it represents the entire population and is therefore a highly representative sample. More recent research have investigated the subject in what is called a 401 (k) plans, a retirement savings plan that is funded by employee contributions and often matching contributions from the employer (Madrian & Shea, 2000). The major drawback from this is that the population subject to the plan is more or less homogenous. Therefore errors from drawing conclusions from a small sample and also partly from inter-preting the survey wrong are minimized in this thesis when using the premium pensions as base for the empirical analysis.
Whether women are more risk averse than men is an interesting subject to investigate. One reason to why it is important is that it will have a huge effect on the future income for women because if women have a tendency to allocate individual investment decisions to low-risk investment, their pension will be smaller and this will lead to a smaller wealth for the female population upon retirement (Säve-Söderberg, 2003a). Further reasons why this is an important subject could be to see if it is true that women are more risk averse how will that affect women in the business world.
How will the future business climate be affected if it is not true that women are more risk averse (Brachinger, Brown, Gysler & Schubert, 1999).
Hence, this thesis aims to answer the question if women are more risk averse than men and intends to do so using the individual allocation choice within the premium pensions as analysis due to the statistical advantage that they provide.
1.1
Outline
The thesis continues with chapter 2 covering the theoretical framework and dealing with previous research. Chapter 3 discusses the premium pension and the characteristics of the different funds. From this background theory the hypotheses will be formulated and tested through regression analysis. Data used in the regression have been retrieved from Premium Pension Authority. Chapter 4 deals with the data and regression analysis. The results will then be discussed and analysed in chapter 5. Chapter 6 will conclude the thesis and give recommendations for further research.
2.
Theoretical Background
Women and men’s attitude towards risk have been thoroughly discussed. However, the discussions have many times been from a socioeconomic view where the biological factors, which this thesis will not address, play a significant role in men and womens approach towards risk. According to a study made at Gothenburg University women have a tendency to be more risk averse, on average, than men (Carlsson, Daruval & Johansson-Steinman, 2003). Hence, there is a common view that women on average are more risk averse than men in making financial decisions. The perception is also that females in high corporate positions are more risk averse than men in the same positions (Brachinger. et al, 1999). Women, with more risk aversion, will then be less willing than men to engage in risky decisions necessary for a successful development of the firm.
The following sections will discuss the result from previous research within this field. The discussion will focus on two points, one arguing that there is no evidence supporting the fact that women are more risk averse and the other stating the opposite. The last section will discuss the attitude concerning domestic versus foreign investment and the impact that the origin of the fund is believed to have on the individual investor, in this thesis referred to as home biasedness.
2.1
Factors affecting individual investment choices
When making individual investment decision many factors play a significant role besides gender meaning that there exist other factors that for an individual are presumed to be positively correlated with risk. Many researchers have taken that into account when analys-ing the gender difference by includanalys-ing variables such as income, savanalys-ings, education, em-ployments, etc (Engström & Westerberg, 2003). The question however remains if they are explanations used to answer the difference in risk preference between men and women. If one takes these variables and apply them to individual investment choices it becomes fairly obvious that the gaps between men and women here is small. It is very common that men and women today share the same level of education, savings, employment and are, hope-fully, moving closer and closer every day towards the same salary. Still these are variables positively affecting investment choice however; the gap between men and women is not that large today.
One negative effect associated with individual investment decisions is that with uncertainty comes a high transaction cost from the gathering of information (Engström & Westerberg, 2003). Through the distribution of the so called oranga kuvertet1 the Swedish population was informed about the risks associated with each fund as well as the origin of the fund (Palme, Sundén & Söderlind, 2005). Therefore the assumption that women would be more risk averse, because they are not equally informed about the risk associated with their choices in the individual premium pension is assumed to not be accurate.
2.2
Are women more risk averse?
It has been argued that men have a tendency to engage in financial trading more actively than women, according to Brad Barber & Terrance Odean (1999) who discusses that fact in their report Boys will be boys: Gender, overconfidence and Common stock Investment. They further state that men inhabit more overconfidence than women and therefore are inclined to take on more risky investments than women do. When defining overconfidence they argue that because men are more likely to take an interest in trading than women they are also more likely to have a higher degree of information seeking. This information seeking aids them in taking on investment with a higher risk. Hence, a combination of both the interest and the higher degree of information seeking leads to the fact that men are more overconfident than women (Barber & Odean, 1999). They test the hypothesis that men invest in riskier assets to a higher extent than women. They looked at how much diversification that, on average, men and women has in their portfolios. Also when subject to invest in one indi-vidual stock who will invest in the one with the highest risk? They further discussed the fact that men have a tendency to invest in smaller firms associated with a riskier stock to a higher extent than women. All these different tests aid them in reaching the conclusion that men are more likely to invest in riskier assets than women (Barber & Odean, 1999).
Annika Sundén and Brian Surette (1998) have performed research on the subject if workers differ systematically in their investment behaviour. They have used data from a survey on consumer finances, performed by the Federal Reserve Board over the years 1992 and 1995. The survey collected detailed information about the household’s liabilities and assets as well as pension coverage and pension plans for both spouses in the household. The sample size was around 4000 investors for the two years. They came to the conclusion that it is not just gender that affects an individual’s investment choice. They found that it is rather a combi-nation of marital status and gender that influence individual risk preference. According to their result the most risk averse are single women and married men (Sundén & Surette, 1998).
In her paper Self directed Pensions: Gender, Risk and Portfolio choices Jenny Säve-Söderberg (2003) discusses women’s and men’s attitude difference towards risk in a multivariable model with the inclusion of variables like marital status, age, children, pension risk, income risk, etc. She first comes to the conclusion that women invest more conservative than sin-gle men. However, she observes no difference between sinsin-gle or married women. Her find-ings differ from the findfind-ings of (Sundén & Surette, 1998) that concluded that marital status and gender combined seem to be the deciding factor. In examining the difference when subject to individual pension plans she divided the funds into three groups, low, medium and high risk funds. The conclusion she reaches is that women are more conservative than men as previously mentioned. However, she only observes a difference in the high-risk group when testing the individual groups. She concludes by stating that she cannot find any statistical evidence supporting that women have a tendency to invest more frequently in low-risk funds (Säve-Söderberg, 2003b).
2.3
Are women less risk averse?
Mårten Palme, Annika Sundén and Paul Söderlind (2005) have investigated the difference between men and women’s attitude towards risk quite extensively. They have also used the individual premium pension choices for their empirical analysis. In their paper Investment choice in the Swedish premium pension plan they estimated the choices made separately for men and women. In their estimation they include variables that take into account the existence of individual private pension savings and age. The reason for doing so is that they assume that these two will be negatively correlated with the risk associated in the individual alloca-tion choice. Other variable included was income, on the basis that the higher the income the more prone the individual is to invest in funds with a higher risk, which was enhanced by their regression outcome (Palme. et al, 2005). They also tested marital status to see if there was an observable difference between men and women in this sense. The result ob-tained was that married women are more likely to take on riskier investment than single women. The opposite was showed for men, which would suggest that married couples have tendency to pool their investment decision. Further they found that the low-income individuals are probable to invest in funds associated with higher risk. The parallels that can be drawn here is that the low income earners many times are women, hence it can be con-cluded that there is no evidence pointing in the direction that women have a tendency to be more risk averse than men (Palme. et al, 2005).
Stefan Engström & Anna Westerberg (2003) came to the conclusion in their research that women are more active in investment decisions. They extensively tested this conclusion by including and testing it against many different variables, such as age employment, educa-tion, etc. They observed no correlation between these variables that would distort their re-sult. However, a small correlation was observed between age and marital status, enhancing the results from Palme, et al (2005). They observed that around 68 percent of all women made an active investment decision compared to 66 percent of the men. These findings were found to be true for the ages 18-62 (Engström & Westerberg, 2003). This implies that women are not more likely to choose the default alternative. The researchers claim that the fact that women are more active exclude the importance of all variables such as age, in-come wealth, etc. that they tested to see if there existed other factors affecting men and women in their investment decision. Hence the difference between men and women in this aspect cannot be explained by other characteristics. They cannot find any evidence stating that men are more prone to invest riskier than women. They further argue that results stat-ing the opposite are misleadstat-ing because these studies do not cover a representative popula-tion (Engström & Westerberg, 2003). The premium pension and its individual choice sys-tem is just the opposite and unique in its kind. It is the first opportunity within Sweden to investigate a representative population and from that be able to estimate more accurate the risk attitude difference between men and women.
The results from the two previous sections are further enhanced and also taken so far as to state that earlier research that have concluded the opposite to be more prejudice than they are accurate, discussed in the report Financial Decision-Making: Are Women Really More Risk-Averse? (Brachinger. et al, 1999). The authors further elaborates that there is therefore a sta-tistical discrimination against women in the financial market that is not accurate and that women are not more risk averse than men.
They argue the negative effect that this enhances, namely the belief that women are more risk averse than men might limit the female participation in the business life. They con-clude by stating that this belief purely prejudice and bears no truth (Brachinger. et al, 1999).
2.4
Home Biasedness
Home biasedness can be described as familiarity, meaning that the origin of the fund have an effect on the individuals investment choice (Karlsson & Nordén, 2004). Hence, if the fund contains mostly domestic securities (in the domestic currency) the individual that is more home biased will most likely choose that fund rather than a fund that is foreign based. It is however hard to pin down what actually affects the individual in this field. It can be anything from the desire to hedge inflation, which is easier to observe, or the feeling of uncertainty or of overconfidence which is more a characteristics of the individual (Karls-son & Nordén, 2004). Where the individuals earn their income and spend it might also have an effect upon whether they are more home biased or not. The home biasedness in the individual premium pension choices is observable for the genders and is included in the empirical analysis. The individuals were put in a situation where they choose at the same time with the same information, as already mentioned. The information also included the origin of the fund therefore it was easy to observe and to include in the thesis.
Karlsson & Nordén (2004) concludes in their research that investors employed by the pub-lic sector have a tendency to invest in domestic assets to a higher extent than those em-ployed by the private sector. The reason is that they are assumed to be more secure in their jobs. With this security comes a concern about the future and present domestic purchasing power and a desire to secure it which can lead to home biasedness. The home biasedness of the public sector employer can also be due to a feeling that the domestic market is e.g. safer. The private sector employee is assumed not to have as high job security as the public sector employee. Hence face a higher unemployment risk due to economic downturns in the domestic market. This will therefore lead to a more international diversification. In Sweden there is a huge overrepresentation of females working within the public sector which would indicate that women should be thought to have a higher tendency to be home biased in their investment than men (Eriksson, 2005). These results are further enhanced by Palme, Sundén & Söderlind (2005) that in their research came to the same conclusion. They discuss the complications of such biasedness with a worrying thought towards re-tirement benefits for these investors. The reason being that ignorance of capital risk and to-tal focus on origin could lead to lower income for these investors upon retirement (Palme. Et al, 2005).
Karlsson & Nordén (2004) further argue that home bias is positively correlated with over-confidence, which is something they claim is many times inhabited by men. They base this on the research made by Brad Barber & Terrance Odean (1999) who in their paper argue that men take a higher interest in financial trading, and that interest leads to a higher in-formation gathering. Hence, there is a tendency for men to be more home biased (Barber & Odean, 1999).
In the aspects of the premium pension investments this is debatable; due to the level of in-formation provided to each individual prior to choosing is the same, through the distribu-tion of the oranga kuvertet.
However, this does not exclude the fact that there are other ways people extract informa-tion concerning the funds. For this thesis however it is assumed that men are not necessar-ily more overconfident than women due to the fact that they all have access to information concerning the funds. This could mean that the belief that men are overconfident might not apply to this particular situation.
If an individual inhabit home bias or not seems to be affected by many other factors than just gender. Particular in the case of the individual premium pension choices because each individual have the same information before choosing. Where the individual decides to lo-cate upon retirement might be one factor, meaning that if an individual has the intention to stay in Sweden after retirement might mean a higher degree of homebiasedness. Other fac-tors that seem to have an effect, according to the previous researchers, are employment and education.
3
The reformed premium pension system
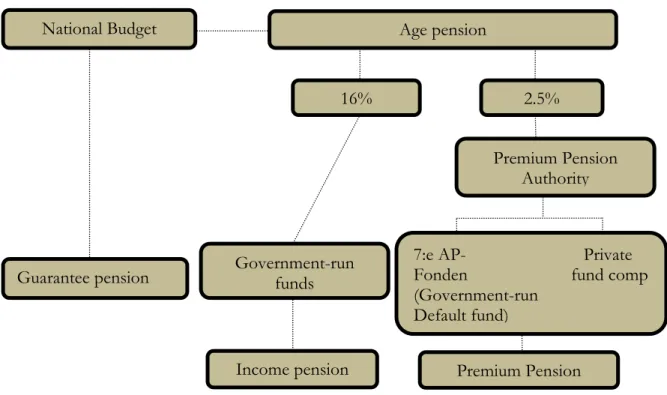
An initiative to reform the Swedish pension system was passed by the government in 1998 by the establishment of Premium Pension Authority (SOU, 2005). The need to reform the old pension system was vital to be able to support the large population that is facing re-tirement. The reform into a fee based system was also necessary so that the system could endure economic turbulence and demographic changes. The fees are set in relation to each individual income. This means that individual income and general economic development and to some extent the individual choice is what determines the income based pension, premium pension and income pension (SOU, 2005). Below is a figure illustrating the re-formed system explaining how much of each individual pension actually is the premium pension and subject to individual choice.
Figure 1 – The Reformed Pension system
Source: Author’s own construction
As can be seen by figure 1 the guarantee pension is not a part of the age pension, hence it is not income based. It is a guarantee paid out by the government to very low income or no income individuals. Out of the age pension, that is 18.5 percent, 16 percent is the income pension and 2.5 percent is the individual premium pension. The age pension is calculated on a yearly basis and takes into account the lifetime taxable income which includes, e.g. a possible maternity leave. The guarantee pension and income pension are managed by the Swedish social insurance administration (forsakringskassan.se).
The size of each individual’s premium pension is based upon how much added value each individual has on their account that is in direct link to the return from the funds as well as their historical performance. A calculation is made every year and paid out monthly. When the payment is due Premium Pension Authority sells the amount that is necessary to be
National Budget Guarantee pension Age pension 16% 2.5% Government-run funds Premium Pension Authority
7:e AP- Private Fonden fund comp (Government-run
Default fund)
Premium Pension Income pension
With the reform of the old pension system a government-run default fund was set up, sjunde AP-fonden (Premiesparfonden). This fund functions as a collector for the individuals not making an active decision. It mainly consists of equity holdings and is therefore a default fund associated with a higher risk than many other government-run default funds (Eng-ström & Westerberg, 2003).
3.1 The funds
In 2000 the first individual investment selection took place. The supply of the funds within the system has increased dramatically since it emerged. At first approximately 405 funds participated in the selection which has increased up to 1033 today (ppma). The funds are put into four main groups; bond, equity, mixed, and generation funds. Within each group there are then different categories of funds and every category can further have securities of different origin in the fund. They consist of either Swedish or foreign assets how this is calculated differs somewhat from what category the fund belongs to (see sections 3.1.1-3.1.4) (Brantmo, 2001).
3.1.1 The bond funds
In these types of funds 100 percent of the capital is put into interest bearing securities. These bonds are distributed by either the state; a municipality, an international organization or a company (SOU, 2005). They are categorized subsequent to what the remaining time the value of the bond has, and where they are located geographically. These funds gener-ally have a low risk. The funds with the absolute lowest risk within this category, the short bond funds; generate a rather weak value development. Hence, the variations in the funds are fairly low. The funds with a slightly higher risk, and a chance for a better value devel-opment, are the long bond funds. The bond funds that have their investment base abroad are usually associated with higher risk due to the fact that they are subject to exchange rate fluctuations (ppmb).
The bond funds that are Swedish contain interest baring securities that are distributed by Swedish companies, credit institutes or by the Swedish government. The securities are dis-tributed in the Swedish currency. The difference between the short and long interest funds is the time limit the fund has, the short one reaches maximum a year while the long reaches over a year. The foreign interest funds are similar to the Swedish ones, the difference is that they carry the currency of that particular country who distributes the fund (ppmc).
3.1.2 The equity funds
The equity funds have at minimum 75 percent of the capital invested in shares. They have a higher risk than bond funds, therefore also a greater chance of generating a higher value. The equities are issued by companies and represent a part-ownership in the company for the holder. They are categorized after how they are being distributed, they can be index repre-sentated, or from one company, one region, etc. (SOU, 2005).
These funds are therefore highly dependent upon the development of the company, and a possible growth lies in how well the market believes that the company will perform.
In this category the risk level can vary greatly. However, the more specialised a share fund is the higher the risk is.
The equity funds that are Swedish consist of no less than 75 percent of Swedish shares that are listed on the stock exchange. Within this group there are different distributors of the eq-uities. They can consist of small companies or be distributed to follow an index, like the OM-index. The foreign funds vary widely within this category. They can be either regional based and consist of equities from mainly two countries. There are also funds within this category that consist of equities from listed companies in Scandinavia, Europe, European monetary union members, USA, Asia, etc. Or funds that carry equities within a specific busi-ness, for e.g. technology. These funds can also be country based; hence they will be specia-lized towards an industry as well as a country (ppmc). An equity fund that is more diversified over many countries will be associated with a lower risk than the one where all the shares are from just one country. A foreign based share fund is also affected by exchange rate fluctua-tions (ppmd).
3.1.3 The mixed funds
The mixed funds constitutes of a mix between equities and bonds. It is the fund manager that controls the diversification of the fund which also varies the risk. How much the diver-sification varies is also the foundation of how they are categorised (ppme). Investing in these funds is an easy way for the individual to spread out the risk in their investment. The total average risk of these funds lies somewhere between the bond and the equity funds (SOU, 2005).
The funds in this category differ in the following way. The Swedish ones consist of both bond funds and equities, in what proportion varies somewhat among the funds. Some funds carry both foreign shares and Swedish interest rate baring securities. However, they always have a minimum of at least 15 percent in the interest baring securities. There are also funds that have both the shares and the interest baring securities put into foreign countries (ppmf). 3.1.4 The generation funds
The generation funds consist of both equity and bond funds. They are intended as a life-cycle saving which is also how they are being categorized. The structure around them is as followed, they consist mostly of equities when the retirement is far off for the individual. As the individual moves closer towards retirement the trustee of the found gradually transfers into bond funds. This means that the risk is higher when you are younger for these types of funds (SOU, 2005).
4
Empirical analysis
The advantages with using the individual choices associated with the premium pension to analyse this thesis purpose are many. The data covers the entire population and is therefore a representative sample. The investment decisions are all being done at approximately the same time and also the information available to the investors, through the distribution of the oranga kuvertet, is the same. Lastly the data is also reliable because not making an active decision for an individual is still making a choice when it comes to the individual premium pension. The reason is that when an individual is not actively choosing the premium pen-sion is invested in Sjunde AP-fondens (the government-run default fund). This fund is also associ-ated with a risk index, meaning that even if an individual is not active in choosing it is still signalling a risk preference. Even if the data does not define which of these investors that actively did not make a choice or simply did not care this thesis will treat them as non-active investors based on the conclusion from previous research (Karlsson, 2004). Analys-ing the premium pension is therefore an excellent opportunity to get a fair indication about women and men’s risk preference. In the dataset there were funds that did not have a risk value assigned to them over all the years, due to the fact that they were new when put into the premium pension system, and not yet developed a risk. These have been excluded from the analysis to not distort the result.
4.1
Variables and Method
The data have been collected from Premium Pension Authority´s official webpage, www.ppm.nu. The collected data cover the years 2000-2007 and are comprised by all the different funds that each individual can choose. The data covers choices made by each individual, meaning that one fund category can have several choices made by just one individual. The dataset also revealed the risk associated with each fund (for further knowledge the section below). Data concerning the origin of the fund were also extracted from the webpage. It was extracted for the funds that were available in 2007 and then matched to its associated fund for the following years. The reason for choosing to include the origin variable in the regression is not merely based on the availability in the data but also the fact that it has been argued that a sense of security when it comes to investing is of importance to the individual investor (Engström & Westerberg, 2003).The variables were aggregated to fit the regression models in the following way. On a yearly basis the number of choices has been collected for an individual. The data for each choice is gender specified and to fit the data better to the regressions a percentage of how many women that choose that particular fund have been calculated for the entire dataset. The number of individuals choosing naturally increased every year. The first choice occurred 2000, by that time 4.4 million was subjected to choosing. The increase has then been estimated to be about 100000/year (ppmg).
Risk is a measurement of how much the funds value has developed over time and how much variation the fund inhabits. The risk level of the funds were also extracted from offi-cial webpage were they are posted as standard deviations, showing how much the fund have changed with respect to its average development in percent. The higher the value, the more variation the fund inhabits, the higher the risk is. The reasoning behind what consti-tutes a high risk is that the more variation the fund inhabits the harder it gets to draw any conclusion about the future development of the fund.
While a fund associated with a lower risk does not experience much deviation and is there-fore easier to there-foresee about the future development (ppmh). The four categories of funds are associated with different risk levels as already mentioned in section 3.1
In table 4.1 the variables included in the regression equations are explained. Table 1 Regression variables
Variable Meaning
%♀ it % women for each fund ♀i female1...female7
D dummy variable as indicator for homebiasedness Di home biasedness1...home biasedness7
R risk index (standard deviation) Ri risk index1...risk index7
Ε error term
The dependent variable represents the number of females, in percent, that choose the fund. The variable has been aggregated from having data that are gender specified in each fund. By taking the number of females divided with the total the dependent variable was calcu-lated for every fund. The dummy variable is included to signal whether the fund is Swedish or foreign, home biasedness. The following variable is the risk measurement which is a standard deviation. The last variable included is an error term.
4.2
Regression Models
The models have been put together by looking at the available data provided by Premium Pension Authority. After gathering the available data the dependent variable was calculated and the independent were chosen by looking at the availability in the data as well as taking into account the information that each individual had about the characteristics of each fund. As previously mentioned individuals are provided with information concerning these variables before choosing how to invest through the distribution of the folder known as oranga kuvertet. All this combined makes the design of the models reliable.
%♀it = β1i + β2 Dummy (home bias)it + β3 Riskit +εit (4.1) For equation 4.1 the value of β1i is not fixed but assumed to be a random variable that is allowed to vary with a mean value of β1 (Arellano, 2003). The intercept for each individual’s choice is expressed as
β1i= β1 + εi i= 1,3….n
Meaning that when running the regression according to the random effect model the regression will acknowledge that the number of people observed varies for every year.
The individuals measured differ with time. They increase on a yearly basis which means that the same amount of people is not being measured every year.
♀i = β0i + β1 Dummy (home bias)it + β2 Riskit +εit (4.2) Equation (4.2) has been run independently and separately for every year to control the results given from equation (4.1). It tests to see if there has been a change among women concerning their attitude towards risk over the years. Both equations are used to test the two hypotheses, are women more risk averse than men and do they have a tendency to be more home biased than men.
The regression models used for equation 4.1 is random effect and a constrained regression model. The data for these models have been pooled together over time and then tested. The reason for choosing to pool the data is that this enables more flexibility to examine data that crosses over time series (Gujarati, 2003). With the individual premium pension accounts a pooling of the data means that it is acknowledged that this savings method is just one of many savings methods available for the individuals.
When analysing choices it is necessary to choose a model that take into account that some factors will affect all individual observed in the same time period and that these factors persist over time (Skoglund, 2001). These factors can in this case be for e.g. macroeconomic factors relating to the world economy affecting the choice each individual makes about how to invest in the individual premium pension. The random effect model adjusts, through the disturbance term that the knowledge about the true model is limited. Basically what this means is that the model takes into account that the number of individuals vary over time (Arellano, 2003). The constrained regression model was run to factor out the influence of time and to see if this would change the results. Hence the arguments for using the random effect and constrained model and pooling the data is that it acknowledges the larger universe of saving options available for the individual and factor out the influence of time as well as the fact that the number of individuals varies in the model.
Regression used for equation 4.2 is of an ordinary least square model and takes the analysis one step further. It is testing each individual year separately to see if there are any yearly trends that can be observed when the data is not pooled. The equations are tested on a yearly basis with the number of observations each year being the number of funds chosen for that year. This enables one to see the risk preference and also to see if time is a factor that influences.
4.3
Regression analysis
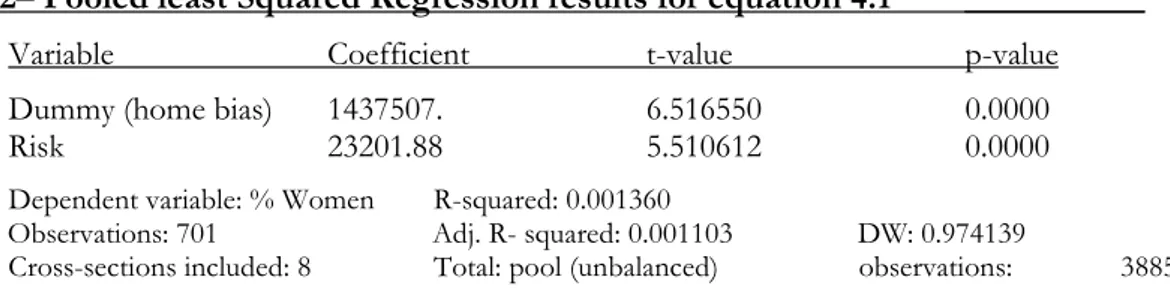
Before moving on to the hypotheses testing the two regression equations have been tested to be able to detect possible errors. By detecting these problems and adjusting for them the possibilities to draw accurate conclusions from them increases. Equation 4.1 has been subjected to two tests. First a pooled regression was tested (see table 2) on the data.
Before deciding to test the data according to the random effect model the data was tested after pooled least square method (PLS) with (% Women) as dependent variable. The result obtained is presented in the table below.
Table 2– Pooled least Squared Regression results for equation 4.1 __________ Variable Coefficient t-value p-value
Dummy (home bias) 1437507. 6.516550 0.0000
Risk 23201.88 5.510612 0.0000
Dependent variable: % Women R-squared: 0.001360
Observations: 701 Adj. R- squared: 0.001103 DW: 0.974139
Cross-sections included: 8 Total: pool (unbalanced) observations: 3885
______________________________________________________________________
As can be seen both the dummy variable (home bias) as well as the risk variable show significant results. That would indicate a non-rejection of the hypotheses that women are more risk averse than men as well as the fact that they are more home biased. However there are some problems with using this test model. The model does not take into account the different factors affecting the individuals over time or acknowledges that there exist other pension savings methods available for the public (Gujarati, 2003). These facts indicate that testing with PLS would yield inaccurate results. Also worth mentioning is that the R-square is extremely low indicating that this model is not the best to analyse this data. To test to see that the intercepts were not equal an estimate over the series of means over the period 2000-2007 was performed on the independent variables. If the intercept would be the same there would be no need to pool the data since that would show inaccurate results (Kawakatsu, 1998). To see if this is a problem for the model the Sum. squared resid, and the p-values, are interpreted to see that they are not to showing values that are far from each other and to see that the p-values are significant so that an interpretation is possible. The table below shows that the model have no such problem, hence the data can be pooled together and interpreted.
Table 3 – Mean test for equation 4.1 _______________________ _____
Variable Sum. Squared resid p-value_
Mean Nationality 2.74 0.0000
Mean Risk 2.72 0.0000
Dependent variable: Women
_______________________________________________ ______ _____
The next crucial thing to test is whether the pooled data should be a fixed or a random effect model. The difference between these two lies in what the correlation between the error term and the regressors are. If it is assumed to exist no strong evidence of a correlation then the random effect model is the best one, however if there is a correlation then the fixed effect model is the best choice (Gujarati, 2003).
A Hausman test was performed, as can be seen below, to see which model would be a better fit for the data in this thesis (Kawakatsu, 1998).
Table 4 – Hausman test for equation 4.1 ______________________ _____
Variable Fixed Random Variance p-value
Risk -43273.7 -43285.7 666490.7 0.9882
Dummy (home bias) 14846687.5 14842063.7 198181172.4 0.7426 Dependent variable: Pooled women
_______________________________________________ _______ ______
As can be seen by the Hausman test the random effect model is the best model for this data which is concluded by not rejecting the null hypothesis. This enhances the previous discussion that argued in favour of the random effect model for this analysis. Further, the data in this thesis is characterized as followed N (the number of funds) is larger than T (the number of years) which is consistent with one of the assumptions of the random effect model, hence a support for using a random effect model. (Gujarati, 2003)
The data in the model 4.2 have been tested to see if heteroscedasticity is present. Under the presence of heteroscedasticity the tests will most likely provide inaccurate results due to the fact that the variance of the estimated β will for e.g. become overly large, indicating statistically insignificant coefficient. As a consequence the t-value will be smaller than what is actually true (Gujarati, 2003). On these grounds White’s General Heteroscedasticity test was performed for all the years to assess a possible problem. From the tests it can be concluded that heteroscedasticity is clearly present in regression 4.2 for the years 2002-2003 and for 2006 at a five percent significance level.
Table 5 – White’s General Heteroscedasticity test for equation 4.2 ___________
Year F-value p-value R2 p-value______
2000 0.920541 0.430957 2.770872 0.428317 2001 1.011175 0.387693 3.041022 0.385344 2002 2.892844 0.035177 8.578447 0.035454 2003 4.860278 0.002472 14.21661 0.002625 2004 1.661401 0.174426 4.974432 0.173679 2005 0.608289 0.609844 1.832303 0.607931 2006 4.132470 0.006502 12.21648 0.006677 2007 1.288768 0.277182 3.867053 0.276183 ______________________________________________________________________ If autocorrelation is present the usual t and F tests may not be valid. Testing to see if autocorrelation problem exist is done using the Durban-Watson (DW) d test. (Gujarati, 2003). The obtained DW-statistics ends up in the zone of indecision for autocorrelation, for the years 2000-2001, 2003 and 2007 for the data in regression 4.2 (see table 8). On this basis it cannot be conclude if there exists autocorrelation in the data or not. (See appendix II for DW-statistics figure 1)
There is no evidence of autocorrelation for the years 2002, 2004-2006. Since no regression show any sign of clear autocorrelation no adjustments for this problem have been made. Also central to rule out is multicollineraty as this increases the risk of accepting a false hypothesis, a so called type two error.
The problem can be detected by having overall insignificant t-values while at the same time having high R2
or by studying a correlation matrix to see if the independent variables are excessively correlated against each other (Gujarati, 2003). By looking at the correlation matrix (see appendix I table 5) problem of multicollineraty have been ruled for every year due to low values which indicates no collineraty problem.
4.4
Regression Results
This section discusses the results from the hypotheses testing to see whether women are more risk averse than men and to see if they are more home biased than men. The section is divided into two parts where the first part covers the test of the regression run on equa-tion 4.1. The analysis is then taken to a deeper level with the results from regression on equation 4.2.
The conclusions that were made in section 4.3 stated that the best model for the data in this thesis was a random effect model. Therefore regression 4.1 has been tested according to this and the following results were obtained, see table 6.
Table 6 – Random Effect Regression results for equation 4.1 ___________ Variable Coefficient t-value p-value
Constant 25652930 10.39013 0.0000
Dummy (home bias) 14846688 4.591595 0.0000
Risk -43273.68 -0.410728 0.6813
Dependent variable: % Women R-squared: 0.371057 F-stat. 0.00000 Observations: 701 Adj. R- squared: 0.369597 DW: 1.741401
Cross-sections included: 8 Total:pool(unbalanced) observations:3885
______________________________________________________________________
On a five percent significance level the result from this regression supports a rejection of the hypothesis; there is no evidence that women are more risk averse than men, due to the insignificance of the risk variable. The dummy variable is significant meaning that the origins of the fund have an effect on women. This indicates that women have a tendency to be more home biased. The question however remains what this means? It could be an indication that women are more risk averse than men on this point, they are more likely to invest in domestic funds. However, for the analysis over the individual premium pension choices the information about the risk that each fund inhabits is very clearly stated and it does not always necessarily go hand in hand with the origin of the fund, since the risk is so clerly stated. The conclusion that can be stated is that women are not more risk averse than men but they are more likely to invest in domestic funds.
Before moving on to the investigating the hypotheses separately for every year the pooled data has been examined further in a constrained regression.
A constrained regression is a regression that inhabits the characteristics of a predetermined fixed value of a variable (Bay & Pazzani, 1999). For the analysis of the individual premium
It means that whatever time specific effects there are they are evened out over the entire period for both the risk variable and the home biasedness dummy (Becker, 2002).
The results obtained from that regression are posted below. The regression model suffered from heteroscedasticity and has therefore been adjusted for that in Eviews.
Table 7 – Constrained Regression results for equation 4.1 __________ Variable Coefficient t-value p-value
Constant 27226414 9.171909 0.0000 Dummy (home bias) 12981180 3.219618 0.0013 Risk -109408.9 -1.046684 0.2953
Dependent variable: % Women R-squared: 0.002943 F-stat. 0.003274 Observations: 701 Adj. R- squared: 0.002430 DW:1.097890
Cross-sections included: 8 Total: pool :( unbalanced) observations:3885
________________________________________________________________ As can be seen by table 7 these results support the results extracted from the random effect model. The risk variable is insignificant while the dummy show significance. Indicating the same results as with the random effect model that women are not more risk averse than men but more likely to inhabit home biasedness.
The analysis of the hypothesis is then taken to a deeper level in the regression on equation 4.2 which have been performed to see if time has changed the attitude towards risk among women and if the results from the earlier regression concerning the risk variable hold. Has this attitude changed from the year of 2000 when the first choices were made to the year 2007? Based on the findings in section 4.3 the necessary adjustments for heteroscedasticity according to White Heteroskedasticity-Consistent Standard Errors & Covariance have been made for those years showing evidence of heteroscedasticity. From the given equation the following results were extracted.
Table 8– OLS Regression results for equation 4.2 _________________________
Variable Coefficient t-value p-value 2000 Constant 0.487816 41.64911 0.0000 Dummy (home bias) 0.057299 6.555797 0.0000 Risk -0.003344 -3.931737 0.0001
Dependent variable: % Women R-squared: 0.170579 F-stat. 0.00000 Observations: 371 Adj. R- squared: 0.166072 DW: 1.341660 ______________________________________________________________________ 2001 Constant 0.502357 31.55104 0.0000 Dummy (home bias) 0.0000 4.430175 0.0000 Risk -0.000228 -0.207630 0.8356
Dependent variable: % Women R-squared: 0.051629 F-stat: 0.000033 Observations: 392 Adj. R- squared: 0.046753 DW: 1.509959 _____________________________________________________________________
2002 Constant 0.452060 28.18361 0.0000 Dummy (home bias) 0.064658 4.783290 0.0000 Risk -0.000222 -0.217843 0.8277
Dependent variable: % Women R-squared: 0.053694 F-stat: 0.000017 Observations: 401 Adj. R- squared: 0.048938 DW: 1.890152 _______________________________________________________________________ 2003 Constant 0.521787 26.89366 0.0000 Dummy (home bias) -0.028133 -1.363089 0.1736 Risk -0.003449 -2.140226 0.0629 Dependent variable: % Women R-squared: 0.015933 F-stat: 3.319191 Observations: 413 Adj. R- squared: 0.011133 DW: 1.666323 _____________________________________________________________________ 2004 Constant 0.496275 20.63655 0.0000 Dummy (home bias) -0.010461 -0.519069 0.6039 Risk -0.001242 -0.688553 0.4914 Dependent variable: % Women R-squared: 0.001627 F-stat: 0.666639 Observations:501 Adj. R- squared: -0.002382 DW: 1.732527 _____________________________________________________________________ 2005 Constant 0.479953 17.63673 0.0000 Dummy (home bias) 0.047036 2.159858 0.0312 Risk -0.003844 -1.975433 0.0587 Dependent variable: % Women R-squared: 0.018836 F-stat: 0.006297 Observations:536 Adj. R- squared: 0.015155 DW: 1.836815 _____________________________________________________________________ 2006 Constant 0.472539 15.69909 0.0000 Dummy (home bias) 0.008547 0.363273 0.7165 Risk -0.001504 -0.703183 0.4822 Dependent variable: % Women R-squared: 0.001334 F-stat: 0.006862 Observations:567 Adj. R- squared: 0.002207 DW: 1.895239 _____________________________________________________________________ 2007 Constant 0.455800 43.71213 0.0000 Dummy (home bias) 0.039124 3.697111 0.0002 Risk -0.001444 -1.915091 0.0559 Dependent variable: % Women R-squared: 0.048135 F-stat: 0.000000 Observations:690 Adj. R- squared: 0.045364 DW: 1.463349 ____________________________________________________________________
For the first year 2000 women show more risk aversion than men. Both the risk variable and the dummy variable show significant result, hence a non-rejection of the null hypothe-sis is a fact for the first years of the individual choice system.
For the remaining years 2001-2007 the risk variable show no significance meaning that there are no statistical evidence in this regression showing that women are more risk averse than men, on a five percent significance level, enhancing the results from regression 4.1 The dummy variable shows insignificant results for the years 2003-2004 and 2006 which
Some of the numbers are close to the five percent level but still show insignificance. This is consistent with the findings in regression 4.1 leading to a rejection of the hypothesis, there is no evidence indicating that women are more risk averse than men.
The dummy indicating home biasedness is significant for the year 2000-2002, 2005 and 2007 in regression 4.2. Enhancing the results extracted from regression 4.1. An explanation to this could be as stated earlier that women and men differ somewhat in their attitude to-wards domestic versus foreign investment.
To conclude the empirical part the two regressions indicate that women are not more risk averse than men. However, there seems to be a difference between men and women when it comes to investing domestically or not. Hence, a non-rejection of the hypothesis that women are more home biased than men. However, based on these results a rejection of the hypothesis that women are more risk averse is a fact.
5. Analysis
The following section analyses the results presented in the previous sections to tie the given results to the thesis theoretical framework
The hypotheses have been analysed through regressions by testing a risk and a home biasedness variable (dummy) against the number of women choosing. The information concerning these variables was available to all individuals through the distribution of the oranga kuvertet.
Through the rejection of the hypothesis it can be concluded ,with the analysis of the allocation choice of individual investment in the Swedish Premium Pension system, that women are not more risk averse than men.
Studying the individual premium pension choices has allocated a more fair indication and reflection of men and women´s risk attitude today. The reason being the advantage with this data. It is representative, which is a one of a kind opportunity in Sweden when studying this subject. Previous research untangling this issue has many times been based upon a field study of some kind. With this type of analysis problems like a homogenous population, people not facing any real consequences concerning their choices will occur. Hence, one can say that previous research that have concluded that women are more risk averse is suffering from inaccurate results due to the biasedness in the empirical analysis.
The regressions showed indication that women are more home biased than men, hence a non-rejection of the second hypothesis
As previously mentioned the number of women employed by the public sector are a much higher than the number of men and they have a tendency to be more home biased for the reasons explained in the theoretical section. As also mentioned in the theoretical section the home biasedness seem to be more affected by e.g. education, income, employment and overconfidence than it is affected by the risk preference. Due to the unavailability in the dataset from Premium Pension Authority it was not possible to test this statistically. How-ever, adding all these factors together could help to explain why the dummy shows signifi-cance for regression 4.1 and also why it shows signifisignifi-cance for certain years in regression 4.2. One other explanation to the significance of the dummy variable could be that of world events taking place these specific years affecting the individual choosing. Even though that is not the focus of this thesis it is still worth mentioning to help explain the significance of the dummy for certain years.
When further analysing the hypotheses the data was tested on a yearly basis to test if there had been any attitude changes. This showed that as the new pension system was emerged women were more risk averse than men, through the significance of both the risk and the
Why women are showing more risk aversion the first year can be explained by the following. First of all the system was new and at that time there were a larger gap between men and women. With this gap I mean, as discussed in the theoretical section, the difference between the number of e.g. educated and high income men and women (Engström & Westerberg, 2003). The research supporting the hypothesis that men are more prone to take on riskier investments are somewhat older than the research supporting the opposite. This fact means that there could exist a statistical discrimination towards women as previously stated (Brachinger. et al, 1999). The following years the results show insignificance in the risk variable enhancing the results from the random effect as well as the constrained model. The number of women that are well educated logically increases on a yearly basis as the number of persons subject to choosing increases every year (ppmg). The theoretical section supports the findings that women are not more risk averse when it comes to the individual premium pension choices (Palme. et al, 2005). The statistical advantage that comes with the investigation of the individual allocation choices makes the conclusion that there are no indications supporting that women are prone to invest in more safe assets reliable.
The dummy variable that signals home biasedness showed to be significant for the year 2000-2002 and also for the years 2005 and 2007 in regression 4.2. For the random effect model as well as the constrained regression the dummy is also significant which would indicate that women are more home biased than men. The significance can be explained by the following. It has been stipulated that the public sector employer is more home biased. The number of women employed by the public sector still exceeds the number of men (Eriksson, 2005) which would help to explain the significance that the dummy variable shows in the regressions. The insignificance for some of the years in regression 4.2 would to a stronger point show that there are is difference between men and women regarding individual investment choices.
To summarize the analysis chapter of this thesis it has been proven that there on average is no difference between men and womens attitude towards risk in individual allocation choices, this with the reliable data showing insignificant results for the risk variable. On the other hand there exists a significant difference between men and womens attitude towards home biasedness. However, that can be explained by the influence of other factors.
6
Conclusion
The subject of men and women´s attitude towards risk has been thoroughly discussed in previous research. It has been argued many times that women inhabit more risk aversion than men, which has lead to the fact that they are doubted in their ability to make necessary risky decisions in managing e.g. company. It will also have a negative effect on their future income if they have a tendency to invest more conservatively than men. Therefore this is an important subject to untangle much due to the huge impacts it has if it is true that women are more risk averse.
The purpose of this thesis was to examine whether women are more risk averse than men when it comes to individual investment decisions, using the data covering individual allocation choices within the premium pension system. To investigate this question two hypotheses was formulated and tested empirically. The first one being are women more risk averse than men and the second are there any indication that women have a tendency to be more home biased than men
The first regressions indicated that women are not more risk averse than men but that they are more home biased. Hence a rejection of the hypothesis that women are more risk averse than men but a non-rejection of the hypothesis that they are more home biased. The ordinary least squares regression tests separately for each year. That regression also supports a rejection of the hypothesis through the insignificance of the risk variable as well as the home biasedness dummy for a number of years.
Based on these results the conclusions for this thesis is that there is no evidence supporting that women are more risk averse than men. They are however more concerned about the origin of the fund, which enables me to agree with the previous research stating this fact.
Suggestions for further studies would be to study the impact that the fact that women are not more risk averse than men has on women in corporate positions. To investigate how these conclusions can help women in corporate positions. It would also be interesting to further investigate what the affect of women being more home biased than men are, when available data for that appears in e.g. the individual premium pension choices. Another suggestion is to study if this fact has lead to an increase in private investments made by women in e.g. the insurance business.
References
Arellano, M. (2003). Panel Data econometrics: Advanced Texts in econometrics. Department of Oxford University Press. University of Oxford. New York.
Bay, S., Pazzani, M. (1999) The Independent Sign Bias: Gaining Insight from Multiple Linear Regression. Department of Information and Computer Science. University of California.
Becker, T. (2002). The Mathematics of Returns-Based Style Analysis. In Determining a Funds Effective Asset Mix. Investment Management Review pp. 59-69.
Brauchinger, H., Brown, M., Gysler, M., Schubert, R (1999). Financial Decision-Making: are women Really More Risk-Averse? The American Economic Review vol 89 pp. 381-385. American Economic Association
Barber, B., Odean, T. (1999). Boys will be boys: Gender, Overconfidence, and Common Stock Investment. University of California.
Brantmo, D. (2001). Premiepensions riskjusterade avkastning. Nationalekonomiska institutionen. Stockholms universitet
Carlsson, F., Daruvala, D., Johansson-Steinman. (2003). Are people inequality-Averse or Just Risk-averse? Econometrica vol 72 p. 375-396. The London School of Economics and Political Science
Engström, S., Westerberg, A. (2003). Which individuals make an active investment decision in the new Swedish pension system? Cambridge University Press
Eriksson, H. (2005). Ett Jämställt Arbetsliv. Svenskt Näringsliv
Gujarati, D.N. (2003). Basic Econometrics. McGraw-Hill Higher Education. Fourth Edition Karlsson, A.(2004). Investment Decisions and Risk Preferences among Non-Professional Investors.
Licentiate Dissertation. School of Business. Stockholm University.
Karlsson, A., Nordén, L (2004). Home Sweet Home: Home Bias and International Diversification among Individual Investors. .Licentiate Dissertation. Department of Corporate Finance. School of Business. Stockholm University.
Kawakatsu, H. (1998). Econometric Models and Econometric Forecasts- A Computer Handbook using Eviews. McGraw-Hill Higher Education. Fourth Edition
Madrian, b., Shea, D. H. (2000). The Power of Suggestion: Inertia in 401 (k) Participation and Savings Behavior. University of Chigaco
Palme, M., Sundén, A., Söderlind, P. (2005). Investment Choice in the Swedish Premium Pension Plan. Center for Retirement Research at Boston College, USA
Paulsson, T. (2001). Decision-making, Risk and Utility Assessments and Applications of Alternitive Decision Models. JIBS Dissertation Series No. 011
SOU, (2005). Svårnavigerat? Premiepensionssparande på rätt kurs. Statens offentliga utredningar 2005:87. Edita Sverige AB. Stockholm
Sundén, A., Surette (1998). Gender Differences in the Allocation of Assets in Retirement Savings plans. The American Economic Review Vol. 88 No. 2. pp 207-211. American economic Association.
Säve-Söderbergh, J. (2003a). “Pension Wealth: Gender, Risk and portfolio choices Dissertation series, No. 59, The Swedish Institute for Social Research, Stockholm University.
Säve-Söderbergh, J. (2003b). Self-directed Pensions: Gender, Risk and Portfolio Choices. Dissertation series, No. 59, The Swedish Institute for Social Research, Stockholm University.
Skoglund, J (2001). Essays on Randome Effects Models and GARCH. Stockholm School of Economics, Stockholm
Internet Sources
Försäkringskassans Webpage. Retrieved 2007-04-04
http://www.forsakringskassan.se/omfk/analys/pension/alder/#nya PPM Webpage. Retrieved 2007-02-28 http://www.ppm.nu/tpp/infodocument/1:1;200061; ppma http://www.ppm.nu/tpp/infodocument/1:1;201306,201494,201495 ppmb http://www.ppm.nu/tpp/infodocument/1:1;201412 ppmc http://www.ppm.nu/tpp/infodocument/1:1;201415 ppmd http://www.ppm.nu/tpp/infodocument/1:1;201306,201494,201495 ppme http://www.ppm.nu/tpp/infodocument/1:1;201413 ppmf http://www.ppm.nu/tpp/infodocument/1:1;218,100025;: ppmg http://www.ppm.nu/tpp/infodocument/1:1;201397,201388, ppmh
Appendix 1– Tables
Table 1 – Pooled Least Squared regression results
Dependent Variable: (WOMEN?) Method: Pooled EGLS (Period weights) Date: 04/13/07 Time: 12:05
Sample: 1 701
Included observations: 701 Cross-sections included: 8
Total pool (unbalanced) observations: 3885 Linear estimation after one-step weighting matrix
White cross-section standard errors & covariance (d.f. corrected)
Variable Coefficient Std. Error t-Statistic Prob. RISK? 23201.88 4210.400 5.510612 0.0000 NATIONALITY? 1437507. 220593.3 6.516550 0.0000
Weighted Statistics
R-squared 0.001360 Mean dependent var 20623389 Adjusted R-squared 0.001103 S.D. dependent var 79568423 S.E. of regression 82102936 Sum squared resid 2.62E+19 Durbin-Watson stat 0.974139
Unweighted Statistics
R-squared -1.353529 Mean dependent var 30748390 Sum squared resid 6.17E+19 Durbin-Watson stat 1.034321
Table 2 – Total regression results for mean test on equation 4.1 (nationality)
Dependent Variable: @MEAN WOMEN Method: Pooled Least Squares
Date: 03/29/07 Time: 14:15 Sample: 1 701
Included observations: 701 Cross-sections included: 8
Variable Coefficient Std. Error t-Statistic Prob. @MEAN NATIONALITY 63773206 2396793. 26.60773 0.0000 R-squared -0.014731 Mean dependent var 26242859 Adjusted R-squared -0.014731 S.D. dependent var 69438269
S.E. of regression 69947864 Akaike info criterion 38.96458 Sum squared resid 2.74E+19 Schwarz criterion 38.96576 Log likelihood -109255.7 Durbin-Watson stat 0.000000
Table 3 – Total regression results for mean test on equation 4.1 (risk)
Dependent Variable: @MEAN WOMEN Method: Pooled Least Squares
Date: 03/29/07 Time: 14:16 Sample: 1 701
Included observations: 701 Cross-sections included: 8
Variable Coefficient Std. Error t-Statistic Prob. @MEAN RISK 2002043. 72500.27 27.61428 0.0000 R-squared -0.006037 Mean dependent var 26242859 Adjusted R-squared -0.006037 S.D. dependent var 69438269 S.E. of regression 69647544 Akaike info criterion 38.95597 Sum squared resid 2.72E+19 Schwarz criterion 38.95715 Log likelihood -109231.5 Durbin-Watson stat 0.000000
Table 4 – Hausman test on equation 4.1
Hausman Test Pool: WOMEN
Test cross-section random effects
Test Summary Chi-Sq. Stat. Chi-Sq. d.f. Prob. Cross-section random 0.110246 2 0.9464
Cross-section random effects test comparisons:
Variable Fixed Random Var(Diff.) Prob. (RISK?) -43273.675 -43285.70514 666490.67694 0.9882 NATIONALITY? 14846687.5 14842063.7006 198181172.455 0.7426