Research Report :
Simulation of railway track geometry and intelligent maintenance planning
Simulering av järnvägsspårgeometri och intelligent underhållsplanering
Abbreviation: SIMTRACK
BVFF Call
Project leader
:
:
Proposal category II-2017
Alireza Ahmadi
Prepared and submitted on
:
2017-03-31
Project duration
:
2017-12-01 – 2020-12-31
Target portfolio 4
:
Robust and dependable infrastructure
Contact at Trafikverket (TRV) :
Dr. Arne Nissen
Project team:
Arne Nissen
TRV-TrafikverketAlireza Ahmadi
LTU-Luleå tekniska universitetet-Drift och underhål
Ramin Karim
LTU-Luleå tekniska universitetet-Drift och underhål
Adithya Thaduri
LTU-Luleå tekniska universitetet-Drift och underhål
Stephen Famurewa
LTU-Luleå tekniska universitetet-Drift och underhål
Iman Soleimanmeigouni
LTU-Luleå tekniska universitetet-Drift och underhål
Uday Kumar
LTU-Luleå tekniska universitetet-Drift och underhål
Mikael Åstrand
Infranord
Roland Bång
Infranord
Background
Track is the fundamental part of railway infrastructure and represents a significant part of maintenance effort and cost. For example, in Sweden, annual maintenance cost for only track geometry is between 110 and 130 MSEK. The quality of the track, mostly, is represented by the track geometry properties. Track geometry degrades with age and usage; and loses its functionality over time. Poor quality of track geometry may result in safety problems, speed reduction, traffic disruption, greater maintenance cost and higher degradation rate of the other railway components (e.g. rails, wheels, switches and crossings). Railway track maintenance program development is challenging and requires appropriate modelling which reflects the real life scenario and integrates influencing factors. In addition, there are several uncertainties in data collection, data analysis, modelling and prediction that are needed to be considered. Moreover, there is a lack of integrated platform that is able to access geometry data, extract associated information, and retain this knowledge for supporting adaptive maintenance planning and scheduling. The above challenges necessitate Infrastructure Manager (IM) to employ a maintenance management system that enables higher capacity for evaluation of track performance, learning from asset history, context driven awareness, planning & scheduling, and transformation of this information to knowledge for decision making.
Aim
The SIMTRACK project will facilitate simulation-based platform that enables development of a tools, methodologies and techniques for optimization of track geometry maintenance planning, scheduling and opportunistic maintenance. This will provide a basis to predict track geometry degradation, analyse the risk of failures and forecast the maintenance activities as well as renewal investment requirements. The results will enhance safety, maximize capacity utilization, and lead to an efficient and cost effective maintenance program.
Project structure
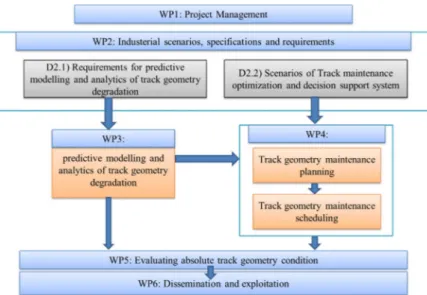
SIMTRACK is structured into 6 work packages. WP1 deals with the project management. WP2 presents the industrial scenarios, specifications and requirements that provide inputs to WP3 and WP4. WP3 and WP4 are defined as predictive modelling and analytics of track geometry condition and track maintenance optimization and decision support system respectively. WP5 is dedicated to evaluation of absolute track geometry condition. Finally, WP6 deals with dissemination and exploitation, is devoted for formulating comprehensive plans for results assimilation by the partners and set the ground for the exploitation. Figure 1 shows the work packages and their relationships.
Figure 1. Description of WPs and their relations
In order to select applicable and effective inspection and maintenance plans, track geometry degradation needs to be predicted using appropriate models and methodologies. However, modelling and predicting the track geometry degradation is a complex task. The complexity arises from the fact that different track sections represent different types of degradation behaviour over time. Thus, proper approaches should be employed to deal with these challenges. In addition, there are several interactions between different track components, which need to be understood.
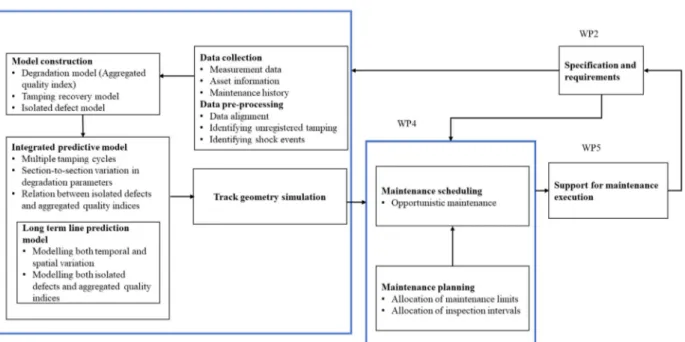
The short and long-term behaviour of track requires stochastic modelling approaches. These include modelling for: 1) temporal evolution of track geometry condition, 2) the spatial variation in degradation parameters, 3) possible spatial dependences among track segments, 4) occurrences of isolated defects, 5) shock events and change point detection, and 6) maintenance effects and tamping recovery. There are existing models for evaluating and predicting each behavioural pattern mentioned above; however, there is need to develop a holistic approach that integrates all of them. These issues are covered within WP3. Using the integrated model developed in WP3, infrastructure managers are able to predict the maintenance needs and compare different maintenance scenarios. This will support maintenance decision making process to achieve the final objective which is identifying the time and location for conduction of tamping intervention to keep geometry condition in desirable level which minimizing the cost, risk, and unavailability. This objective is achieved by developing an opportunistic maintenance scheduling algorithm. The geometry maintenance optimization algorithm and decision support system are developed in WP4. Figure 2 represents the framework of the Simtrack project.
Figure 2. Framework of Simtrack project Project outputs
A summary of the main outputs of Simtrack project is presented in this document. Generally, the datasets recorded in different inspection runs suffer from positional errors. Figure 3 shows two datasets of longitudinal level collected in two different inspections with shifts at first, middle, and end of two dataset, respectively. Each dataset not only may have different start positions, which causes constant shift between datasets, but also they may be stretched or compressed with respect to each other. Furthermore, missing a part of the datasets will cause incomplete measurements. Since the aim of the predictive models in this project is to predict the occurrence of specific-location defects, it is of great importance to reduce positional errors before developing the models. This is done by applying an alignment method which is a combination of COW and RAFFT algorithms. The performance of the method is checked considering two criteria, i.e. simplicity and peak factor. These criteria will specify how the alignment method is precise and keep the original shape of measurements. With respect to the criteria, it is concluded that the developed combined alignment method is flexible to address both constant and non-constant shifts between two datasets which keeping the original shape of measurements. Figure 3 show two measurements from different inspection before alignment and after applying the combined alignment method.
(a)
Longitudinal Level (
m
m
(b)
Figure 3. Example measurement before (a) and after (b) data alignment
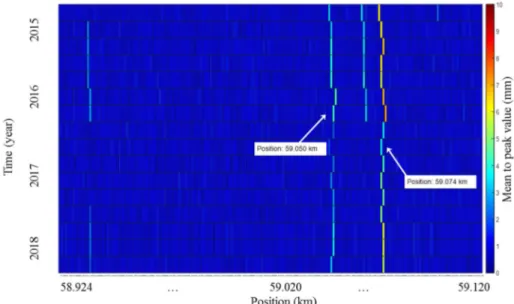
After performing data alignment, a main step towards prediction of track geometry condition is to predict the occurrence of isolated defects. Isolated defects are short irregularities in the track geometry that can dramatically increase the dynamic forces between the wheel and rail and cause damage in other track components. Within the project two models, i.e. defect-based and section-based are developed to predict the occurrence of isolated defects. The aim of defect based mode is to model the changes in defect’s amplitudes over time, see Figure 4. By considering longitudinal level and twist as the main parameters for maintenance planning, defect-based model predicts the changes in the amplitude of longitudinal level and twist defects over time.
Figure 4. Heat map of longitudinal level at a sampling interval of 25 cm
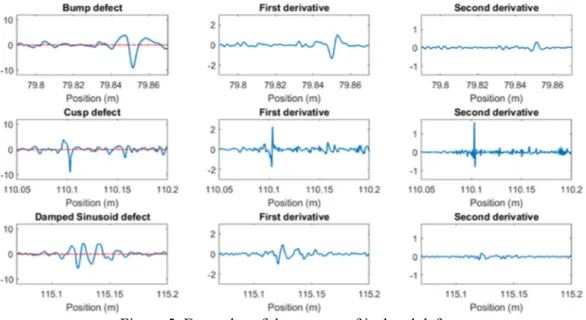
It is found that isolated defects of twist and longitudinal level have a linear pattern over time. In addition, it was observed that for around 35% of the sections with an isolated longitudinal level defects, after a tamping intervention a defect occurred again at the same position. This shows that in many cases, spot tamping using tractors and lightweight machines or tamping machines cannot remove the root causes of defects. It must be noted that both amplitude and shape of defects are important factors to prioritize the severity of isolated defects. In this regard, we take advantage of the first and second order derivatives of original defects to identify the severity of isolated defects. It is found that the first and second order derivatives of defects can properly be used to identify shape and severity of defects, see Figure 5. These results will be used to classify the isolated defects and to prioritize track sections for planning local maintenance activities. Longit udinal Lev el (m m )
Figure 5. Examples of three types of isolated defects
Since the interest of infrastructure managers is to plan maintenance activities based on overall condition of track sections rather than isolated defects, a section-based model is developed within the project. The section-based model predict the occurrence of isolated defects by considering the aggregated quality indices as explanatory variable. In this regard, binary logistic regression as a well-known machine learning classifier is applied. The results show that there is a significant relation between the value of standard deviation and kurtosis of geometry parameter and occurrence of isolated defects, see Figure 6. This information can be used to plan maintenance activities by considering the probability of occurrence of isolated defects in different track sections.
Figure 6. Relation between aggregated quality indices and isolated defects
In order to model the evolution of standard deviation of longitudinal level, as the main aggregated quality index for planning tamping activities, a two-level piecewise linear model was developed. This model consider the breakpoint after tamping intervention and the possible spatial dependence between adjacent track sections. In order to model the changes in degradation pattern after tamping intervention two multivariate linear regression models are developed to link different covariates with the responses, i.e. the recovery values and changes in the degradation rates after a tamping action. At the second level, autoregressive moving average (ARMA) models are used to capture the spatial dependence in the parameters of the regression lines indexed by their locations. The developed two level piecewise model can be used to simulate track geometry degradation for multiple tamping cycles and track sections. Figure 7 shows an example of track geometry degradation over a track line.
Kurtos is of longitudinal level 0 200 400 600 800 1000 Position (m) -10 0 10 Longit udinal level (m m
) Track section "a"
-15 -10 -5 0 5 10 Longitudinal level (m) 0 0.2 0.4 0.6 Densit y est im at e
Track section "a"
Kurtosis: 19.9415 Std: 1.4523 0 200 400 600 800 0 200 400 600 Position (m) -10 0 10 Longit udinal level (m m ) Track section "b" -15 -10 -5 0 5 10 Longitudinal level (m) 0 0.2 0.4 0.6 Densit y est im at e Track section "b" Kurtosis: 5.7699 Std: 2.4603 0 200 400 600 0 200 400 Position (m) -10 0 10 Longit udinal level (m m ) Track section "c" -15 -10 -5 0 5 10 Longitudinal level (m) 0 0.2 0.4 0.6 Densit y est im at e Track section "c" Kurtosis: 3.0534 Std: 0.70199
Figure 7. Track geometry degradation over a track line
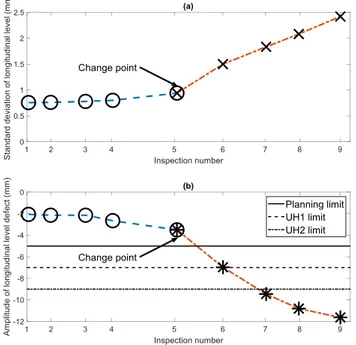
A preliminary analysis of the evolution of the standard deviation of the longitudinal level shows that for a small number of maintenance cycles there is an abnormal degradation behaviour. This phenomenon is attributed to the occurrence of shock events, see Figure 8. Since the degradation rate dramatically increase after occurrence of shock events, those track sections must be considered with highest priority for planning maintenance actions.
Figure 8. Irregular trend in the track geometry degradation path
As it is mentioned before, an important step towards simulate and predict track geometry degradation is to identify and model the section-to-section variation in degradation parameters. Figure 9 shows an example of variety in degradation parameters over a track line.
Figure 9. The variation in the track geometry degradation rate along the track
1 2 3 4 5 6 7 8 9 Inspection number 0 0.5 1 1.5 2 2.5 Standard deviation of longitudinal level (m m ) (a) 1 2 3 4 5 6 7 8 9 Inspection number -12 -10 -8 -6 -4 -2 0 Am plitude of longitudinal level def ect (m m ) (b) Planning limit UH1 limit UH2 limit Change point Change point
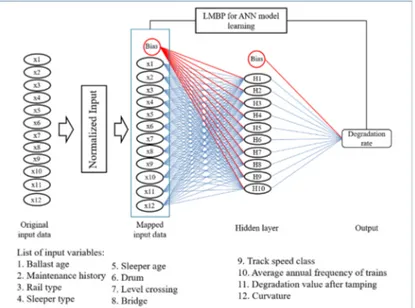
In order to predict the track geometry degradation rate in different locations of track, Artificial Neural Network (ANN) model is applied. In this regard, the spatiotemporal information of track was taken into account and different features of track sections were considered as model input variables, see Figure 10. It is found out that the ANN has an acceptable capability in explaining the variability of degradation rates in different locations of track. In addition, it is found that the maintenance history, the degradation level after tamping, and the frequency of trains passing along the track have the strongest contributions among the considered set of features in prediction of track geometry degradation rate.
Figure 10. ANN model architecture
The output of the ANN model not only will provide a more accurate prediction of degradation rate, but also support decision making process by identifying those factors which have a significant effect on degradation rate.
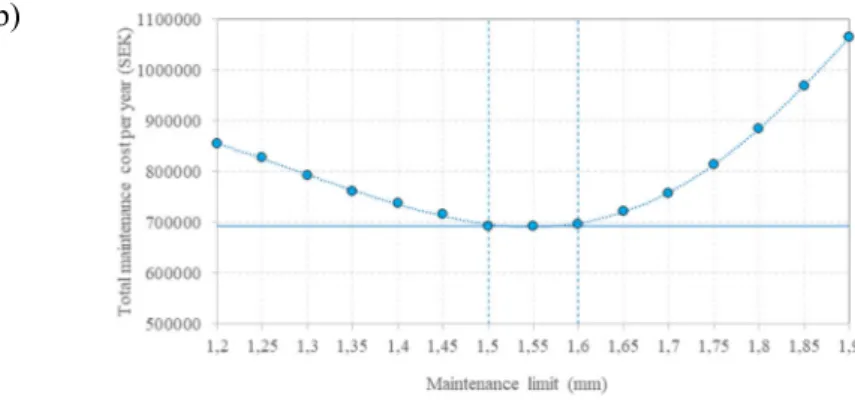
The proposed predictive models within the project are used to simulate long-term track geometry behaviour considering different maintenance and inspection scenarios. One of the key steps in defining maintenance strategy is allocation of a proper maintenance limit to trigger preventive maintenance actions. The objective is to find a planning limit so that the total cost of maintenance would be minimized while keeping geometry condition in the acceptable level. Using the developed simulation framework the expected cost of different planning limits will be estimated and compared to find the most efficient one, see Figure 11.
(b)
Figure 11. Example of simulation results for comparison of maintenance limits. (a) simulation result for a maintenance limit (b) total expected costs for different maintenance limits
In addition to setting the planning limit, applying an adequate inspection interval is vital to ensure the availability, safety and quality of the railway track, at the lowest possible cost. Therefore, another simulation framework was developed within the project to investigate the effect of different inspection intervals on the track geometry condition. Figure 12 demonstrates a schematic view of the framework for assessment of inspection plan.
Figure 12. A schematic view of simulation framework
Based on the results obtained, it was observed that varying the length of the inspection intervals has a significant effect on the percentage of time spent by the track in different longitudinal level states. It must be noted that the proposed framework can also be used to predict the number of different maintenance actions.
The final aim of the decision support system is to propose an opportunistic scheduling plan that minimize the total maintenance costs while keep track geometry condition in an acceptable level. To achieve this, the track geometry tamping scheduling problem was defined and formulated as a mixed integer linear programming (MILP) model and a genetic algorithm was used to solve the problem. Figure 13 shows an example of optimal tamping scheduling considering the opportunistic maintenance concept.
Some of the results obtained are as follow: 1) different scenarios for controlling and managing isolated defects will result in optimal scheduling plan 2) to achieve more realistic results, the speed of the tamping machine and the unused life of the track sections should be considered in the model 3) ignoring the destructive effect of tamping in prediction of geometry condition will cause an underestimation of the maintenance needs by about 2%.
List of publication
Soleimanmeigouni, I., Xiao, X., Ahmadi, A., Xie, M., Nissen, A., & Kumar, U. (2018). Modelling the evolution of ballasted railway track geometry by a two-level piecewise model. Structure and Infrastructure Engineering, 14(1), 33-45.
Soleimanmeigouni, I., Ahmadi, A., Nissen, A., & Xiao, X. (2020). Prediction of railway track geometry defects: a case study. Structure and Infrastructure Engineering, 16(7), 987-1001. Soleimanmeigouni, I., Ahmadi, A., Khajehei, H., & Nissen, A. (2020). Investigation of the
effect of the inspection intervals on the track geometry condition. Structure and Infrastructure Engineering, 16(8), 1138-1146.
Soleimanmeigouni, Iman. Predictive Models for Railway Track Geometry Degradation. Diss. Luleå University of Technology, 2019.
Khajehei, H., Ahmadi, A., Soleimanmeigouni, I., & Nissen, A. (2019). Allocation of effective maintenance limit for railway track geometry. Structure and Infrastructure Engineering, 15(12), 1597-1612.
Khajehei, H., Haddadzade, M., Ahmadi, A., Soleimanmeigouni, I., & Nissen, A. (2020). Optimal opportunistic tamping scheduling for railway track geometry. Structure and Infrastructure Engineering, 1-16.
Khajehei, H, Soleimanmeigouni, I., Ahmadi, A., Nissen, A.,& Haddadzade, M. “Application of First- and Second-Order Derivatives of Track Irregularity to Plan Local Maintenance Activities” 29th European Safety and Reliability Conference (ESREL 2019), 22-26 September, 2019, Hannover, Germany
Khajehei, H, Ahmadi, A., Soleimanmeigouni, I., Haddadzade, M., Nissen, A.,& Latifi Jebelli, M. “Prediction of track geometry degradation using Artificial Neural Network: a case study”, Submitted for publication
Kosravi, M., Soleimanmeigouni, I., Ahmadi, A., & Nissen, A. “Alignment of Track Geometry Measurement via Relative Position-Based Methods: A Comparative Study”, To be submitted
