J
Ö N K Ö P I N GI
N T E R N A T I O N A LB
U S I N E S SS
C H O O LJÖNKÖPI NG UNIVER SITY
M u t u a l F u n d P e r f o r m a n c e
Active- and Passive Fund Management
Paper within Bachelor thesis in economics Author: Alireza Kazemi
Tutors: Johan Klaesson Johanna Palmberg Jönköping 2007-11-15
I
N T E R N A T I O N E L L AH
A N D E L S H Ö G S K O L A NHÖGSKO LAN I JÖNKÖPI NG
F o n d f ö r v a l t n i n g
Aktiv- och Passive Fondförvaltning
Kandidatuppsats inom Nationalekonomi Författare: Alireza Kazemi
Handledare: Johan Klaesson Johanna Palmberg Jönköping 2007-11-15
Bachelor theis in economics
Title: Mutual fund performance – Active and Passive Fund Management Author: Alireza Kazemi
Tutors: Johan Klaesson Johanna Palmberg
Date: 2007-11-15
Subject terms: Mutual funds, Performance, Jensen’s Index
Abstract
In this thesis I will examine active equity mutual fund managers’ ability to outperform an index, which is done by utilizing a sample of four equity mutual funds that mainly invest in large Swedish quoted companies. In order to measure the risk-adjusted performance of the funds, a model created by Michael Jensen will be used. Furthermore, I will investigate whether the managers of the mutual funds increase/decrease the risk level, or rather the beta, when the stock market is bullish/bearish. Hence, two time spans have been chosen, 2001-2003 and 2004-2006, where the previous represents a bearish stock market and the later represents a bullish stock market.
The empirical evidence indicates that one fund in each period was significantly outper-formed by the comparable index. Furthermore, the result also suggests that two significant funds were talking more risk than the index in the bearish time period while three signifi-cant funds decreased the risk level during the bullish time period.
Kandidatuppsats inom Nationalekonomi
Titel: Fond Prestation – Aktiv och Passiv Fondförvaltning Författare: Alireza Kazemi
Handledare: Johan Klaesson Johanna Palmberg
Datum: 2007-11-15
Nyckelord: Fonder, Fondförvaltare, Förvaltning, Jensen’s Index
Sammanfattning
Denna kandidatuppsats undersöker aktiva fondförvaltares förmåga att upptäcka och inve-stera i fonder som preinve-sterar bättre än deras jämförekse index. Undersökningen är baserad på fyra aktiefonder som huvudsakligen investerats i Svenska börsnoterade företag. Fonder-nas riskjusterade prestation kommer att mätas med hjälp av en modell som är utformad av Michael Jensen.
Vidare kommer uppsatsen att undersöka om fondförvaltarna ökar eller minskar risk nivån, eller betavärdet, baserat på börsens utveckling under åren 2001-2003 och 2004-2006. Det förgående intervallet representerar en sjunkande börsperiod och det senare en stigande börsperiod.
Det empiriska resultatet indikerar att en signifikant fond i varje tidsintervall presterade säm-re än index. Utöver detta visade även säm-resultatet att två signifikanta fonder ökade risk nivån, jämfört med index, i den sjunkande börsperioden medan tre signifikanta fonder minskade risk nivån i den stigande börsperioden.
Table of Contents
1
Introduction... 1
1.1 Method & limitations ...2
1.2 Previous research...2
1.3 Background ...3
2
Theoretical framework... 4
2.1 Diversification theory ...4
2.2 Efficient market hypothesis...5
2.3 Active- and passive fund management...6
2.4 Jensen’s alpha ...8
3
Data... 10
4
Null- and alternative hypotheses ... 12
4.1 Empirical analysis...13
5
Conclusion ... 17
5.1 Further studies ...18
1
Introduction
During recent years the development of mutual funds has increased dramatically in Swe-den. The households invest large sums in mutual funds every year, contributing to the de-velopment of new funds. In 2004 the Swedish population had 546 206 million Swedish crowns in equity mutual funds compared to 963 520 million Swedish crowns in 2006, which is an increase of almost 50 per cent over a two year period (Fondbolagen.se, 2007). One of the reasons for these developments is the profitable stock market, which has in-duced the households to invest in both stocks and mutual funds. Another reason is the poor results in pensions that have encouraged private investments (Haskel, 1998).
Brealey et. al (2004) discuss how equity mutual funds are used for investments in a large portfolio of securities. Investors buy shares of the mutual fund and thereby receive a diver-sified portfolio, which usually cannot be constructed by a single investor alone. Hence, eq-uity mutual funds raise money by selling shares to investors and then pool the money to invest in a portfolio of securities. The advantages of mutual funds for investors are low-cost diversification and professional management. In actively managed funds, managers try to “beat the market” by finding the stocks that generate higher than the average return. Passive management, or index-tracking, on the other hand are funds that are based on an index and the value of the fund fluctuates according to changes on the index. Generally, the fees paid by investors for an active fund is higher than those paid for an index fund. In this thesis I will examine active equity mutual fund managers’ ability to outperform an index. In order to measure the risk-adjusted performance of the funds, a model created by Michael Jensen will be used. This model is known as Jensen’s alpha and the purpose is to compute a portfolio deviation from the security market line, which is based on the Capital Asset Pricing Model (CAPM). Furthermore, I will examine whether the managers of the mutual funds change the risk level, or rather the beta, according to the state of the stock market. This is done by investigating two time spans, 2001-2003 and 2004-2006, where the earlier period represents a bearish stock market and the later represents a bullish stock mar-ket.
The purpose of this thesis is to see how well the mutual fund managers perform on each individual mutual fund compared to the market index. Two time spans will be chosen and the funds will be examined to see if the risk level of the funds changes during different stages of the stock market. Thus, the two questions to examine are:
- Does an actively managed equity mutual fund outperform the passively managed portfolios that are based on an index?
- Do equity mutual fund managers increase/decrease the risk level, or rather the beta, when the stock market is bullish/bearish?
In the first section I have introduced the purpose of this thesis and the two questions that I will investigate. The methodology, previous studies and a brief background about mutual funds will also be introduced. The second section will consist of diversification theory, effi-cient market hypothesis, active- and passive fund management and Jensen’s alpha. Part one will give an insight of the implication and importance of diversification in a portfolio while the next part deals with the different types of market efficiency and the concept of over- and undervalued stocks. This will be followed by active- and passive fund management,
which will emphasize active strategies and passive methods. Finally, the last part will dis-cuss the model used to measure the risk-adjusted performance of the funds and exhibit the relationship between Jensen’s alpha and CAPM. The third section will briefly describe the funds chosen and their comparable index while section four will convey the null- and alter-native hypotheses and the result from the regression analysis, which will be interpreted and analysed. Finally, section five will entail a conclusion and several suggestions for further studies.
1.1 Method & limitations
Certain limitations have been made concerning the assortment of funds. A sample of four equity mutual funds will be assessed and all the funds, mainly, invest in large Swedish quo-ted companies. However, the performance of the funds can vary depending on the size of the organization that manages the funds. More precisely, funds managed by smaller organi-zations often have less total capital invested in the fund compared to larger organiorgani-zations. This implies that the capital can easily be re-allocated between different types of securities, which influence the performance of the fund. Another issue is that the survival of small or-ganizations depends on the performance of the fund. This in turn creates higher require-ments that smaller organizations have to fulfil in order to survive. This is also confirmed by Dahlquist et. al (2000) who argue that larger Swedish equity funds performed less well than smaller equity funds during the period 1993-1997.
Hence, two “large” and two “small” actively managed funds will be chosen. Usually the fees charged by fund managers differ but these will not be emphasized in this thesis. For-eign, regional (cross-country) or global funds are not considered since the market condition in different countries would make the second hypothesis very difficult to investigate. Fur-thermore, only equity mutual funds are highlighted in this thesis because the demand (in Sweden) for these are larger compared to other types of mutual funds.
1.2 Previous research
The main intention of this thesis is to investigate if active equity mutual fund managers can outperform an index. If so, this topic would be particularly interesting because investors would be able to purchase a fund that, in most cases, generate abnormal returns. Hence, the aim of managing an active fund is to “beat the index” and thereby create returns that exceed those of the passive fund.
Studies regarding portfolio theory begin with Markowitz mean-variance analysis from 1952 that explains the importance of domestic diversification and the relationship between risk and return. Since 1952, different theories and models have discussed the gains of interna-tional diversification. One of the earlier studies concerning internainterna-tional diversification was made by Grubel (1968). He collected the rates of return from portfolio investments in eleven major stock markets, which were compared to the rates of return attained by a do-mestic portfolio investment. The result indicated that the internationally diversified portfo-lio generated higher rate of return than the domestic portfoportfo-lio. A similar comparison was made by Hauser and Vermeersch (2002). They investigated the correlation coefficient of cross-country and cross-industry diversification and concluded that the cross-country cor-relation was lower. As a consequence, diversification across countries are more beneficial than across industries, which is the similar conclusion as Grubel’s.
Other studies have highlighted the ability to forecast the expected returns of securities and thereby construct portfolios that outperform the index. Sharpe (1966) shows that eleven mutual funds out of thirty-four, after deducting the expenses, outperformed the index while twenty-three did worse. Jensen (1968) made an even greater study consisting of 115 mutual funds and concluded that very few funds showed an ability to forecast security prices. More recent studies have discussed and empirically analysed different models. Stotz (2005) utilizes two different investment methods, based on earnings forecasts estimated by financial analysts, to determine if active stock selection strategies outperform the index. The author also investigates how a possible bias in analysts’ earnings expectations influ-ences the expected returns. The result of the paper indicates that both investment methods outperformed the index, which is the opposite conclusion as Sharpe’s.
Evidently, the conclusion is heavily influenced by various factors that determine if active funds generally “beat the index” and generates above average returns. The limitations made (concerning the assortment of funds, the chosen time period, the method, model and vari-ables used to investigate) determines the outcome of the paper and makes each individual study unique.
1.3 Background
Historically, the average payoff from investing on the Stockholm Stock Exchange (SSE) is higher than the savings account. If one Swedish crown was invested on the SSE in 1945, it would have generated 1201 Swedish crowns in the end of 1997. A regular savings account on the other hand would have generated 34 Swedish crowns for the same initial investment and time period. The first equity mutual fund in Sweden was founded in the 1950s but the demand for funds began in 1978 when the government introduced tax benefits for fund investors. These benefits were allowed all through the 1980s, giving the households the opportunity to receive tax exempt returns. In late 1980s and mid 1990s two regulations were abolished. The first one was the exchange restrictions, which fostered the demand for equity mutual funds investing in foreign countries. This was followed by the elimination of tax benefits to fund holders, which dampened the increase in demand (Haskel, 1998). During the 1990s the new investment vehicle, “unit linked”, was introduced. This new fund forces the investor to keep the fund capital untouched in the account until he or she reaches the age of 55. The investor also has the possibility to reallocate the fund capital be-tween different types of mutual funds. In January 1994 an individual annuity program was established, enabling investors to have some investment alternatives concerning their pen-sions. More precisely, they were able to choose between stocks, mutual funds or saving ac-counts for their pension.
The final change occurred in 2000 when investors were able to specifically decide which mutual funds to invest in for their pension. Today, more than 1 600 000 million Swedish crowns are invested in mutual funds, creating large revenues for active mutual fund ers. The increase in the demand for mutual funds has also increased the number of manag-ers, some with sufficient and some with poor performance. This thesis will give an insight in the profitability of investing in an active fund rather than a passive one (Fondbolagen.se, 2007).
2
Theoretical framework
2.1 Diversification theory
Investors buy shares of equity mutual funds and thereby receive a diversified portfolio, ac-cording to Brealey et. al (2004). The portfolio is made up of various individual stocks, spreading the risk across many investments. The theory of diversification explains how a risk-averse investor can optimize a portfolio by maximizing the return with the lowest level of risk. Generally, an investor must be willing to accept some risk to receive the highest possible return. More precisely, higher returns imply higher risks while lower returns com-prise lower risks and therefore, diversification can never eliminate all risk but rather reduce it considerably.
As previously mentioned, the study of portfolio creation begins with the mean-variance analysis of Markowitz (1952). Markowitz illustrates in his analysis how an investor can re-duce the risk with a given level of return by holding a portfolio of not perfectly positively correlated assets (Hauser and Vermeersch, 2002).
Pike and Neale (2003) describe that the correlation coefficient (ρ) is a variable used to compute the total risk of a portfolio. This variable measures how two securities move in re-lation to each other and locates assets on a scale between -1 and +1. A perfect positive cor-relation of +1 indicates that as one security moves up or down, the other security will move in the same direction. On the other hand, a perfect negative correlation of -1 implies that as one security moves up or down, the other will move by an equal amount in the op-posite direction. With a correlation of 0, the movements of securities have no relationship to each other. However, most investments are partially correlated and one example is two stocks in the same industry that are positively correlated but not necessarily +1.
Pike and Neale (2003) continue to discuss the total risk of a portfolio, which consists of 1unique risk and market risk. Most of the unique risk can be eliminated by diversification while market risk cannot be avoided. The unique risk refers to the microeconomic risks of a company such as R&D achievement, equipment failure and industrial relations problems. The market risk refers to macroeconomic risks and some examples are fiscal changes, swings in the exchange rates and interest rate movements. Figure 1 below displays how the total risk of a portfolio decreases as the number of securities in the portfolio increase. Most of the unique risk can be diversified away with quite small portfolios consisting of ap-proximately 30 securities. In order to eliminate all the unique risk, a portfolio comprising all the securities in the market is required (also called market portfolio).
However, it is neither feasible nor cost-efficient for an individual investor to construct a market portfolio. The reason is, simply, that each security in the market portfolio entails high fees and transaction costs and therefore, huge amounts of capital are required to con-struct a portfolio that include all the securities in the market.
1 These two kinds of risk have several names. Unique risk can also be called unsystematic, diversifiable or
2.2 Efficient market hypothesis
Pike and Neale (2003) argue that there are various forms of efficiencies in different fields but as to financial markets, pricing and information efficiency is often discussed. The measure of efficiency refers to the extent and speed in which the market impounds new in-formation in stock prices. In an efficient market, past and publicly available inin-formation is reflected in the stock price and therefore, it is only possible to constantly outperform an ef-ficient market by luck. This view has been criticized by Grossman and Stiglitz (1980) who state that markets are efficient when information is very inexpensive. However, informa-tion is costly with the implicainforma-tion that prices cannot perfectly reflect all publicly available information. They argue that if all publicly available information were reflected, those who spent resources to obtain information would receive no compensation. Another common issue concerns over- and undervalued stocks, which implies that current market prices are wrong, or rather over- or undervalued, and that analysts are able to pinpoint the right prices (Pike and Neale, 2003).
Claesson (1987) writes that even though stock markets reflect past and publicly available in-formation, the expected returns can vary. In other words, an investor’s perception about the expected returns on a specific stock can differ from that of the stock market. Hence, investors are able to analyse and thereby identify specific stocks that have higher expected returns, which are undervalued from the investor’s point of view. Those within organiza-tions have access to specific information (also called inside information) about the state of the business, which indicates that there is an unequal availability of information to individ-ual investors and institutions. A well-informed employee or manager will always be one step ahead of the market because only past and available information is reflected in the stock price. This creates opportunities for inside trading, which in most countries is illegal and tightly circumscribed. The efficient market hypothesis (EMH) divides market efficiency into three different levels:
R is k o f p o rt fo lio (S ta n da rd de vi at io n o f r et u rn ) Unique risk Market risk 0
Number of securities in portfolio Source: Pike and Neale 2003 Figure 1: The total risk of a portfolio decreases as the number of securities in the portfolio increase.
• Weak form efficiency describes a market where prices already reflect all informa-tion contained in past prices. Therefore, to search patterns in past prices in order to predict future price movements is useless.
• Semi-strong form efficiency states that both the information contained in past price movements and publicly available information is reflected in the stock price. In such a market it is impossible to earn superior returns by analysing existing infor-mation such as a company’s financial statements.
• In a strong form efficient market, stock prices impound all relevant information in-cluding privately held information. This implies that no investor can earn abnormal returns, not even those with inside information. However, stock markets are not ef-ficient on this level (Pike and Neale, 2003).
Even though efficient markets reflect past and publicly available information, there are some anomalies to consider. According to Pike and Neale (2003) the first anomaly is that smaller firms listed on a stock exchange tend to yield higher average returns compared to larger companies with comparable risk. Secondly, there are timing effects on stock prices, implying that stock performance is influenced by the time of the day, day of the week, the day of the month and the month of the year. Other timing effects involve stocks that tend to perform poorly in one year and do well the next year. Finally, the last form of anomaly concerns short-term stock market surges and bubbles.
Claesson (1987) argue that different stock markets are very efficient, which is mainly due to the accessibility of information about listed companies and stock prices. The purpose of a stock market is to create turnover possibilities for long-term stock investments. Therefore, the company’s capital inflows from stocks would be nonexistent in a world without stock markets.
2.3 Active- and passive fund management
Active fund managers try to “beat the market” by finding stocks that generate abnormal turns. Brealey et. al (2004) describes two common strategies used to achieve superior re-turns, technical and fundamental analysis. Technical analysts search for patterns in past stock price movements by relying on graphs and charts. In other words, graphs and charts are used to detect stocks on their way up or down, which also determine if they should purchase or sell stocks. However, empirical studies have shown that security movements are completely random.
Fundamental analysts study information such as accounting data, business prospects and other news concerning a specific firm in order to find mispriced securities. This strategy is unlikely to work in an efficient market and therefore, to earn superior returns by purchas-ing securities after an announcement is impossible. However, investors are able to combine fundamental analysis with multifactor models to construct the best possible portfolio in terms of systematic risk. Solnik (1996) argues that the arbitrage pricing theory (APT) allows investors to estimate the expected return of a security by applying different factors to the model. Three factors that influence the expected return are statistical factors, macroeco-nomic factors and firm’s attribute factors.
Pike and Neale (2003) mention another strategy used to earn abnormal profits. Investors can earn profits without incurring any risk if arbitrage opportunities are discovered. The implication is that equivalent securities are traded at different prices, excluding the transac-tion costs, allowing investors to purchase a stock and simultaneously sell to earn a profit. Evidently there are various strategies to use as an active fund manager to “beat the mar-ket”. An index, or benchmark, always guide the structure of a portfolio even though active managers constantly attempt to find new stocks that may outperform the index. Hence, small deviations from the index can either lead to superior or poor performance. The per-formance of an active fund heavily depends on the manager’s ability to evaluate and con-trol the portfolio risk as quickly as possible. Risk management is especially important in a changing global environment where economies and firms around the world influence each other (Solnik and McLeavey, 2003).
Different theories have argued that an active fund manager, on average, does not outper-form the index. One of these theories is the efficient market hypothesis, which states that markets are efficient and information is rapidly reflected in stock prices. Therefore, inves-tors should consider index funds rather than active managed funds. Solnik and McLeavey (2003) continue to describe that index funds track the long-term return on a selected mar-ket index while minimizing the costs. Hence, the demand for index funds has increased be-cause active management entails above-average forecasting skills and higher commissions and costs. An index fund does not require professional management but there are four dif-ferent indexing methods to consider:
• Full replication states that all the securities on an index are purchased and properly weighted.
• With stratified sampling a number of securities from the index are divided accord-ing to certain criteria such as firm size, industry, yield and so forth. These securities represent a sample and replicate the index across the criteria.
• Optimization sampling utilizes factor models to minimize the index tracking error by relying on firm attributes and historical relationships.
• Synthetic replication ensures index tracking and low transaction costs by the pur-chase of a futures contract and a cash position.
Studies have also shown that equity mutual funds, on average, tend to underperform the market. Malkiel (1995) argues that all the equity mutual funds in the U.S. during the period 1971-1991 have underperformed the market. Other studies have also emphasized the per-formance of Swedish equity mutual funds. Dahlquist et. al (2000) state that all the Swedish actively managed equity funds during the period 1993-1997 perform better than more pas-sively managed funds, which is the opposite conclusion as Malkiel’s. A similar result was confirmed by Kosowski et. al (2006) who investigates if the superior performance of active fund managers is due to genuine stock-picking skills by applying different bootstraps ap-proaches. Kacperczyk et. al (2005) also explains that there are possibilities of creating value by concentrating portfolios in industries where managers have informational advantages and thereby, outperform the passively managed funds. Finally, Wermers (2000) employs a database that allows an explicit investigation of mutual fund performance at both the stock holdings level and the net return level. The results implied that mutual fund managers out-performed the market index by almost enough to cover their expenses and costs.
2.4 Jensen’s alpha
Jensen (1968) argues that the concept of portfolio performance can be divided into two parts, prediction of future security prices and the ability to minimize the unique risk thro-ugh efficient diversification. The former emphasizes the portfolio managers’ ability to pre-dict future security prices and thereby earn returns that exceed those expected of a portfo-lio with a given level of risk. Another issue discussed is the portfoportfo-lio managers’ ability to change the risk level of the portfolio by switching securities. A manager is capable of changing the risk level of a portfolio depending on the expected state of the market. In other words, a manager is able to reduce the losses by reducing the beta if a bear market is expected or increase the returns by increasing the beta if a bull market is expected.
Jensen’s alpha is often used to predict the future development of a stock market by esti-mating an alpha that indicates if a stock is wrongly priced. The model is based on the CAPM, which shows that any security or portfolio is expected to earn returns that are rela-tive to the level of risk accepted. A manager will earn abnormal returns, or rather returns that exceed those expected of a portfolio with a given level of risk, if future security prices are successfully predicted (Jensen 1968). Figure 2 displays a strong form efficient market where Jensen’s alpha should be zero and an investor is expected to earn returns on the Se-curity Market Line. An undervalued seSe-curity will be displayed above the line while an over-valued security will be below. Hence, a portfolio manager that successfully predicts security prices will detect if a security is correctly priced, undervalued or overvalued. Furthermore, the risk-free interest rate is the minimum interest that an investor is expected to earn. The difference between the market return and the risk-free interest rate is termed market risk premium (Brealey et. al 2004).
Rf = Risk-free interest rate
Rm = Market return
Security Market Line Undervalued Correctly valued Overvalued 0 Rm E xp ec te d r et u rn Rf
Beta Source: Brealey et. al 2004 Figure 2: Undervalued, correctly valued and overvalued securities on the Security Market Line.
Jensen’s alpha is based on six assumptions that have to be taken into account; (1) all inves-tors are risk averse and wealth maximizers, (2) all invesinves-tors have identical decision horizons and standardized expectations concerning investment opportunities, (3) all investors are able to choose among portfolios that are solely based on expected and variance of returns, (4) there are no taxes and transaction costs, (5) all securities are infinitely separable and (6) the capital market is in equilibrium. According to CAPM, the single period expected return for a portfolio is:
E(r
p,t) = r
f,t+ β(r
m,t– r
f,t),
(1)
where,
= The single period expected return for a portfolio,
r f,t = Risk-free interest rate is represented by the treasury bill that will be calculated on a daily basis,
r f,t =(1 + r y,t)(1/250) – 1, where r y,t is the yearly interest rate,
β = Estimated beta for the fund, based on the comparable market index, r m,t = The daily return from the comparable market index.
Equation (1) implies that the expected return of a portfolio can be expressed as a linear function of the market risk, risk-free rate and the realized daily return from the comparable market index. However, equation (1) has to be rearranged in order to estimate Jensen’s al-pha. Furthermore, E(r p,t) is replaced by r p,t since historical returns of mutual funds are measured instead of the single period expected return of a portfolio, which is displayed be-low:
α
= r
p,t– [r
f,t+ β(r
m,t– r
f,t)] + u
(2)
Equation (2) has to be modified in order to include the superior forecasting skill of portfo-lio managers. The beta is an efficient estimate when estimating the market risk of a single security or of a passive portfolio. On the other hand, the manager of an active portfolio is capable of earning abnormal returns by successfully predicting security prices. This indi-cates that the manager is accepting less risk and earning higher returns, which will place the error term (u) above the regression line. Allowance for such forecasting ability is made by constructing equation (3):
The sum of the error terms is zero and should be serially independent. Moreover, the inter-cept (α) will be positive if a manager successfully predicts security prices. The interinter-cept will be zero if the manager generates returns that are equal to the index. Additionally, there will be a negative intercept if the performance of the manager is worse than the index. Note-worthy is that a least square regression will be made in order to determine if a positive in-tercept is due to mere random chance or superior forecasting skill of the portfolio manager (Jensen 1968).
3
Data
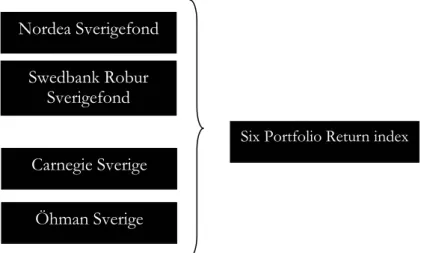
Daily data is collected from four equity mutual funds that mainly invest in large Swedish quoted companies, and their comparable index from 2001-2006. Two “large” and two “small” actively managed funds are chosen since the performance of the funds can vary depending on the size of the organization that manages the funds. The four funds and the comparable index are presented below, beginning with the two “larger” funds:
Nordea Sverigefond is an equity fund that mainly invests in large Swedish companies that focuses on the international market. Hence, the risk of the fund is considered to be rela-tively high. The value of the fund was declining from the beginning of 2001 to the second quarter of 2003. However, the fund began to increase in value from the third quarter of 2003 to the end of 2006. The long-term purpose of the fund is to generate returns that ex-ceed those created by the comparable index, which is achieved by cautious risk manage-ment. Furthermore, the largest investments are in the financial (24.5 per cent) and indus-trial sector (25.9 per cent). (Nordea.se, 2007)
Swedbank Robur Sverigefond mainly invests in large Swedish companies in different re-gions and industries. This fund has decreased in value from the beginning of 2001 to the first quarter of 2003. This was followed by a steady increase in value to the end of 2006. The largest investments of the fund are in the financial (22.9 per cent) and industrial sector (27.8 per cent). (Swedbank.se, 2007)
Carnegie Sverige
Six Portfolio Return index
Öhman Sverige Nordea Sverigefond
Swedbank Robur Sverigefond
Carnegie Sverige is an equity fund that attempts to generate long-term returns by investing in Swedish companies, which are carefully analysed based on their long-term potential growth. The overall risk level of the fund is considered to be relatively high. However, the foundation of the fund is based on the financial sector (37 per cent) that usually manages stock market recessions better compared to other sectors. Other large investments are made in the telecommunication sector (21 per cent). The closing prices of this fund has de-clined from 2001 to the second quarter of 2003, which was followed by a recovery that in-creased the value of the fund to the end of 2006 (Carnegie.se, 2007).
Öhman Sverige mainly targets Swedish companies in the financial (16.7 per cent) and in-dustrial sector (13.9 per cent). Evidently, a smaller share of the entire fund is dedicated to a certain industry or sector, which implies that this fund entails larger diversification. Note-worthy is that a larger share of the fund is invested in several larger companies. Unlike the other funds, the value of this fund has been fluctuating to a greater extent. The lowest value was reached in the first quarter of 2003 while the highest value was in the last quarter of 2006 (Ohmanfonder.se, 2007).
As mentioned above, the beta will be examined to see if the risk level of the mutual funds change according to the state of the market, which is done by investigating a bearish (2001-2003) and bullish (2004-2006) time period. A bearish time period is characterized by a de-clining market while a bullish time period represents an expanding market. However, the performance of the funds can vary in the two time periods. This means that a fund can be increasing in value in a bearish time period when the index is declining and vice versa. Another issue is to compare and examine the standard deviation of the value of each fund and the associated index. More precisely, the standard deviation of a specific fund can be compared to other funds and the index associated with the particular fund in order to de-termine how much the closing prices deviate:
Period One Nordea Sverigefond Swedbank Robur Sverigefond
Carnegie Sverige Öhman Sverige
Standard deviation 0.0177 (0.0158) 0.0166 (0.0156) 0.0179 (0.0156) 0.0174 (0.0160) Period Two Nordea Sverigefond Swedbank Robur
Sverigefond
Carnegie Sverige Öhman Sverige
Standard deviation 0.00882 (0.00914) 0.00874 (0.00899) 0.00902 (0.00915) 0.00884 (0.00915) Table 1: Standard deviation of the value of the funds and index in each time period (the standard deviation of the index for each fund is in the parentheses)
Moreover, the daily data collected from the funds and the index are retrieved from Avanza and Six by request. The comparable index includes all companies listed on the Stockholm Stock Exchange and re-invested dividend, which is not considered by many other indices. Furthermore, the index observations will be adjusted to each fund so that they contain ex-actly the same amount of observations. The risk-free interest rate is required to construct Jensen’s alpha and is represented by the treasury bill that is re-calculated and retrieved from Riksbanken.se.
4
Null- and alternative hypotheses
Equation four is displayed below and Y is the dependant variable and X is the independent variable:
Y = α + βX (4)
where,
Y = r p,t – r f,t
X = r m,t – r f,t
As previously mentioned, the alpha will be zero if the mutual fund manager generates re-turns that are equal to the index. The alpha will be different from zero if the mutual fund manager generates returns that differ from the index. Hence, the hypotheses are presented below and the testing of H 0 against Η 1 will be performed at a 1 per cent, 5 per cent and 10 per cent significance level:
H 0: α = 0 Η 1: α ≠ 0
The second regression will test if the beta value, or rather the market risk, is influenced by the state of the market. A beta value below one is assumed to be risk averse while a beta value above one is risk preferring. Furthermore, a low beta value is expected when the market is bearish and a high beta value when the market is bullish. A t-test will be con-structed for the beta of each mutual fund at a 1 per cent, 5 per cent and 10 per cent signifi-cance level:
H 0: β = 1 Η 1: β ≠ 1
(5)
where,
= Estimated beta value
β = Tested beta value, which in this case is one = Standard error
The result of the hypotheses and the t-test will indicate if the beta value is equal or differ-ent from one. Hence, the two hypotheses presdiffer-ented below will clarify if the estimated beta value changes from period one to period two. Period one represents a bearish stock market and period two a bullish stock market:
H 0: Period 1 – Period 2 = 0
Η 1: Period 1 – Period 2 ≠ 0
The value of the test will be calculated with a confidence interval at a 5 per cent signifi-cance level:
1.96 (6)
Noteworthy is that the time series regression needs to be tested in order to see if the data is stationary and if the error terms are autocorrelated. The data is not stationary if the auto-correlation from lag one steadily decreases to the last lag. Moreover, all the Ljung-Box Q-statistics should be insignificant with large p-values if there is no autocorrelation in the er-ror terms. The results of the tests indicated that the index and the fund values are station-ary with the implication that no further measures are required in this respect. However, the residuals were autocorrelated and therefore the t-values were adjusted with the Newey-West method. This method is only valid in larger samples and produces autocorrelation-corrected standard errors, which influences the t-value alone.
4.1 Empirical analysis
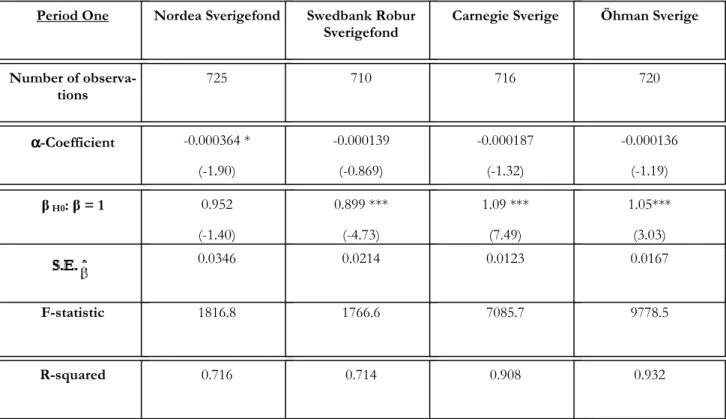
The regression results are presented below in two tables that are divided into period one and period two. As previously mentioned, period one represents a bearish stock market while period two represents a bullish stock market. Each table includes the number of ob-servations, alpha coefficient, t-value of the alpha, beta coefficient, t-value of the beta, standard error of the beta, F-statistic and the R-squared of each fund.
*** = Significant at 1 per cent significance level ** = Significant at 5 per cent significance level * = Significant at 10 per cent significance level
α α α
α-Coefficient
Period One Nordea Sverigefond Swedbank Robur Sverigefond
Carnegie Sverige Öhman Sverige
-0.000364 * (-1.90) -0.000139 (-0.869) -0.000187 (-1.32) -0.000136 (-1.19) β H0: β = 1 0.952 (-1.40) 0.899 *** (-4.73) 1.09 *** (7.49) 1.05*** (3.03) F-statistic R-squared 1816.8 1766.6 7085.7 9778.5 0.716 0.714 0.908 0.932 Number of observa-tions 725 710 716 720 0.0346 0.0214 0.0123 0.0167 Table 2: Regression results (the t-values are in the parentheses)
The estimated model of the regression Y = α + βX shows that the t-value for the inter-cept, α, is significantly different from zero at the level of 10 per cent for Nordea Sverige-fond in period one. This indicates that the null hypothesis, H 0: α = 0, can be rejected for this specific fund. The intercept for this fund is -0.000364 and suggests that the fund is outperformed by the comparable index. The closing prices of the fund have decreased with 40.3 per cent from the period 2001-2003, which could be compared to a decrease of 21.3 per cent for the index in the same period. However, the t-value for the intercept is not sig-nificantly different from zero for any of the remaining funds in period one. This in turn implies that the null hypothesis cannot be rejected and it cannot be stated with certainty that the intercept is different from zero for the remaining funds.
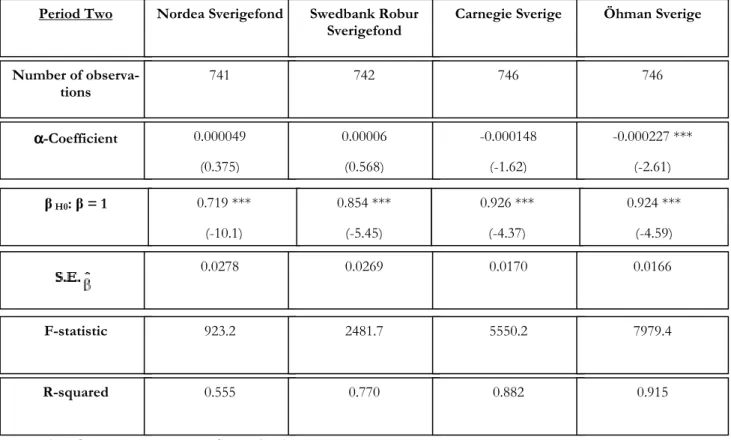
Table 3: Regression results (the t-values are in the parentheses) Period Two Nordea Sverigefond Swedbank Robur
Sverigefond
Carnegie Sverige Öhman Sverige
α αα α-Coefficient 0.000049 (0.375) 0.00006 (0.568) -0.000148 (-1.62) -0.000227 *** (-2.61) Number of observa-tions 741 742 746 746 β H0: β = 1 0.719 *** (-10.1) 0.854 *** (-5.45) 0.926 *** (-4.37) 0.924 *** (-4.59) F-statistic R-squared 923.2 2481.7 5550.2 7979.4 0.555 0.770 0.882 0.915 0.0278 0.0269 0.0170 0.0166
*** = Significant at 1 per cent significance level ** = Significant at 5 per cent significance level * = Significant at 10 per cent significance level
The results in the second time period are similar to the first period. The t-value for the in-tercept is significantly different from zero at the level of 1 per cent for Öhman Sverige. The null hypothesis, H 0: α = 0, can be rejected for this fund and the intercept -0.000227 indi-cates that the fund is, once again, outperformed by the comparable index. Moreover, the closing prices of this fund have increased with 69.8 per cent while the index increased with 100.1 per cent for the period 2004-2006. Similar to period one, the t-value for the intercept is not significantly different from zero for any other fund in period two. This implies that the null hypothesis cannot be rejected and that the coefficient should be considered as ap-proximately zero.
Evidently, an actively managed equity mutual fund does not outperform the passively man-aged portfolios that are based on an index in this case. Hence, an investor should have in-vested in a passively managed portfolio rather than in Nordea Sverigefond in period one or Öhman Sverige in period two. The implication is that both of these funds were outper-formed by the index and, on top of that, the fund brokers charge additional administrative fees that were not emphasized in this thesis. Recall from the theoretical framework that in-dex funds track the long-term return on a selected market inin-dex while minimizing the cost. Therefore, investing in these two funds would have resulted in major losses that could have been avoided by investing in passively managed portfolios with low commissions and costs. This result also suggests that markets are efficient on a level where the information from past price movements and publicly available information is reflected in the stock price. More precisely, active fund managers would have, hopefully, outperformed the passively managed portfolios if markets were inefficient. This due to that the past price movements and publicly available information would have been used as an indicator for future stock performance. Hence, other strategies are required than just technical and fundamental analysis in order to “beat the market”. However, one should be aware of that both active and passive portfolios are diversified since they entail different stocks, which eliminate most of the unique risk.
The second test is to analyse if equity mutual fund managers increase/decrease the risk level, or rather the beta, when the stock market is bullish/bearish. The t-value for the beta is significantly different from one at the level of 1 per cent for Swedbank Robur Sverige-fond, Carnegie Sverige and Öhman Sverige in period one. This concludes that the null hy-pothesis, H 0: β = 1, can be rejected for these funds. The beta for Swedbank Robur Sverigefond is lower than one at 0.898927 and indicates that the fund is talking a defensive position with lower risk than the index in the bearish time period. On the other hand, Car-negie Sverige and Öhman Sverige have a beta value above one at 1.092337 and 1.050678 respectively, which implies that these two funds are talking more risk than the index in the
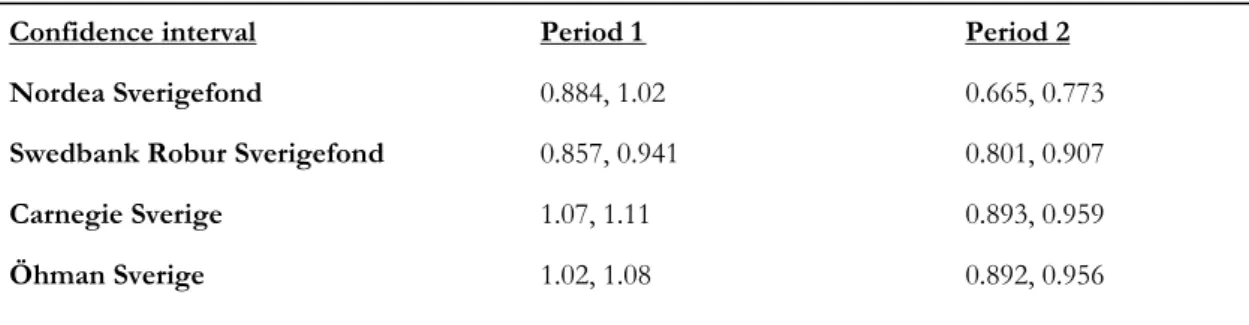
Confidence interval Period 1 Period 2 Nordea Sverigefond 0.884, 1.02 0.665, 0.773 Swedbank Robur Sverigefond 0.857, 0.941 0.801, 0.907 Carnegie Sverige 1.07, 1.11 0.893, 0.959 Öhman Sverige 1.02, 1.08 0.892, 0.956 Table 4: Results from equation (6)
bearish time period. However, the t-value for the beta is not significantly different from one for Nordea Sverigefond in period one. Once again, the null hypothesis of this fund cannot be rejected and it cannot be stated with certainty that the beta is different from one. The beta analysis suggests that Swedbank Robur Sverigefond is a fund with relatively low risk while Carnegie Sverige and Öhman Sverige incorporate higher risk. Another compari-son can be made by examining the standard deviation of these three funds in period one. Table 1 displays that the standard deviations of all the funds are higher than the index, which implies that even Swedbank Robur Sverigefond with low risk have closing prices that deviate more than the index. Hence, an investor usually prefer steady returns and should therefore choose a passive index fund in period one with a low standard deviation. Noteworthy is that Swedbank Robur Sverigefond has a standard deviation that is lower than the other funds.
The main question is whether the beta value of each fund is different between the two time periods. Recall from the theoretical framework that one should expect the beta values to increase above one in the bullish time period in order for investors to gain the multiplier effect. In other words, the prices are expected to increase in the bullish time period as a consequence of more investments, which in turn should increase the risk level that inves-tors are willing to accept. The confidence interval from table 4 suggests that Nordea Sverigefond, Carnegie Sverige and Öhman Sverige have beta values that do not overlap and thereby are significantly different over the two periods. Hence, the result shows that the beta value of these three funds have decreased from period one to period two. Moreover, the beta values are even lower than one, which suggests that the funds are, surprisingly, talking a defensive position with lower risk than the index in the bullish time period.
Furthermore, Table 1 show that the standard deviations of all the funds are lower than the index in period two. On top of that, the beta values of all the funds are significantly less than one in this period. As a consequence, an investor should prefer to invest in one of these funds rather than in a passive index fund. However, the alpha analysis above sug-gested that Öhman Sverige was outperformed by the index and therefore, investments should be made in one of the other funds. Nordea Sverigefond has the lowest beta value in period two, which indicates that this fund should be chosen. On the other hand, table 1 display that Swedbank Robur Sverigefond have the lowest standard deviation and thereby should be preferable by an investor.
5
Conclusion
The main objective of this thesis has been to investigate how well mutual fund managers perform on each selected mutual fund compared to the market index. The concluding re-marks from this thesis is that one significant fund in each period was outperformed by the comparable market index. Evidently, an actively managed equity mutual fund does not out-perform the passively managed portfolios that are based on an index in this case. This con-clusion is in line with the analysis made by Sharpe (1966) who showed that twenty-three funds out of thirty-four performed worse than the index. The result also goes in line with the analysis made by Jensen (1968) and Malkiel (1995) who similarly found few funds that could outperform the index. On the other hand, Stotz (2005), Dahlquist et. al (2000), Kosowski et. al (2006), Kacperczyk et. al (2005) and Wermers (2000) concluded the oppo-site result. Noteworthy is that this thesis and the study made by Dahlquist et. al (2000) are both based on Swedish actively managed equity funds but during two different time peri-ods.
However, the performance of the selected funds can vary depending on the size of the or-ganization that manages the funds and therefore, two “large” and two “small” actively managed funds were chosen. Noteworthy is that the regression result, which included few significant alpha values, prohibited a more thorough analysis concerning the fund size. The second question of this thesis has been to examine if equity mutual fund managers in-crease/decrease the risk level, or rather the beta, when the stock market is bullish/bearish. Two beta values were significantly higher than one, which implies that these two funds are talking more risk than the index in the bearish time period. Evidence also suggests that three funds had significantly different beta values over the two periods. Moreover, the beta values decreased and were even lower than one in the second time period. Hence, the the-ory that fund managers should increase/decrease the risk level when the stock market is bullish/bearish does not hold.
5.1 Further studies
Further studies could examine the fund performance by emphasizing other measurements that entail different properties. One could, for example, investigate two measurements that are developed by Sharpe (1966) and Treynor (1966). However, the greatest drawback with this thesis is that it is based on four equity mutual funds and thereby prohibit the result to be generalized. Hence, further studies could include more funds in order to generalize the result of the study. Another suggestion would be to utilize foreign funds in order to see if international diversification influences the overall fund performance. Furthermore, admin-istrative fees could also be incorporated to compare the performance of funds with high and low fees.
References
Brealey, Richard A., Myers, Stewart C., and Marcus, Alan J. (2004) Fundamentals of Corpo-rate Finance, International Edition, pp. 161-165, 279-280, 299-306
Carnegie, retrieved 2007-04-09 from www.carnegie.se
Claesson, K. (1987) Effektiviteten på Stockholms Fondbörs, Ekonomiska Forskningsinsti-tutet vid Handelshögskolan i Stockholm, pp. 1-4
Dahlquist, M., Engström, S., and Söderlind, P. (2000) Performance and Characteristics of Swedish Mutual Funds, The Journal of Financial and Quantitative Analysis, Vol. 35, No. 3, (Sep., 2000), pp. 409-423
Fondbolagen, retrieved 2007-02-27 from www.fondbolagen.se
Grossman, Sanford J., and Stiglitz, Joseph E. (1980) On the Impossibility of Information-ally Efficient markets, The American Economic Review, Vol. 70, No. 3, (Jun., 1980), pp. 393-408
Grubel, Herbert G. (1968) Internationally Diversified Portfolios: Welfare Gains and Capital Flows, The American Economic Review, Vol. 58, No. 5, (Dec., 1968), pp. 1299-1314
Haskel, A. (1998) Fond handboken, Aktiespararnas Bokförlag, pp. 9-13, 29
Hauser, T., and Vermeersch, D. (2002) Is Country Diversification Still Better Than Sector Diversification?, Financial Markets and Portfolio Management, Vol. 16, No. 2, (Jun., 2002), pp. 234-253
Jensen, Michael C. (1968) The Performance of Mutual Funds in the Period 1945-1964, The Journal of Finance, Vol. 23, No. 2, (May, 1968), pp. 389-416
Kacperczyk, M., Sialm, C., and Zheng, L. (2005) On the Industry Concentration of Ac-tively Managed Equity Mutual Funds, The Journal of Finance, Vol. 60, No. 4, (Aug., 2005), pp. 1983-2011
Kosowski, R., Timmermann, A., Wermers, R., and White, H. (2006) Can Mutual Fund “Stars” Really Pick Stocks? New Evidence from a Bootstrap Analysis, The Journal of Finance, Vol. 61, No. 6, (Dec., 2006), pp. 2551-2595
Malkiel, Burton G. (1995) Returns from Investing in Equity Mutual Funds 1971 to 1991, The Journal of Finance, Vol. 50, No. 2, (Jun., 1995), pp. 549-572
Markowitz, H. (1952) Portfolio Selection, The Journal of Finance, Vol. 7, No. 1, (Mar., 1952), pp. 77-91
Nordea, retrieved 2007-04-08 from www.nordea.se
Pike, R., and Neale, B. (2003) Corporate Finance and Investment, Fourth Edition, pp. 46-48, 54, 335-336, 849
Sharpe, William F. (1966) Mutual Fund Performance, The Journal of Business, Vol. 39, No. 1, Part 2: Supplement on Security Prices. (Jan., 1966), pp. 119-138
Solnik, B. (1996) International Investments, Third Edition, pp. 134, 234-240
Stotz, O. (2005) Active Portfolio Management, Implied Expected Returns, And Analyst Optimism, Financial Markets and Portfolio Management, Vol. 19, No. 3, (Oct., 2005), pp. 261-275
Swedbank, retrieved 2007-04-08 from www.swedbank.se
Wermers, R. (2000) Mutual Fund Performance: An Empirical Decomposition into Stock-Picking Talent, Style, Transaction Costs, and Expenses, The Journal of Finance, Vol. 55, No. 4, (Aug., 2000), pp. 1655-1703
Öhman, retrieved 2007-04-09 from www.ohmanfonder.se
Data retrieved from;
Riksbanken, retrieved 2007-04-18 from www.riksbanken.se Avanza by request, www.Avanza.se