Budget Management
The perception and use of budgets within publicly traded companies in Sweden
Master’s thesis within Business Administration
Author: Xenia Johansson
Tutor: Karin Brunsson
Preface
I would foremost like to thank my tutor, Associate Professor Karin Brunsson, for her invaluable guidance and support during this thesis writing.
Furthermore, I would like to thank all companies that participated in my study making this thesis possible.
Last by not least; I would like to thank the students in my seminar group, Mathias Lantz and Lina Andersson for their support, comments and encouragement
throughout this process.
_______________________________ Xenia Johansson
Master’s Thesis in Business Administration
Title: Budget Management – The perception and use of budgets within publicly traded companies in Sweden
Author: Xenia Johansson
Tutor: Karin Brunsson
Date: [2014-05-12]
Subject terms: Budget, fixed budget, beyond budgeting, management control,
man-agement control measures, abolishing budgets, supplement, substitute
Abstract
Background
The debate about the budgets being and not being has been going on for 40 years. On one hand advocates for abolishing the budget have been criticising the budget, arguing for example that it is a waste of resources that only provides an illusion of control. Whereas on the other hand, business students are still taught to use the budget and pre-vious studies show that companies are still holding on to it. Hence, there seems to exist a budget paradox.
Purpose
The purpose of this thesis is to examine the use and perception of fixed budgets within larger companies of today and to clarify the reality behind the debate about the useful-ness of budgets. Further, to get an understanding of what purposes are deemed as im-portant when using different control measures, and how well these are fulfilled.
Method
This study is predominantly quantitative with a deductive approach, as it via a self-administrative web survey has collected data from 58 publicly traded companies in Swe-den. The questionnaire has consisted of open- and close-ended questions, to provide a deeper understanding of the role the fixed budget.
Conclusion
The overall percentage of companies that have abolished the budget has increased when compared to previous studies, but the majority of 81% still use the fixed budget in one way or another. Out of the participating companies, 67% stated that they supplement the fixed budget with other control measures, and as the percentage of those consider-ing abolishconsider-ing the budget have decreased, the overall perception of the fixed budget has improved.
Table of Contents
1
Introduction ... 1
1.1 Background ... 1 1.2 Problem Statement ... 2 1.3 Purpose ... 3 1.4 Research Questions ... 3 1.5 Delimitation ... 3 1.6 Central Concepts ... 32
Frame of Reference ... 4
2.1 Management Control ... 4 2.2 The Budget ... 5 2.2.1 Definition ... 52.2.2 History and Development ... 5
2.2.3 The Purpose of the Budget ... 6
2.3 Criticism of the Budget ... 7
2.3.1 Budget as a Work Process ... 8
2.3.2 Budget as a Product ... 8
2.4 Argued Supplements and Substitutes to the Fixed Budget ... 9
2.4.1 Other Budgets and Forecasts ... 9
2.4.2 Activity Based Budgeting ... 10
2.4.3 Benchmarking ... 10 2.4.4 Balanced Scorecard ... 10 2.4.5 Beyond Budgeting ... 11 2.5 Previous Studies ... 11
3
Method ... 13
3.1 Research Methodology ... 13 3.1.1 Research Philosophy ... 13 3.1.2 Research Approach ... 14 3.1.3 Research Design ... 14 3.1.4 Research Strategy ... 14 3.2 Research Method ... 15 3.2.1 Sampling ... 15 3.2.2 Data Collection ... 15 3.2.3 Data Analysis ... 16 3.2.4 Ethical Considerations ... 17 3.3 Research Quality ... 17 3.3.1 Reliability ... 17 3.3.2 Validity ... 173.3.3 Limitations to the Study ... 17
3.3.4 Non-response ... 18
4
Results ... 20
4.1 Ability to Predict and Plan the Future ... 20
4.2 Overall Use and Perception of Fixed Budgets ... 21
4.2.1 The Overall Use of Fixed Budgets ... 21
4.2.2 Perception of Fixed Budgets ... 23
4.3.1 Supplements to the Fixed Budget ... 25
4.3.2 The Purposes of Using the Chosen Control Measures ... 27
4.4 Reasons and Purposes for Substituting Fixed Budgets ... 30
4.4.1 Substitutes to Fixed Budgets ... 30
4.4.2 The purposes of using the chosen control measures ... 31
5
Analysis ... 35
5.1 Ability to Predict and Plan the Future ... 35
5.2 Overall Use and Perception of Fixed Budgets ... 36
5.3 Supplement and Substitutes to the Fixed Budget ... 37
5.4 Purposes of Using Chosen Control Measures ... 38
6
Final Remarks ... 41
6.1 Conclusion ... 41
6.2 Implications ... 42
6.3 Further Research ... 42
Figures
Figure 4-1 Use of fixed budgets within subgroups based on stock-exchange
listings 2014 ... 22
Figure 4-2: Very important aspects in relation to aspects very good fulfilled by the fixed budget ... 29
Figure 4-3: Differences between 2003 and 2014 in percentage of respondents marking 6-7 ... 29
Figure 4-4: Very important aspects in relation to aspects very good fulfilled by substitutes to fixed budgets ... 33
Figure 4-5: Differences between respondents that consider/already have abolished the fixed budget 2003 and 2014 in percentage of respondents marking 6-7 ... 34
Tables
Table 3-1: Fundamental differences - quantitative and qualitative research designs ... 13Table 3-2: Respond rate by stock exchange list ... 18
Table 3-3: Response rate by industry ... 19
Table 4-1: Level of certainty when predict the future one-year in advance 2014 ... 20
Table 4-2: Levels of certainty when predict the future one-year in advance 1997 ... 21
Table 4-3: The overall use of fixed budgets 2014 ... 22
Table 4-4: Comparison over time of the use of fixed budgets ... 23
Table 4-5: The overall perception of fixed budgets including percentage change from 2003 ... 24
Table 4-6: Different types of supplements to the fixed budget ... 25
Table 4-7: Differences in use of supplements in 2014 compared to 2003 .... 26
Table 4-8: Numbers of used supplements to the fixed budget ... 26
Table 4-9: Purposes that are important when using the fixed budget with or without supplements ... 27
Table 4-10: Actual fulfilment of purposes when using the fixed budget with or without supplements ... 28
Table 4-11: Substitutes for the fixed budget ... 31
Table 4-12: Differences in use of substitutes 2003 and 2014 ... 31
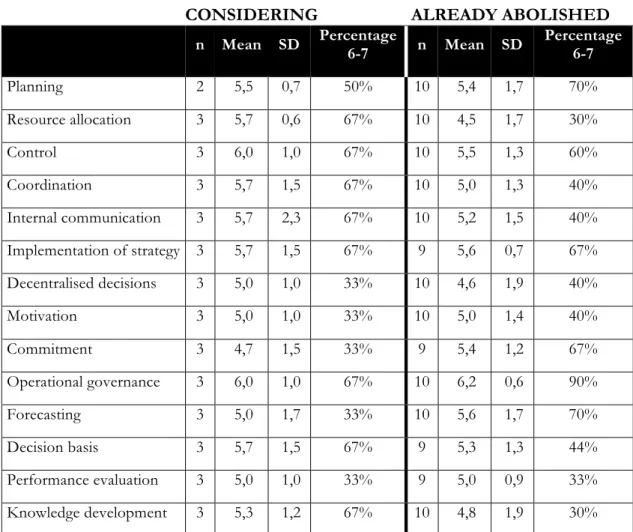
Table 4-13: Valued purposes when considering/using substitutes for fixed budgets ... 32
Table 4-14: Actual fulfilment of purposes when considering/using substitutes for fixed budgets ... 33
Appendix
Appendix 1 ... 46 Appendix 2 ... 47 Appendix 3 ... 60 Appendix 4 ... 61 Appendix 5 ... 641
Introduction
The first chapter will introduce the reader to the subject of this thesis, and with the help of the back-ground provide an understanding of the problem statement and purpose. Thereafter the research questions and delimitations of this thesis will be presented along with a list of central concepts.
1.1
Background
“Why should we look to the past in order to prepare for the future? Because there is no-where else to look.”
- James Burke (Burke, J, 2007, p. 287.)
The attempt of humans to use different tools to gain control of their surroundings dates back to 8000 B.C, this is long before any numeration system or written languages were used. Throughout history various tools and methods were developed and replaced in order to gain control over individual and organisational reality (Johanson & Skoog, 2001). Bruns-son (2005) describes it as the measuring society, where people strive to measure everything around them, developing new techniques to more accurately measure relationships that could only be roughly estimated before. One definition of management control, provided by Kullvén (2009), is that it is a process to identify, measure and communicate valuable fi-nancial information that enables well-grounded assessments and decisions by the user of the information. Hence, the measuring within the business world is conducted with the help of management accounting and control, and to achieve this, management needs con-trol measures; one that plays a central role is the budget (Ax, Johansson & Kullvén, 2011). The budget was first developed several hundred years ago and used within the public sec-tor, as parliaments and other legal bodies had to control public expenditure. It would take until after the Second World War for large private companies to introduce budgets in their own organisation, as an attempt to plan and predict the future (Greve, 2011). During the 1980s, Japanese companies positioned themselves on the world market, initiating an inter-est amongst American and European companies in the Japanese methods of quality and business control. As researchers tried to identify the underlying reasons for their success, Johnson and Kaplan pointed to malfunctioning management tools (Greve, 2011). More specifically they stated that the relevant management accounting information used by man-agers to plan and control companies were too late, too aggregated and too distorted (John-son & Kaplan, 1987).
The criticism by Johnson and Kaplan became the starting point for a revival within the area of management control during the 1990s (Nilsson, Olve & Parment, 2010). As the budget-ing filled a central role within management control, it had to endure much of the criticism; essentially critics stated that too much work and effort was put into the budgeting process, which in the end still was not able to fulfil intended purposes (Lindvall, 2011). It was ar-gued that budgets could not adapt to the faster changing world (Bergstrand, 2009). For ex-ample, Hope and Fraser (2003) argued that budgets only provide an illusion of control that can lead to an outcome that is undesirable and dysfunctional, in some cases even fraudu-lent, such as with Enron and WorldCom. In Sweden this was the second wave of intensive debate about the usefulness of budgets, the first was initiated already during the 1980s by Jan Wallander, the chairman of the board of directors for Svenska Handelsbanken
(Lindvall, 2011). Wallander argued that the budget was an unnecessary evil (“onödigt ont”), a waste of resources as it is based on predictions about the unknown future, making it out of date before the period even started (Wallander, 1995).
Nevertheless, the budget seemed to survive the criticism (Bergstand, 2009). A study con-ducted in 1997 stated that 89% of the publicly traded companies in Sweden were using the budget, however, out of them 40% were considering changing their budget-process (Jo-hansson, Nilsson, Nilsson & Samuelson, 1997). Six years later, in 2003, a similar study showed that 86% of the publicly traded companies in Sweden used budgets (Stolt, 2003). The result showed a rather small decline of 3 percentage points in the use of budgets, indi-cating that the majority of the 40% that were considering changing their budget process in 1997 did not abolish the budget. Groot and Selto (2013), further state that it is for most companies virtually impossible to operate completely without budgets, arguing that the budget will never be entirely abolished, rather continuously updated.
Beyond Budgeting Round Table (BBRT) has a different view, as an international network that advocates the abolishment of the annual fixed budget, they argue that companies should substitute the budget with rolling forecasts and relative targets in order to improve organisations bottom-line performance (Beyond Budgeting, 2014). Ekan Management, a management consulting company in Sweden, is since last year the Swedish official repre-sentative of BBRT (Ekan Management, 2013).
1.2
Problem Statement
The world today along with its markets is changing faster than before, leading to more complex business demands, especially for the private sector (Bergstrand, 2009). There is a need to constantly develop and improve products and job descriptions, and Lindvall (2011) argues that this will not change rather become the everyday life, which became apparent during the financial crisis of 2008-2009. Bergstrand (2009) further states that along with this accelerating speed, the advantages of the fixed budget are decreasing.
When contacting the four largest banks in Sweden to find out whether or not companies need a budget in order to take out a loan, the answers are the same. The company need to show the expected profits and results for the future, however if it is done via a budget or a forecast does not matter. However, when picking up an ordinary textbook within manage-ment control used by business students today, the chapter on budgets plays a central role, for example in a book by Ax et al. (2011), there is a whole bloc about budgeting, summing up to 91 pages.
So, there seem to exist a paradox, on one hand it is argued that companies should not use budgets but at the same time business students are still taught how to use them. And if budgets are in fact as bad as some argue, then how come companies still seem to be using them? Bergstrand (2009) argues that one reason could be that that the companies keep the fixed budget in order to have a standard to compare the outcome to, and that the budget still provides a sense of security. According to de Waal, Hermkens-Janssen and van de Ven (2011) the budget paradox exists instead due to the fact that organisations lack the need for change, because they are satisfied as it is with their use of budgets. Nevertheless, during 2013 an article was published where Knut Fahlén, consultant at Ekan Management, argued that the interest for abolishing the budget is now increasing, especially in Norway but also in Sweden (Jansson, 2013). Given the conclusion of de Waal et al. (2011) and the statement
from Knut Fahlén, can it be the case that we are getting closer to the point where compa-nies are starting to feel less satisfied, hence an increased interest in abolishing the budget? Seventeen years has passed since Johansson et al. (1997) conducted their study, and one cannot help wondering if the use of fixed budgets within publicly traded companies in Sweden have changed. Are companies still holding on to their budgets, or are they starting to abolish them?
1.3
Purpose
Given the problem statement, the purpose of this thesis is to examine the use and percep-tion of fixed budgets within larger companies of today and to clarify the reality behind the debate about the usefulness of budgets. Further, to get an understanding of what purposes are deemed as important when using different control measures, and how well these seem to be fulfilled.
1.4
Research Questions
1. How has the use of budgets within Swedish publicly traded companies changed since the study of Johansson et al. (1997)?
2. How has the perception of fixed budgets evolved since the study by Stolt (2003)? 3. What are the purposes of using different control measures, and how well are those
purposes fulfilled?
1.5
Delimitation
The focus of this thesis is on publicly traded companies, with headquarters in Sweden, listed on the NASDAQ OMX Stockholm stock exchange; more specifically companies listed on Small-, Mid- and Large Cap as of February 20, 2014. The reason for this focus is to make the data collected comparable to the earlier studies of Johansson et al., (1997) and Stolt (2003).
1.6
Central Concepts
Management control: Processes to identify, measure and communicate valuable financial information that enables well-grounded assessments and decisions by the user of the in-formation (Kullvén, 2009).
Management control measures: Tools used to fulfil the purpose of management control and reach the company’s financial goals (Ax et al., 2011).
Fixed Budget: The fixed budget is set, meaning that when the company decides on a budget, there are no changes made to it during the upcoming time period (Ax et al., 2011). Supplements: Control measures used in addition to the fixed budget.
2
Frame of Reference
This chapter will provide the reader with a frame of reference to be able to better assess and under-stand the results presented in chapter 4. First the management control as a subject is presented be-fore the focus will shift towards budgets, and argued supplements and substituted to the budget. The chapter ends with a short presentation of previous studies.
2.1
Management Control
There are many different definitions of what management control is, for example Natio-nalencyklopedin (2014) defines management control as deliberate influence on a activity and its executives in order to reach economical goals. Whereas Kullvén (2009) defines it as a process to identify, measure and communicate valuable financial information that enables well-grounded assessments and decisions by the user of the information. What the defini-tions have in common is the idea of providing information to be used as decision basis in order to reach financial goals.
The term management control was first used during the 1970s, when it became the collec-tive name for budgeting, product costing and management accounting, and along with it came concepts such as the need to control organisations (Greve, 2009). Ax et al. (2011) state that as the overall purpose with management control is to reach financial goals of the organisation, it has to be based on the organisations vision, business idea, strategy and op-erational plan, which all are interconnected. The vision and business ideas provides the ba-sis for the strategic work, and once the strategic plan is in place it can be further broken down into operational plans, where a part will be concerned with the management control of the organisation (Ax et al., 2011).
In order to steer the organisation towards achieving the goals, management control measures are needed. Ax et al. (2011) sort them into three categories: formal control measures, organisational structure and less formal controls. The formal control measures include for example budgeting, product costing and benchmarking, and are also considered to constitute the management control techniques. Organisational structure includes issues such as authority, responsibly, and rewards systems and is not only concerned with man-agement control but with business administration overall. The less formal controls, that have received more attention during the past two decades, include aspects such as corpo-rate cultures and empowerment (Ax et al., 2011). There are several influences affecting the structure of management control within a company, Nilsson et al. (2010) argue that the three main factors that have an influence on all organisations are: exposure to competition and customer orientation, more and distinct demands from different stakeholders, and IT development within Enterprise Resource Planning (EPR) systems. Lindvall (2011) further adds the increased globalisation as another influence.
The research within management control has grown both in terms of volume and scope during the last decades following the relevance debate started by Johnson and Kaplan (Nilsson et al., 2010). However, according to Nilsson et al. (2010) the key to good strategic management control is not what method to implement rather how the methods are imple-mented; a cost price calculation in itself is not right or wrong, instead it is how it is devel-oped, what data are used and how the cost is interpreted that will determine the success of the method.
2.2
The Budget
2.2.1 DefinitionThe word budget comes originally from the Latin word bulga, which means purse. Howev-er, it got its meaning in England, over two hundred years ago, as the finance minister would carry the state accounts in a leather briefcase, called the bowgette (English version of bulga). After a while, the name of the briefcase was transferred to the content receiving the meaning as we know it today (Greve, 2011).
Ax et al. (2011) define a budget as something that expresses expectations and commitments within an organisation in regard to financial consequences for an upcoming time period. It is important to stress that budgets are expressed expectations, as Greve (2011) points out, budgets are future oriented as they strive to predict the future based on a set of criteria and guesses, which is similar to a forecast. However, what differentiates them is that budgets al-locate responsibility (commitment), for example the head of the department is responsible for his/her part of the budget. It can also be perceived as a decision, that when the execu-tive management accepts a budget, they automatically decide upon what should be done in the nearest future, a trait not possessed by the forecast (Greve, 2011). Furthermore, the definition states that budgets are connected to financial consequences, which do not neces-sarily mean that they have to be expressed in a currency; non-financial components can al-so be a part of the budget, such as number of work hours (Ax et al., 2011). In the past, the budget has always been expressed in monetary terms, and the monetary terms are still the focus when constructing the budget (Greve, 2011). The final part of the definition refers to time, that the budget is covering a predetermined time period, which goes for all budgets including those covering a specific product or customer (Ax et al., 2011).
2.2.2 History and Development
Throughout the decades that have passed since the introduction of the budget, it has been transformed several times; mainly in regards to how it should be used. As more companies started to use the budget during the 1950s and 1960s, the main purpose was to plan and coordinate their business and the budget was often connected to the strategic plan due to the belief that set goals could be reached with budget as a tool. Hence, the budget played an important role within companies and the focus was on economic efficiency (Greve, 2011).
During 1970s signs of a faster and less predictable era for the world economy where given, as oil crises hit in 1973 and 1979 (Bergstrand, 2009). Few companies, if any, had predicted them, and the focus now shifted towards decentralisation, as companies realised that they had to become more flexible in their long-term planning. With the help of the budget, ex-ecutive management could control lower management, while delegating the right to make decision within the frames of the budget. Hence, the purpose was no longer only to plan for the future, but the budget had become a tool for control and evaluation of management performance (Greve, 2011).
In the early 1980s some people started to argue that the budget was too focused on mar-ginal changes, meaning that if a unit of the organisation asked for an increase of two mil-lion from the year before, the budget negotiation would revolve only around the increase of two million and not the whole amount. The implication of this lead to the method called zero-based budgeting, which stated that the whole organisation had to be reconsidered
dur-ing the budget process and not only the marginal increase/decrease, however, it never be-came a success. Following the achievements of Japanese businesses, the focus shifted from control and decentralisation to the flow of goods, and the internal value-adding process. Today the budget is a mixture of all the trends that has come during the past 60 years, even though the main point nowadays lie on flexibility (Greve, 2011).
2.2.3 The Purpose of the Budget
There are two overall competing purposes of the budget, according to Greve (2011): plan-ning and control. The different views on the purpose of budgets can be conflicting, for ex-ample due to different views on the individual. Even if management views the individual as rational, those using budgets with the purpose to control do not automatically assume that the individual will act by themselves to achieve the companies goals unless they are con-trolled. Nevertheless, they can also be complementary, as when the company use the budg-et to plan the operations but also to control the employees. Within both planning and con-trol there are various other sub-purposes that the budget can have, which one that will be more or less important will depend on several factors within the specific company, such as uncertainty of business environment, size and industry of the company or, the manage-ments leading philosophy (Greve, 2011). Kullvén (2009) further adds that an organisation does not need to have the same purpose within the whole organisation, as different units can use the budget for different purposes.
2.2.3.1 Budget for Planning
To use budgets for planning is influenced amongst other things by the decision theory, where according to this view one main activity within a company is decision-making. The decision maker is presumed to be rational and the decision itself will have a consequence for the company (Greve, 2011). According to Brunsson (2013) formal rationality within management refers to that the best and cheapest option, which will reach the set goals, will be made via analysis and logical reasoning. However, this does not imply that the rational decision as such will be the same for every organisation (Brunsson, 2013).
Greve (2011) points to five main functions that the budget provides that are especially im-portant when it is used for planning:
§ Resource allocation: The resources are to be distributed in the best possible way in or-der to achieve the set goals; specific consior-derations between short-term and long-term investments are made.
§ Forecasting: Before the budget is decided, several alternatives are evaluated which cre-ate forecasts covering different scenarios and consequences.
§ Coordination: By estimating the income, the budget ensures that a company has the capacity to in reality provide the products or services needed, hence coordinating among different functions within the company.
§ Control: If the budget is representing a standard, it can easily warn the management that something is off, if comparisons between the actual outcome and the standard is made. For example, if the costs of an activity are a lot more than budgeted, the
differ-ence can be analysed, providing the opportunity for management to take the necessary actions needed.
§ Knowledge Development: As the budget is created, it automatically forces the creators to reflect over all aspects within an organisation, hence increasing the overall knowledge about the organisation. The same goes for when the follow-ups are done and the result is analysed.
Bergstrand (2009) also point toward budgets usefulness as a tool when prioritising between expenditures, more specifically what projects to run and when. By adding all the above functions together, the budget becomes a support to and a basis for, the rational decision maker (Greve, 2011).
2.2.3.2 Budget for Control
When budgets are used for control, it becomes a tool that governs the employees towards fulfilling the set goals of the company. The purpose is to be able to delegate decision-making, which is especially important for larger companies in order to speed up the deci-sion process. This is done as the budget clarifies overall goals, breaks those goals down and designate who will be responsible for the achievement of them. When budgets are used for the purpose of control, the functions of budgets will differ as compared to when budgets are used for planning (Greve, 2011):
§ Commitment: As the budget is decided, the responsible manager commits to fulfilling the goals, given that the resources that will be needed are provided.
§ Performance evaluation: If an evaluation will be made on the performance of the re-sponsible manager, it is important that it is taken under consideration when the budget is created, because the goals has to be reachable, while allowing the responsible manag-er to effect the outcome (Greve, 2011). Ax et al. (2011) state that the evaluation could further be connected to an incentive system, hence connecting bonuses to the budget.
§ Motivation: The budget can provide clear goals, and by being involved in the budget process the employees can become more motivated to actually achieve the predeter-mined goals (Ax et al., 2011).
§ Communication: The budget provides an opportunity to spread the goals and targets from the top all the way down in the organisation (Greve, 2011).
These functions enable decentralisation, and as operative decisions can be taken on a lower level the evaluation of the responsible manager will be based on if the goals within the budget are reached, rather than on how the daily work is performed (Greve, 2011).
2.3
Criticism of the Budget
One of the first to voice his criticism against the budget was Jan Wallander, who during the 1980s started an intensive debate in Sweden as he called the budget “an unnecessary evil” (Nilsson et al., 2010). The international debate arose by the turn of the century as Hope and Frasers (1997; 2003) critical voices were heard. When the budget is criticised it is usual-ly either towards the budget as a work process or as a product (Lindvall, 2011).
2.3.1 Budget as a Work Process
In regard to the budgeting process, it is argued that much time and effort is put into creat-ing a budget which becomes too detailed, and accordcreat-ing to Hope and Fraser (2003a) up to 30% of the management’s time is spent on the budget process, hence a waste of resources as Wallander (1995) referred to the budget. Furthermore, if the budget is to be motivation-al, even more time and effort has to be put into it, as more people have to become in-volved in the process (Ax et al., 2011). Due to additional time constraints, the budget is of-ten rushed in order to meet the deadline; leading to that less time is actually spent on anal-yses and discussions (Lindvall, 2011). This could result in that the budget becomes based on random assumptions rather than on more analysed forecasts. Further issues raised is that the budget is usually on a calendar year basis, which may have nothing to do with how the company operates, as perhaps other periods are more interesting to the organisations (Ax et al., 2011). Instead of having a too detailed budget, organisations need more motivat-ed managers that strive to perform their best (Bergstrand, 2009). The answers are accord-ing to Wallander (1999) decentralisation without constraints of a budget, as it will get the employees to become involved.
2.3.2 Budget as a Product
The budget as a product is criticised mainly for its fundamental aspect, that it cannot fulfil the purposes for which it is intended (Lindvall, 2011). Perhaps the more frequent argument against the budget is that it is out of date when it becomes operational (Ax et al., 2011). For example, Lindvall (2011) points out that it can take up to 18 months from when the budget process starts and when the budget year is completed, hence there is much that can happen during this time. Maria Wennebro, consultant at Ekan Management, argues that there is an unused potential in real-time data, something that the budget cannot incorporate (1Company, 2012). Other arguments against the budget mentioned by Ax et al. (2011) is that it is sub optimised which could lead to rivalry behaviour among units as each unit only cares about itself and not the whole organisation. It is also argued that the budget can lead to an internal political game. Meaning that rather than focusing on making good business it becomes more important to spend the money in the budget, due to belief that if there is money left by the end of the year, the unit will receive less next year (Ax et al., 2011). Pfef-fer (2003) also argues that it can have the opposite effect, where fear of spending money can result in missed business opportunities.
Both Wallander (1999) and Hope and Fraser (2003a) argued that holding on to the budget, that may be wrong, is dangerous as it hinders the organisation from responding to the mar-ket changes in time, this due to the conservative traits of the budget. Along with the faster changing markets, Bergstrand (2009) argue the advantages of the fixed budget are decreas-ing. Hope and Fraser (1997) described this change as the third wave, referring to a new age of information, ending the industrial era. Along with this change, the budget is not longer capable of meeting the demands of the more competitive environment that is emerging as it is bureaucratic and rigid which only provides a false sense of security. Hence, according to Hope and Fraser (1997) the budget is outmoded; as the key resources are not longer fi-nancial capital as it was during the industrial era but rather intellectual capital. By using a budget that is too centralised the intellectual capital is easily ignored, as it cannot easily be measured in financial terms (Greve, 2011).
In terms of using the budget as a basis for performance evaluation, Hope and Fraser (2003b) argue that it is not effective, instead the rewards should be connected to relative targets, as they refer to budget targets as “… hollow promises to investors …” (Hope and Fra-ser, 2003a, p.110). Shim and Siegel (2008) further argue that fixed targets can make the managers set modest goals and be rewarded while those who set ambitious goals get penal-ised if they are missed, which is a hinder of innovation.
2.4
Argued Supplements and Substitutes to the Fixed Budget
2.4.1 Other Budgets and Forecasts
As mentioned earlier one main difference between budgets and forecasts, is that the budget allocates responsibility and provides a decision basis. Bergstrand (2010) further states that a forecast does not consist of as many details as the budget, hence by using less details it can be created, revised and updated a lot faster while being easier to analyse.
There are several types of other budgets/forecasts:
§ Revised budget/forecast: A revised budget/forecast will be updated as time passes, usually quarterly or according to another pre-set interval, and it is the remaining part of the budget that is updated, hence becoming shorter and shorter as the time period in total does not change. The positive aspect of a revised budget is that it stays updated, the gap between expected and actual outcome shrinks while increasing the motivation of employees. A negative aspect could be that commitment is harder to attain via the revised budget as there is no set reference points and the performance evaluation be-comes trickier to make (Ax et al., 2011).
§ Rolling budget/forecast: The only difference between the revised and the rolling budg-et, is that the former has the same predetermined end date whereas with the rolling budget the time horizon is constantly moved forward. This means that a new budget is created to cover the next quarter as the first quarter passes; hence the budget becomes more realistic. By using a rolling budget the knowledge development is on-going be-cause you constantly work with it, other positive aspects include decrease in internal political games. Which as already stated is a tendency of spending the last money at the end of the year because one is afraid that if money will be left, the amount will be lower the next year (Ax et al., 2011). Bergstrand (2009) further states that many new compa-nies never develop budgets, rather they rely on rolling forecasts as their main planning system. However, as the rolling budget/forecast does not have a start or end, frustra-tion could arise as it becomes a never-ending story (Ax et al., 2011).
§ Variable budget/forecast: Basically the variable budget represents the relationship be-tween sales, resources and cost, allowing the budgeted numbers to be updated as one of these variables change (Bergstrand, 2009). This budget is suitable when operation volumes are not completely known, however it cannot provide any commitment for certain volumes and it is time-consuming to constantly have to recalculate the budg-et/forecast (Ax et al., 2011).
2.4.2 Activity Based Budgeting
Activity Based Costing is a method developed during 1980s where indirect cost is allocated on cost objects, such as products or regions, by following resource consumption. Activity Based Budgeting is a model that focuses on major activates performed by an organisation rather than compared to the traditional budget that focuses on organisational units such as departments. The activity based budget also acts in response (“pulled” by) sales orders or forecasts sales, which provides a better understanding of the operational process, instead of the traditional budgets approach that allocates (“pushes”) budgets onto products. It is ar-gued that activity based budget provides a more transparent process that can reduce budget tactics behaviour while providing a better coordination and adaption (Groot & Selto, 2013).
2.4.3 Benchmarking
Benchmarking is about making comparisons, where the company or parts of the company is set in relation to internal or external best practices. The purpose is to improve the com-pany by inspiration and learning from others, mainly within two aspects: performance measurement and process management (Ax et al., 2011). By using benchmarking, compa-nies can compare their target to external best practices; something that a budget does not, as it only focuses on internal aspects (Hope & Fraser, 2003).
2.4.4 Balanced Scorecard
Kaplan and Norton (1992) argued that you get what you measure, and that traditional fi-nancial accounting measures provide misleading signals within areas such as improvement and innovation. To provide managers with a balanced view of the company, in terms of presenting both financial and operational measures in one, Kaplan and Norton created the balanced scorecard. By including four main perceptive, each including a limited number of measures, the information overload can be minimised. The four perspectives of the balanc-es scorecard are:
§ Customer perspective - How do customers view the company?
§ Internal perspective - How can the company stand out and meet the expectations of the customers?
§ Innovation and learning perspective - Due to increased competition, how can the com-pany improve their business?
§ Financial perspective – Based on profit and growth, how do the company acknowledge its shareholders?
(Kaplan & Norton, 1992)
The overall idea is that companies should create their own individual scorecards based on their organisation (Kaplan & Norton, 1992). For example, ABB added an extra perspective, the employee perspective, that concerns competence development, sick absence rate and employee satisfaction (Bergstrand, 2009).
2.4.5 Beyond Budgeting
The base of the Beyond Budgeting model is the experiences of Svenska Handelsbanken, where target setting has substituted budgets (Groot & Selto, 2013). The core principles within the Beyond Budgeting model is according to Groot and Selto (2013):
1. Decentralisation of decision-making to empowered units – without any constraint of a budget, the managers will be able to more quickly adapt to changing circum-stances.
2. Corporate management based on business principles and clan based controls – in-stead of focusing on centralised planning and result control, as the fixed budget, corporate management should be focused on centrally defined business principles, which allows the decentralised management to decide by themselves how plans should be executed.
3. Relative performance assessment with hindsight – the evaluation of performance should be conducted with benchmarking, comparing local units to other internal or external units.
4. Organisation based on financial rewards and unit based non-financial rewards – the financial compensations should not be on an individual unit level, but on the com-panies overall results, hence decreasing any potential problems with internal rivalry.
Hope and Fraser (2003a) argue that many companies choose to use rolling forecasts when going beyond budgeting, mainly because they are constantly updated with the latest infor-mation and by not having any fixed targets as the budget has, there is no reason to manipu-late the numbers.
2.5
Previous Studies
In the study by Johansson et al. (1997), which got a response rate of 54%, 89% of the pub-licly traded companies in Sweden stated that they use budgets. However 40% also stated that they were planning to change their current budgeting process, out of which 13% an-swered that they where considering abolishing the budget and replacing it with forecasts. Other changes considered were supplementing the budget with forecasts or with non-financial plans. When assessing the future one-year in advance in regard to specific factors, the respondents stated that the three main factors that were the hardest to predict were demand, price on inputs and societal regulation. The researchers stated that the latter could be the effect from when Sweden joined the European Union. In terms of multiannual plans 55% of the companies answered that they used multiannual plans, where the average time horizon was 3 years.
Six year later, Stolt (2003) conducted a similar study where 34% of all publicly traded com-panies in Sweden participated, and the focus was on budgets alone. At this point 86% re-sponded that they use a fixed budget, 12% had abolished it and 10% stated that they were considering abolishing it. Hence, there had been a slight decrease in the use of fixed budget and those considering abolishing the fixed budget, when compared to 1997. The level of certainty when predicting the future was higher than before in all aspects, however, de-mand was still regarded to be the hardest to predict. In the use of multiannual plans, there
was a slight decrease as 53% stated that they use them, while the most common time hori-zon was still 3 years. In addition to the study of 1997, the respondents were asked about their perception of the fixed budget, where the respondents overall agreed the strongest about that the fixed budget creates goals for the future, and that it is often on a calendar year basis which is not necessarily the best period, see appendix 5. The respondents in the study were divided into two groups, radical and conservative, the former being companies that already had abolished the fixed budget and conservative those that had kept it. The perception of the conservative when compared to the radical in terms of the fixed budget was not as negative, which can be expected. It was only that the budget is based on uncer-tain outlooks and it being an annual ritual that both groups agreed upon.
In 2011, Ekan Management conducted with the help of HandelsConsulting, a survey among Business Controllers in Sweden. Out of the respondents, 67% stated that there is a need to develop simulation and forward-looking analysis. In order to stay competitive, 76% stated that there is a need for management processes that are compatible with the business, hence providing a better basis for decisions (Ekan Management, 2011). Malin Wennebro, consultant at Ekan Management, argued that this indicates an increasing interest in explor-ing new ways to control companies, hence goexplor-ing beyond budgetexplor-ing. She further states, that this increase is not only the results of recent macroeconomic fluctuations but also because there is an unused potential in the real-time data that is available due to technological ad-vances, hence why management should govern their companies based on current infor-mation rather than on predictions made one year ago (1Company, 2012).
3
Method
This section will first provide the reader with an understanding of methodology in terms of research philosophy, approaches, designs and strategies. Afterwards, a presentation of the method chosen for this thesis will be presented followed by a quality assessment of the selected method and analysis of the collected data.
3.1
Research Methodology
Research is conducted in order to understand different phenomena, whether it is on an ac-ademic level, or in everyday life, it is a procedure of solving problems under certain circum-stances by gathering and analysing information (Ghauri & Grønhaug, 2010). But before one can start to gather and analyse information, there is a need to clarify some factors that will affect the process of conducting research (Bryman & Bell, 2011). Good to keep in mind is that there are many more scientific ideologies and methods than those that will be presented in this thesis. Table 3-1 provides a simplified overview on the differences between the two main research designs, quantitative and qualitative. In practise, the distinctions are not as clearly cut as presented, and the researchers do not always endorse all of the features presented (Bryman & Bell, 2011).
Quantitative Qualitative
Research philosophy Positivism Interpretivism
Research approach Deductive Inductive
Research emphasis Testing and verification Understanding Research strategy Survey - Experiments Case study - Ethnography Table 3-1: Fundamental differences - quantitative and qualitative research designs
Source: Own interpretation of a brief outline by Bryman & Bell, (2011), Ghauri & Grønhaug, (2010) and Saunders et al. (2012).
3.1.1 Research Philosophy
Research philosophy is the way one views the world, as it relates to the development and nature of knowledge, so it is important to understand it, because new knowledge is devel-oped when conducting research. What is or should be viewed as an acceptable knowledge is a part of the epistemology, where the two opposite views are; positivism, where facts are based on observable phenomena, and interpretivism, stating that the social scientist has to include the meaning of social action (Bryman & Bell, 2011). When the purpose is to gener-alise and search for regularities, the philosophy of positivism is reflected (Saunders, 2012), which is the case in this thesis.
3.1.2 Research Approach
The relationship between theory and research is described by deductive and inductive theo-ry (Btheo-ryman & Bell, 2011). Deductive theotheo-ry is often associated with quantitative research, as the hypothesis is based on existing knowledge and where theory influences the research. The inductive approach on the other hand is commonly associated with qualitative re-search, where conclusions are drawn from observations and theory becomes the outcome rather than the basis (Ghauri & Grønhaug, 2010). The main purpose of thesis is to describe what is happening and comparing it with theory rather than looking on why something is happening and develop a theory, hence a deductive approach is predominant.
3.1.3 Research Design
Before selecting a research method to be used when collecting the actual data, a research design has to be chosen and it can be of quantitative or qualitative nature (Bryman & Bell, 2011). The main difference between them is that quantitative research uses measurement, hence being numeric, in contrast to qualitative research, which is non-numeric (Ghauri & Grønhaug, 2010). As previously seen in table 3-1, a quantitative design should be selected when the emphasis of the research lies on testing and verification, rather than on under-standing as with the qualitative design, hence why a deductive approach is also more com-mon when conducting quantitative studies (Ghauri & Grønhaug, 2010). However, accord-ing to Jupp (2006), it is important to acknowledge that one can combine the two research designs by using a mixed method research, which is the case for this thesis. Predominantly the thesis is quantitative, because the data collected will be analysed statistically in order to generalise the population and to make comparisons to previous studies. The qualitative fea-ture is only present in the data collection process due to the open-ended questions, where they complement the otherwise standardized questions. By allowing respondents to add their own comments and thoughts, a deeper understanding is provided in regards to the underlying reasons to why a company is using a fixed budget or not. To simultaneously combine quantitative and qualitative design, is a method known as concurrent technique (Jupp, 2006).
3.1.4 Research Strategy
The strategy is a plan for how to gather data in order to answer the research questions. There are several different strategies to choose from, such as surveys, experiments, case study or ethnography (Saunders et al., 2012). Given that this thesis is predominantly of a quantitative nature with a deductive approach, survey is the best option, especially when considering the number of participants that is needed in order to make generalisations for the whole population, hence a case study is not an alternative. Additionally, by using a self-administrated survey, where the respondents answer the questions by themselves at their own convenience, one can collect answers from many respondents in a more efficient way, which is an advantage if compared to, for example a telephone survey where the respond-ents would be bound by a specific time (Bryman & Bell, 2011).
As the Internet and online communication have expanded since the early 1990s so have the E-research, especially online surveys, where the researcher gathers data either by e-mail surveys or web surveys (Bryman & Bell, 2011). By combining a self-administrated survey with the possibilities of E-research, more specifically using a self-administrative web survey,
there are additional advantages present, such as questions can be filtered and automatically skipped depending on the answers given, hence minimising the risk of confusion. The web based software also automatically summaries the answers, which decreases possible errors in the result due to manual mistakes during the compilation (Bryman & Bell, 2011).
3.2
Research Method
3.2.1 Sampling
The population for this survey is Swedish publicly traded companies traded on NASDAQ OMX Nordic Stockholm stock exchange, listed on Small-, Mid- and Large Cap. On Febru-ary 20, 2014 there was a total of 235 companies listed accordingly to the stated require-ments. As the number of the whole population is manageable, the data will be collected and further analysed from the entire population, therefore when using census data no sam-pling is needed (Saunders et al., 2012).
3.2.2 Data Collection
The data collected can be divided into secondary and primary data. Secondary data is data already collected but for another purpose, including such as books, academic articles and previous studies. Primary data on the other hand is original data collected by the researcher to answer a specific research problem, most commonly used are observations, experiments, surveys or interviews (Ghauri & Grønhaug, 2010). Before the primary data in this thesis was collected via the self-administrative web survey, a literature review was concocted in order to collect secondary data that could provide more information about the research problem.
3.2.2.1 Literature Review
In order to get a better understanding of the research problem and create a base for the primary data collection, a literature review should be conducted (Ghauri & Grønhaug, 2010). In this specific case, the secondary data was gathered via using Jönköping Universi-ty’s Library Catalogue Primo, the database Business Source Premier and the search engine Google Scholar. Examples of search words used are: management control, budget, budget management, beyond budgeting, fixed budget, and abolishing of the budget. Additional secondary data was gathered by searching in DiVA (Digitala Vetenskapliga Arkivet) for previous studies, for the purpose of inspiration.
3.2.2.2 Empirical Findings
The self-administrative survey was created online, using Qualtrics as the web-based survey provider in order to allow the participants to answer the survey at their convince and not having to manually send the answers back as with for example a postal survey. The link to the web survey was distributed via e-mail to the companies’ Chief Financial Officer (CFO), but to make sure that the e-mail would not be regarded as spam or junk mail, a postal letter (see appendix 1) was sent beforehand. The postal letters presented the topic and purpose of the survey while giving notice to that an e-mail would be sent within a couple of days. Each
of the letters was signed in order to have the recipient feel that it was not a mass send-out. Furthermore, possibility to access the survey manually with the help of a link and password was also provided. To give a more serious impression both the letter and the web survey had the logo of Jönköping International Business School. By using Qualtrics as a web sur-vey provider the e-mail invitations were sent via them, making sure that no double entries would be possible and later on be able to send out reminders to those who had not re-sponded while allowing the respondents be anonymous. The postal letter was sent on March 12, 2014, the first e-mail on March 18, 2014 and a reminder e-mail on April 1, 2014 to those who had not yet responded.
The name and postal addresses to the CFOs where found via the companies own websites, however, getting the direct e-mail addresses was not as easy. In those cases a direct e-mail address to the CFO was not provided, the link to the survey was e-mailed to the infor-mation desk with a request to be forwarded to the CFO.
The survey (see appendix 2) was standardised, combining both closed- and open-end ques-tions. Some of the questions where copied from the studies of Johansson et al. (1997) and Stolt (2003), in favour of making the data collected comparable. Advantages with closed-end question are that they increase the comparability, providing an easier process of inter-preting the answers. But there can be a difficulty of making answers mutually exclusive, causing frustration as the respondents are not able to categorize themselves accordingly. In order to prevent this frustration, many of the questions had the option of “other”, and when selected an open-end follow-up question would appear, allowing the respondent to answer in their own terms or elaborate when needed. Open-end questions further allow the researcher to get a feel of the respondents’ different levels of knowledge, but time becomes an issue in terms of administrating the answers (Bryman & Bell, 2011). Before sending out the survey link, the survey was pre-tested in order to make sure that all questions were in the right order and the question were also discussed during a thesis seminar.
3.2.3 Data Analysis
The results from the survey have been sorted and broken down according to the research questions. The number of respondents (n) who answered a specific question is always pre-sented, and then depending on what type of question, the mean values (mean) and standard deviations (SD) are shown as well as the percentages of the respondents that have an-swered 1 or 2, and 6 or 7 on a seven-point Likert scale. The latter is added to provide addi-tional information about the antipoles. Comparisons to the results from previous studies are presented in connection to the empirical findings of this study when it is possible. Not all questions are comparable at all or with both the studies from 1997 and 2003, as Stolt (2003) focused her study towards budgets while Johansson et al. (1997) had a wider ap-proach to management control. However, in order to make comparisons to the study from 1997, table 4-1 has an additional column presenting the percentage of the respondents who answered between 5 and 7 on the seven-point Likert scale, as this was how Johansson et al. (1997) presented their results. As some of the questions have been further developed from the previous studies, there are some values that cannot be compared, instead it is stated N/A, which means non applicable. The text responses from the open-ended questions were analysed by isolating key issues that were identified from the answers.
3.2.4 Ethical Considerations
When research is conducted, it is important to consider ethics in terms of standards of be-haviour in relation to the rights of those involved (Saunders et al., 2012). Bryman and Bell (2011) presents four areas that are important to consider: harm to participants, lack of in-formed consent, invasion of privacy and deception. Due to the method in this thesis, it is not possible to harm participants physically, however considerations to other areas of po-tential harm, such as stress or sensitive subjects, can be taken into account as well as inva-sion of privacy when constructing the survey. Hence, the survey was filled in anonymously and the respondents were never forced to answer a question in the survey in order to be able to continue. By being clear and honest in the communication from the beginning one can reduce the risk of uninformed consent as well as deception, which is why several non-participants read both the postal letter, invitation and reminder e-mail before they were sent to the participants.
3.3
Research Quality
3.3.1 Reliability
Reliability is about the consistency of measure, meaning whether or not the data collection technique will yield consistent findings and if other researchers would reach the same con-clusions. For this to be the case the process has to be transparent (Saunders et al., 2012). Given that the research strategy for this study is a self-administrative web survey any influ-ence from the researcher is minimised, if compared to for example structured interviews, where characteristics of the interviewer could affect the answers by the respondents (Bry-man and Bell, 2011). Hence, the reliability for this research strategy is high, as another re-searcher would get the same results, as long as not too much time passes and the compa-nies change their management control. Furthermore, as the study is based on census data it further increases the reliability as the risk of error in the sampling process is minimised.
3.3.2 Validity
A valid questionnaire will enable the data collected to measure what it is intended to meas-ure, in other words it will enable the collected data to represent the reality (Saunders et al., 2012). As this study is based on two previous studies, the majority of the questions were the same in order to provide comparable results; hence the questions have already been tested for validity. Still, the survey was pre-tested in order to conclude that the questions reflected the specific purpose and research questions of this thesis. By having completed the literature review before compiling the results, the validity is further increased as the chances of identifying doubtful results increase along with the knowledge of the researcher (Bryman and Bell, 2011).
3.3.3 Limitations to the Study
One of the major problems with using a self-administrated survey is the risk of a low re-sponse rate, and in an attempt to increase the rere-sponse rate, Bryman & Bell (2011) presents a couple of steps, such as: writing a good covering letter introducing the subject, not too many questions and a attractive layout. When the response rate is low, the result may not
be representative of the population, usually because those who do not respond differ from those that do (Ghauri & Grønhaug, 2010). However, the reason why respondents are not participating can be many, for this thesis reaching everyone and time was the main issue. In terms of reaching the participants, not all companies CFO had posted their direct e-mail addresses. Many respondents also answered via e-mail stating that according to company policies they are not allowed to participate due to lack of time.
3.3.4 Non-response
The survey was sent out to 235 companies, out of which 58 participated, hence a response rate of 25%, and to be able to generalize the results for the whole population, the result has to be representative. In order to get a better understanding of which companies participat-ed in the survey and if the results are representative, the participating companies have been categorised based on what stock-exchange list and industry they are operating within. In terms of stock-exchange listings, small cap are for companies with a stock market value of less than 150 million euro, companies listed on Mid Cap have a stock market value of be-tween 150 million and 1 billion euro, and Large Cap are for companies that have a stock market value exceeding 1 billion euro (Aktiespararna, n.d.). The response rate divided by what stock exchange list the company is listed on is given in table 3-2, where the larger companies in terms of stock market value are underrepresented when compared to the other two.
Number of
companies respondents Number of Response rate
Small Cap 108 30 28 %
Mid Cap 69 18 26 %
Large Cap 58 10 17 %
Total 235 58 25 %
Table 3-2: Respond rate by stock exchange list
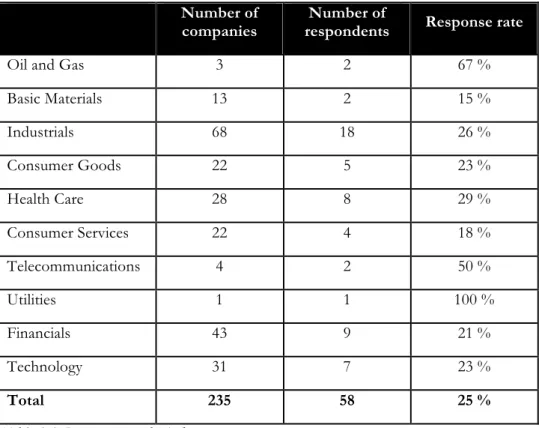
Table 3-3 presents the response rate by industry, where utilities, oil and gas, and telecom-munications are industries that are overrepresented, though given the total number of companies within those industries, the overrepresentation is hard to avoid. Basic materials and consumer services however, are slightly underrepresented. The companies in table 3-3 are classified according to the Industry Classification Benchmark (ICB), which is the classi-fication system used by NASDAQ OMX Nordic Exchange (OMX Nordic Exchange, 2014).
Number of companies
Number of
respondents Response rate
Oil and Gas 3 2 67 %
Basic Materials 13 2 15 % Industrials 68 18 26 % Consumer Goods 22 5 23 % Health Care 28 8 29 % Consumer Services 22 4 18 % Telecommunications 4 2 50 % Utilities 1 1 100 % Financials 43 9 21 % Technology 31 7 23 % Total 235 58 25 %
4
Results
This chapter will present the results from the survey along with results from previous studies in order to provide a solid base for the analysis. First the overall ability to predict and plan for the future is presented, followed by a presentation of the overall use and perception of the fixed budget amongst the respondents. To provide the reader with a deeper understanding, the results in the last two sub-chapters are broken down according to whether or not the companies use a fixed budget.
4.1
Ability to Predict and Plan the Future
The respondents were asked to answer with what certainty they could predict the situation of different areas one year in advance, where number 1 equals low degree of certainty while 7 equal high degree of certainty. According to the mean values of the respondents, the de-gree of certainty is the lowest within demand and competitor behaviour, and the highest for manufacturing technology, see table 4-1. The percentage of the respondents answering 6-7, show that only 5% would state that demand can be predicted with a high degree of certainty. n Mean SD Percentage 1-2 Percentage 6-7 Percentage 5-7 Manufacturing technology 52 5,5 1,4 4% 67% 79% Competitor behaviour 56 4,2 1,4 9% 11% 43%
Demand (price, volumes) 56 4,0 1,3 9% 5% 29%
Availability of inputs 52 4,9 1,3 4% 35% 69%
Price of inputs 54 4,7 1,2 4% 26% 61%
Societal regulation 56 5,0 1,4 5% 43% 70%
Actions by labour org. 56 4,9 1,2 2% 30% 66%
Table 4-1: Level of certainty when predict the future one-year in advance 2014
Since 1997 there has been a decrease in the mean values within manufacturing technology, competitor behaviour, demand, and availability of inputs, meaning it has become harder to predict the future for the specific areas, see table 4-2. When comparing the percentage of re-spondents who answered 5-7, the largest percentage decrease is for the certainty to predict competitor behaviour with -31%, followed by demand with -27%. Whereas the certainty to predict price of inputs and societal regulations has increased by 46% and 83% respectively, see the last column in table 4-2.
n Mean SD Percentage 5-7 Difference percentage Manufacturing technology 82 5,8 1,1 89% -11% Competitor behaviour 96 4,6 1,2 62% -31%
Demand (price, volumes) 99 4,0 1,3 39% -27%
Availability of inputs 80 5,4 1,1 76% -9%
Price of inputs 81 4,1 1,4 42% 46%
Societal regulation 94 4,0 1,6 38% 83%
Actions by labour org. 92 4,9 1,4 60% 10%
Table 4-2: Levels of certainty when predict the future one-year in advance 1997
In regard to long-term planning, the respondents were asked if they compiled multiannual financial plans, and if so, for how many years in advanced. 82% stated that they do, where 52% plan for 3 years. When categorising the results according to the use of fixed budgets, see appendix 3, 50% of those not supplementing the fixed budget do not use multiannual plans, while the other half plans for 3 years. The companies that abolished the fixed budg-et either plan for 3 years (56%), 5 years (30%) or not at all (30%), while those who supple-ment the fixed budget are the category that plans the most, as only 10% do not use multi-annual plans.
The use of multiannual financial plans has increased when comparing the 82% that re-sponded that they use multiannual plans, to the 55% in 1997, and 53% in 2003. Indicating that there has been a rather large alteration in how companies plan of the future. However, 3-year plans were and still are the main time horizon used.
4.2
Overall Use and Perception of Fixed Budgets
The companies will hereinafter be divided into two main groups consisting of two sub-groups each, to provide a further break down of the answers. The division will be as fol-lows: the first group will include those that use the fixed budget (with no supplements and with supplements) and the second group will include those not using the fixed budget (those considering abolishing and those that already abolished the fixed budget).
4.2.1 The Overall Use of Fixed Budgets
The main question in the survey was to clarify the use of fixed budgets, as shown in table 4-3. There were two additional options in the survey that respondents could choose, besides those presented in table 4-3, one asking if they are in the process of abolishing and the se-cond one if they had once abolished the fixed budget but reinstated it again. 19% of the companies stated that they have completely abolished the budget, leaving 81% that still use the fixed budget in one way or another, and even though 5% are considering abolishing it the majority of 67% supplement the fixed budget. The remaining 9% use only the fixed budget; hence no other control measures are used as supplements.
n Percentage
We only use the fixed budget 5 9%
We supplement the fixed budget 39 67%
We are thinking about abolishing the fixed budget 3 5% We have abolished the fixed budget 11 19%
Total 58 100%
Table 4-3: The overall use of fixed budgets 2014
Figure 4-1 provides an overview of the subgroups and the stock-exchange list the different companies are listed on. Out of the participating companies, 80% that only use the fixed budget are listed on the Small Cap, whereas 45% of the companies that already had abol-ished the budget are found in the Large Cap segment. Hence, if the result is representative, there is a greater chance that smaller companies will use the fixed budget than large com-panies.
Figure 4-1 Use of fixed budgets within subgroups based on stock-exchange listings 2014
When comparing the results to pervious studies of Johansson et al. (1997) and Stolt (2003), there has been a decrease in the use of fixed budgets; hence more companies are abolishing the fixed budget, see table 4-4. However, the numbers of companies considering abolishing fixed budgets has decreased since 1997, indicating that the perceived need to abolish the budget could be diminishing.
0% 10% 20% 30% 40% 50% 60% 70% 80% 90% 100% No complements Complements Considering abolishing Already Abolished Large Cap Mid Cap Small Cap