Nr 325 A » 1982 ISSN 0347-6049
325A
Statens vag- och trafikinstitut (VTI) * 581 01 Linkoping National Road& Traffic Research Institute ® S-581 01 Linkoping ® Sweden
Description of methodology concerning
the identification of two generation
mechanismsfor tire/road noise andthe
differentiation ofthe noise
mto the two
mechanisms
byUlf
Sandberg
The National Swedish
Road and Traffic Research
Institute
and
f
Guy Descornet
Nr 325 A o 1982 ISSN 0347-6049
Statens vt xg- och tra kinstitut (VTI) 0 581 01 Linképing
National Road 8: Traffic Research Institute 0 5.581 01 Linképing ' Sweden
Description of methodology concerning
the identi cation of two generation
mechanisms for tire/road noise and the
diiierentiation at the noise into the two
mechanisms
by Ult Sandberg
The National Swedish Road and Traf c Research
Institute
and
Guy Descornet
PREFACE
In a previous paper the mechanisms of tire/road noise generation were
investigated:
SANDBERG, U; DESCORNET, G: Road surface influence on tire/road noise Part I
DESCORNET, G; SANDBERG, U: Road surface influence on tire/road
noise - Part II
VTI preprint No. 56, National Swedish Road and Traffic Research Institute, Linkoping (also proceedings of INTER-NOISE 80, Miami 1980). A quite complicated technique was used to differentiate the total tire/road noise on the two noise generating mechanisms that were identified. Unfortunately, space limitations in the paper prevented the description of the calculating methods that were used.
This report is an attempt to explain the methodology referred to above. For the reader's convenience, the original conference paper is included as an appendix. It may be a good idea to read part I of this appendix first, then this report and lastly part II of the appendix.
CONTENTS PREFACE REFERAT ABSTRACT I. 2. 10. INTRODUCTION DATA COLLECTION
CORRELATION BETWEEN NOISE AND ROAD TEXTURE AS A FUNCTION OF ACOUSTIC FREQUENCY AND TEXTURE WAVELENGTH
THE CRITICAL FREQUENCIES AND WAVELENGTHS MAIN CONCLUSIONS FROM THE CORRELATION STUDY A MODEL BASED ON DIFFERENTIATION OF THE NOISE INTO PARTIAL SPECTRA
THE INFLUENCE OF TIRE TEXTURE
CALCULATION OF THE CONTRIBUTION TO A-WEIGHTED SPL OF EACH MECHANISM
CONCLUDING REMARKS REFERENCES
APPENDIX
VTI MEDDELANDE 325A
II II 16 I9 20 21
Beskrivning av metodik rdrande identifiering av tvé alstringsmekanismer
for dack/vagbanebuller och differentiering av bullret pa de tvé mekanis-merna.
av Ulf Sandberg
Statens vag- och trafikinstitut
581 01 LINKOPING
och Guy Descornet
Centre de Recherches Routieres
42, Ed de la Woluwe
13-1200 BRYSSEL Belgien REFERAT
Detta meddelande beskriver den ber'akningsmetodik som anv ants 1 en tidigare presenterad konferensrapport, "Road Surface In uence on Tire/Road Noise", och som av utrymmesskal inte kunde presenteras dari. Konferensrapporten inkluderas i form av en bilaga i meddelandet.
Metoder som anvants for att underséka korrelationen mellan spektrala egenskaper hos externt d'ack/vagbanebuller och vagytors makrotextur beskrivs. Resultatet av korrelationsanalysen 5r att korrelationskoef ci-enten mellan buller och v'agytetextur kan anges som funktion av bade akustisk frekvens och vagtexturens vaglangd. Utifrén n'armare studier av denna korrelation, dras slutsatsen att bullret alstras av tvé oberoende mekanismer, aktiva i var sitt frekvensomrade.
En model! som beskriver hur det totala d'ack/vagbanebullret sammansatts
av bidrag frén de tva genereringsmekanismema presenteras. Med hj'ailp av multipel-regressionsanalys 'ar det mojligt att bestamma de 1 modellen
ingaende parametrarna. D'arigenom ar det méjligt att ber'akna bidraget
fran respektive mekanism till den totala A-viktade ljudnivan.
II
Description of methodology concerning the identification of two
genera-tion mechanisms for tire/road noise and the differentiagenera-tion of the noise into the two mechanisms
by Ulf Sandberg
National Swedish Road and Traffic Research Institute
5 581 01 LINKOPING Sweden and Guy Descornet
Belgian Road Research Center
42, Bd de la Woluwe
B-lZOO BRUSSELS Belgium
ABSTRACT
This report is a description of the calculation methods used in an earlier conference paper, "Road surface Influence on Tire/Road Noise". The conference paper is included as an appendix.
Methods used to correlate spectral characteristics of external tire/road noise and road macrotexture are described. The final result is the correlation coefficient between noise and texture as a function of both acoustic frequency and road texture wavelength. From closer investiga-tions on this correlation, conclusions are drawn that noise is generated by two independent mechanisms active in separate frequency ranges. A model describing the buildup of total tire/road noise from these two mechanisms is presented. By a multiple regression technique it is possible to determine the parameters of this model. Then, it is possible also to calculate the contribution of each mechanism to the total A-weighted sound level.
INTRODUCTION
It was concluded in ref 1* that tire/road noise is generated by two separate mechanisms, one active in the low-frequency range and the other active in the high-frequency range. Furthermore, it was possible to estimate the contribution of each mechanism to the total tire/road noise level on different pavements and for different tires and speeds. Due to space limitations in the conference paper of ref 1, it was not possible to include a description of the methodology used in those calculations. This paper presents such a description and gives some comments on and
extensions to the results. However, the final result as a whole is not
given here; the reader is requested to refer to ref 1 in this respect. For the reader's convenience it is included as an appendix to this report.
* Please see the reference list. Ref 1 is included as an appendix of this report.
DATA COLLECTION
The measurements were made partly in Belgium at the Centre de Recherches Routieres (CRR), partly in Sweden at the National Swedish Road and Traffic Research Institute (VTI). Measurements were made both to obtain external noise spectra and to obtain road texture spectra, i e the amplitude spectra of the road surface longitudinal profile curve. Also other measurements were made which are not relevant for this discussion and consequently not commented here. Most of the calcula-tions were made at the computer facilities of the CRR.
The different variables in the data relevant here were:
0 Sound pressure level (SPL)
0 Acoustic frequency (f)
0 Tire type (T)
0 Tire rolling speed (V)
0 Road surface type (RS)
0 Road texture level (TL)
0 Texture wavelength (M
SPL data are a function of several variables:
SPL = 7(1 (f, T, v, RS)
Texture data are a function of: TL = { 20, RS)
By comparing SPL and TL data it was thought that a lot could be said
about the underlying generating mechanisms.
If We consider only one speed and one tire at a time we have
SPL = ii (i, RS)
TL = fin, RS)
CORRELATION BETWEEN NOISE AND ROAD TEXTURE AS A FUNC-TION OF ACOUSTIC FREQUENCY AND TEXTURE WAVELENGTH Acoustic frequency data are given in 25 third-octave bands with center frequency f. Texture wavelength data are also given in 25 third-octave
bands, with center wavelength A.
For a certain f and a certain X we have n pairs of SPL and TL data, where
n = number of road surfaces.
A linear regression analysis is made on these data pairs (SPL, TL). The correlation coefficient (R) between SPL and TL values is calculated. This calculation is repeated for different (SPL, TL) data sets, each set corresponding to a certain f and K combination. We are then able to list
the two-variable correlation coefficient
R =,1 (m)
As we have 25 third-octave bands of acoustic frequency and texture wavelength, respectively, the final result will be a 25 x 25 matrix (625 values) for each speed and each tire. Fig 2-5 in ref 1 show a plot of this relation for four tires and one speed (80 km/h) in the form of f versus X for some values of R. Interpolation has been used where data have too poor resolution.
The results are important for the comingdiscussion and can be summar-ized as:
l. The general pattern is quite similar for all the four tires.
2. Correlation can be both positive (noise increases with texture) and negative (noise decreases with texture).
3. The frequency where correlation changes sign is here called the cross-over frequency and is approximately 1000 Hz.
4. The correlation is maximum Eositive between noise and texture at
400-500 Hz re5p 63-80 mm (texture wavelength).
5. The correlation is maximum negative between noise and texture at
2500-8000 Hz resp 2-3.2 mm.
THE CRITICAL FREQUENCIES AND WAVELENGTHS
The acoustic frequencies and texture wavelengths at which the correla-tion has extreme values are called critical frequencies (f*) respectively critical wavelengths 0*). As there are extreme values both in the low
(LF) and high (HF) frequency ranges, the corresponding critical frequen-cies and wavelengths have been indexed L resp. H. See table 2 in ref. 1,
where they are listed.
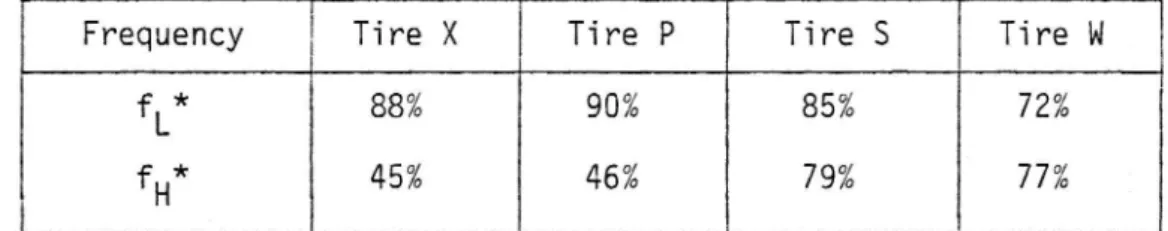
Fig. 6-13 in ref. 1 show the data points and the regression lines for the SPL versus TL at the critical frequencies and wavelengths. At the critical frequencies the correlation coefficients are quite high. The table below shows the portion of the total noise variance explained by the,
regression (= R2):
Table l. The portion (R2) of the total noise variance at f* explained by the regression between SPL and TL.
Frequency Tire X Tire P Tire S Tire w
fL* 88% 90% 85% 72%
fH* 45% 46% 79% g 77%
In ref. 2 it is predicted that road texture with a wavelength x should generate a noise with a frequency f if the tire is rolling with a speed v according to the relation
>
4
<
if f has the unit Hz, v the unit m/s and X the unit m.
Although the critical values do not seem to be related to each other following f : v/X as could have been expected, it must, however, be
noted that the correlation maximum could be affected to some degree by lack of precision in the measurement of noise and texture, due to microphone wind noise and the B-T product of profile spectra. Another
thing that makes it difficult to see the exact f/A relation is that there is
a correlation between different wavelength bands within the texture as well as between frequency bands within the acoustic signal. It is therefore still possible that the frequency content of the LF noise and
the wavelength content of texture are related according to the above,
but that detection of this requires a more careful study.
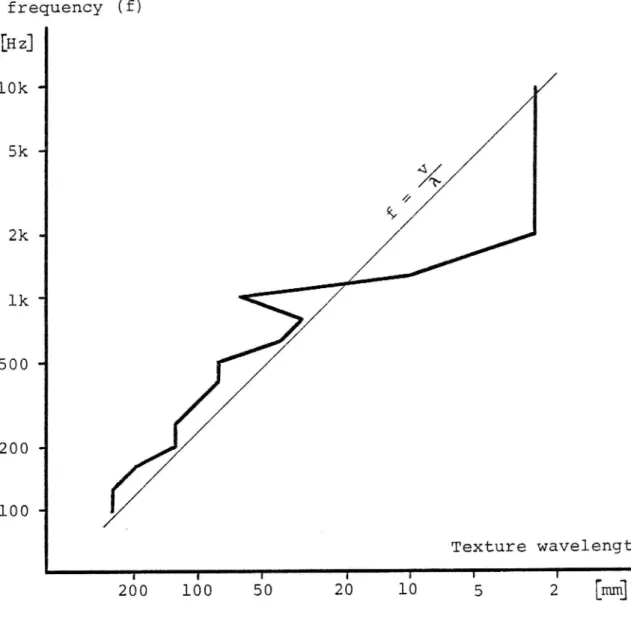
There is a tendency in fig. 2-5 in ref. 1 that correlation is very high along lines describing the above relation between f and A . For example, for tire S, the correlation coefficient along the line f : v/A is within 10% of the maximum obtained from at least 100 Hz to 800 Hz. For all four tires, the maximum always lies within one octave from that line for all frequencies up to and including 800 Hz. However, for all tires, and for frequencies above 1250 2000 Hz, the maximum does not follow the line f = v/A but is constant at a wavelength 2 3.2 mm. In fact, the true maximum might lie at still shorter wavelengths which were not possible to measure accurately by our instruments. Figure l, which shows the frequency versus wavelength where correlation is maximum - for all four
tires averaged - illustrates this.
Acoustic frequency (f)
[H z]
10k -
//
5k-X
// 2k-lk" 500 " 200 ~ 100-Texture wavelength (A)
T I T
I I I ' 1
200
100
50
20
10
5
2
m
Figure l. The relation between acoustic frequency and texture wave-length for which there is maximum correlation between noise and texture. Frequencies and wavelengths are in third-octave bands.'The curve represents the average for the four tested tires.
By studying the maximum correlation as a function of Speed, it seems like the maximum is shifted approximately proportional to speed in the LF range.
For one pavement, which had a narrow peak in the texture spectrum, it can be seen that acoustic frequency is proportional to speed (not illustrated here).
All this supports the hypothesis that in the LF range (only) there is a
relation f : v/A, i e the acoustic frequency equals the frequency of texture impact on a rolling tire.
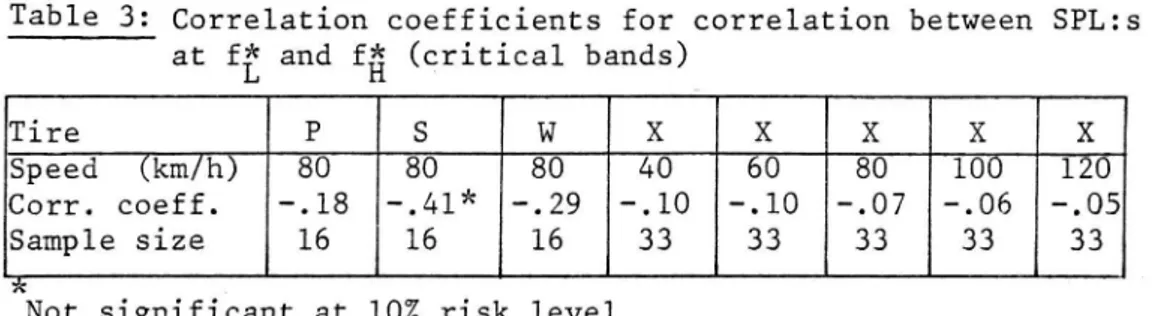
Are the SPL:s at the critical frequencies in the HF range correlated with those in the LF range? Table 3 in ref. 1 shows that they are 29;
correlated at all; i e LF noise is not correlated with HF noise.
MAIN CONCLUSIONS FROM THE CORRELATION STUDY The very important conclusion from the previous section is that
0 LF and HF noise are generated independently, by two separate
mechanisms
Other conclusions are:
0 The two mechanisms are very differently related to texture; the LF mechanism is proportional to texture while the HF is inversely proportional to texture.
o The cross over frequency is approximately 1000 Hz.
0 It is possible to identify a certain acoustic frequency and texture wavelength where there is maximum correlation between noise and
texture.
0 Correlation as a function of frequency is maximum close to a line
f = v/A for the LF mechanism, and for 2-3.2 mm texture wavelength
(independent of speed) for the HF mechanism.
0 The regression between noise and texture is responsible for at least 70-90% of the variation of noise with road surface at the LF critical frequency. At the HF critical frequency the regression explains at least 45-80% of the variation of noise. The rest may be due to errors
in the measurement or in the model (due to the measurement errors,
it is not realistic to get higher values than about 70-90%).
The interpretation will be that:
o The LF mechanism is the impact of texture on the rolling tire and the deformation it brings to the tire. This generates noise with an acoustic frequency proportional to speed times the spatial texture frequency (equiv. to the inverse of wavelength). It is the mechanism called "Road texture induced vertical vibrations" in ref. 2. For all the tested tires, this mechanism explains almost all of the LF noise generation, at least at the critical frequency.
10
o The HF mechanism gives no distinct relation between f and X that is
traceable to speed. HF noise decreases with increasing texture in
contrast to LP noise. The only reasonable explanation for this is that the HF mechanism involves an air-pumping or air-resonant process, as increasing texture at low wavelengths means increasing drainage.
II
A MODEL BASED ON DIFFERENTIATION OF THE NOISE INTO PAR-TIAL SPECTRA
As a consequence of the foregoing, a model can be established:
.. . + .
P(f) aL(f) P(fL*) aH(f) P(fH*) (l)
where
P(f) 2 Noise power as a function of frequency
(in third-octave bands)
P(fL*) 2 Noise power due to the LF mechanism,
which is most accurately represented by the noise power at the critical frequency fL*
P(fH*) = D:o for the HF mechanism
aL(f) :The LF mechanism " weighting curve".
A constant in terms of road, but a function of frequency.
aH(f) = D:o for the HF mechanism
For a fixed frequency we can write:
P : aL'P(fL*)+aH'P(fH*) (2)
For _ea_c__h road surface there is a certain triple of data: P, P(fL*) and P(fH*). We have in our case either 16 or 33 roads. By calculating the multiple regression for those roads using the model above (2), we can get
estimations of the aL and a . This can be done for each frequency,H
whereby we obtain aL and aH as a function of frequency.
The weighting curves for the LF, aL(f), and for the HF, aH(f),
mecha-nisms can be seen in. fig. 141 and 15 in ref. 1, although there they are also
shifted in level according to the following.
We can differentiate the total noise into two partial spectra:
PL ) = aL(f)'P(fL*) LF noise mechanism PH(f) : aH(f)'P(fH*) HF noise mechanism
12
In this model it can be seen that a or a are not dependent on road. On
the contrary, P(fL*) or P(fH*) :re cilpendent on road but not on
frequency (only on critical frequency which is Egg dependent on road).
Thus, for every road, we will have the same a(f) but different P(f*). The
pavement does not influence the shape a(f) , but only the overall level
P(f*) , of each partial spectrum. The total spectrum will, however, be
influenced by the pavement due to the different mixing of the two
mechanisms.
A simplification was made in the calculation: It was assumed that there is no significant overlapping of the partial spectra at or beyond the critical frequencies. This is justified by the result of table 3 in ref. 1, where it is shown that the two mechanisms are not related at those frequencies, and by the fact that at the respective critical frequency -one of them is enough to explain the main part of the variation.
The resulting partial spectra, averaged on all pavements, can be seen in fig. 14-15 in ref. 1. The linear PL and PH values have been recalculated to logarithms.
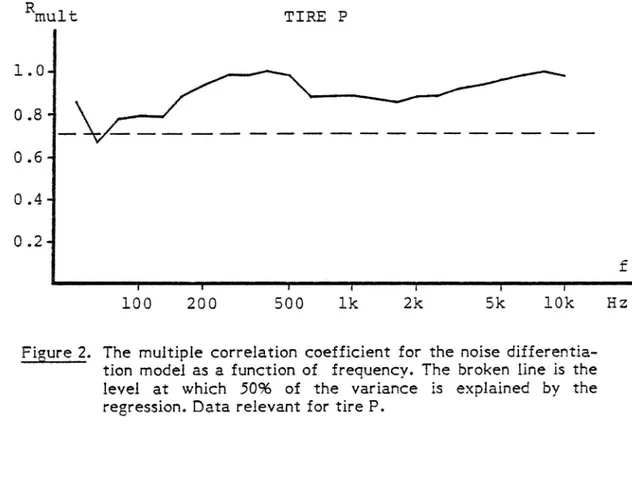
A factor describing the accuracy of the model is the multiple correlation
coefficient (Rmult) obtained in the multiple regression analysis. It is a
function of frequency and is shown for 80 km/h in figures 2-5.
13
Rmult
TIRE P
O .4 O .2 -f f I I F T l I 100 200 500 lk 2k 5k 10k HzFigure 2. The multiple correlation coefficient for the noise differentia-tion model as a funcdifferentia-tion of frequency. The broken line is the level at which 50% of the variance is explained by the regression. Data relevant for tire P.
R _ mult TIRE X 0 . 4. O . 2" f t I f I i I I 100 200 500 1k 2k 5k 10].; Hz
Figure 3. The multiple correlation coefficient for the noise differentia-tion model as a funcdifferentia-tion of frequency. The broken line is the level at which 50% of the variance is explained by the
regression. Data relevant for tire X.
14
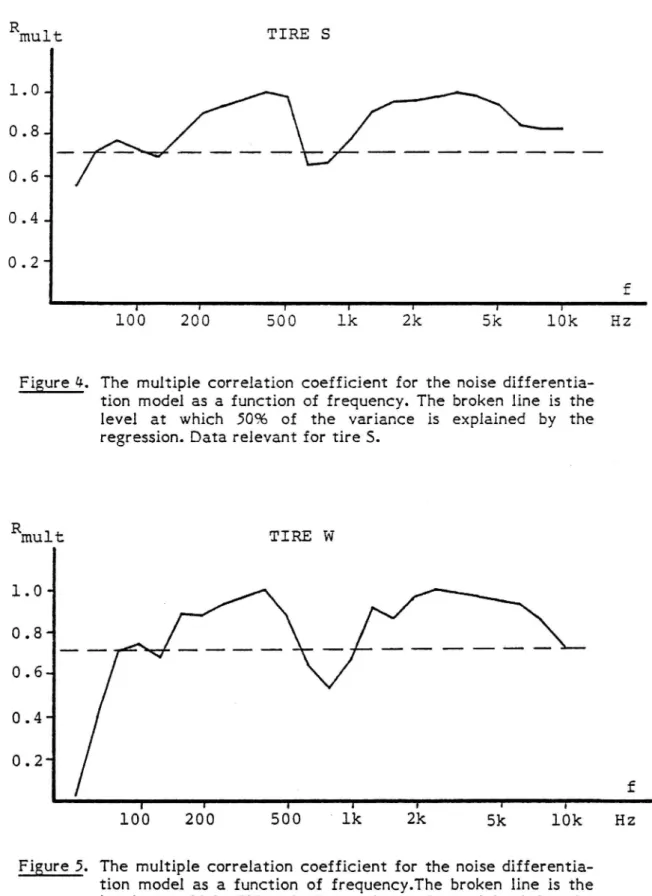
Rmult TIRE S O . 4 O . 2 -f I i I I I I T 100 200 500 lk 2k 5k 10k HzFigure At. The multiple correlation coefficient for the noise differentia-tion model as a funcdifferentia-tion of frequency. The broken line is the level at which 50% of the variance is explained by the
regression. Data relevant for tire S.
Rmult TIRE W
f
f r I I F r i
100 200 500 ' 1k 2k 5k 10k Hz
Figure 5. The multiple correlation coefficient for the noise differentia-tion model as a funcdifferentia-tion of frequency.The broken line is the level at which 50% of the variance is explained by the regression. Data relevant for tire W.
15
It is seen that the model explains at least 50% of the variance (means that "no other noise variation is bigger") for tire S in the range 160-10000 Hz, except at 630 and 800 Hz. For tires P and X the model is adequate all over the important range. For tire W the "poor" range is 630-1000 Hz.
It is then concluded that the model is very good for all frequencies 160-10000 Hz except for a few medium frequencies for two of the patterned tires, where about 50% of the noise variation is unexplained.
16
THE INFLUENCE OF TIRE TEXTURE
Tire deformation is caused not only by road texture, but also by tire texture, i e the tread pattern of the tire. This can probably be handled in the same way as road texture, although it is difficult to know what the texture amplitude is because only a small part of the tread depth is causing deformation. It is typical from the above, that for tire P with no tread pattern the model is accurate also in the cross-over zone,but the "worse" the tread, the more of the noise at the tread impact frequen-cies* is unexplained.
Thus, the model should be supplemented by a third term:
pMm = aM(f)'P(fM*)
with notation as before, but M meaning Medium frequency mechanism.
The MP mechanism is due to tire texture (tread) impact on road and the
consequent tire deformation. It is, basically, the same mechanism as the LF mechanism although excited by a different kind of texture which must be separately described.
By detailed study of the partial spectra it has been noticed that the calculated LF mechanism gives the main contribution to overall noise in
the "MF" range. Exceptions include the "worst" patterned tire (W) on a
few very stiff and old pavements. So, in the majority of the cases, the MF mechanism seems to be included in the LF mechanism, which is reasonable as they are so closely related. Therefore, no serious effort to modify the model has been made so far.
* Fundamental frequency around 600 Hz at 80 km/h
l7
CALCULATION OF THE CONTRIBUTION TO A-WEIGHTED SPL OF EACH MECHANISM
From section 6 we have obtained P(f) which is the predicted noise power versus frequency. It is obtained separately for each road pavement, for each speed and each tire. The overall level of each partial spectra - _f_o_r
one particular pavement - is entirely dependent on P(fL*) or P(fH*), i e
the power at the cricital frequency in question for that particular pavement. This value is the average of 3-5 different noise measurements and as such has a poorer accuracy than when calculating data based on several pavements, such as when calculating aL and aH. The standard deviation of this average due to random errors is, at fL*, in the order of
0.7 dB.
Therefore, each separate partial spectrum for a single pavement will have an overall level error in the order of 1 dB in addition to model errors. As it here is intended to compare HF and LF partial spectra, and
these errors are not co-varying, it is desirable to reduce them. This can be done by the following procedure:
For each pavement separately:
o The noise predicted by the model is compared to the measured noise
for each frequency.
0 A correction by a certain constant factor is applied to each of the
two partial spectra (same factor for all frequencies).
0 The correction is based on the assumption that the SPL at the other frequencies can be used to "smooth out" the random error at that particular critical frequency.
0 For each frequency, a difference between measured and predicted noise is obtained. By an optimization procedure, two correction factors (bL and bH) are calculated such that the standard difference
is minimized:
18
- . . + . o
P(f)pred. aL(f) bL P(fL*) aH(f) bH P(fH*)
a(f) and P(f*) are exactly as calculated before (see 6)
and P(f)m
method.
- P(f) is minimized based on the least squares
eas. pred.
In this way, the level of the partial spectra, but not their shape, is adjusted so that the combination of them into a total noise spectrum equals the measured spectrum as much as possible. The objective is to differentiate the initially measured spectrum in the most accurate way.
The final difference between the predicted total spectrum and the
measured spectrum is typically 1.2 dB (RMS error over all third-octave bands). Thus, the differentiation has been made without causing signifi-cant distortion in the overall noise spectrum. An exception is the noise measured on a drainage pavement where great errors arise in the range 630-1000 Hz where this pavement has a considerable sound absorption (ref. l, fig. 19). This can, of course, not be predicted by this model.
Each partial spectrum can be A-weighted and the overall A-weighted sound level calculated instead of the linearily weighted values discussed so far. Their individual contributions to the sound level can then be determined. This has been done, and the results are summarized in table 4 in ref. 1. From this it is possible to see which of the two mechanisms is important in different speed/tire/road combinations. It turns out that they are equally important.
l9
CONCLUDING REMARKS
The methodology behind the investigation on tire/road noise generating mechanisms presented in ref. 1 has been described. Raw data used in ref. 1, part 1, consisted of some #0000 values. Such an amount of data, obtained and used in a proper way, can reveal a lot of interesting things; but at the same time it requires careful considerations on the validity of different methods. With this description of the methodology, the reader will, hopefully, be able to judge this by himself.
The work reported in ref. 1 was the result of a cooperation, incl. pooling of mutual data, between Guy Descornet and the author of this report. This cooperation was most stimulating.
20
REFERENCES
l. SANDBERG, U; DESCORNET, 6.: Road Surface Influence on Tire/Road Noise - Part I
DESCORNET, G; SANDBERG, U.: Road Surface Influence on
Tire/Road Noise - Part II
VTI Preprint No. 56, National Swedish Road and Traffic Research Institute, Linkoping (also proceedings of INTER-NOISE 80, Miami, USA 1980).
Included as appendix in this report.
2. SANDBERG, U.: Road Texture Induced External Tire Noise. VTI Report 174A, National Swedish Road and Traffic Research Institute,
Linkoping, (1979).
21
APPENDIX
Road Surface Influence on Tire/Road Noise
Part i
by U. Sandberg and G. Descornet
and
Part II
by G. Descornet*) and U. Sandberg**)
Reprint from the 1980 international Conference on Noise Controi
Engineering (INTER-NOISE 80) Proceedings
Miami, USA, 8-10 December 1980
') Belgian Road Research Centre
) National Swedish Road and Traf c Research institute
Preprint No. 56. National Swedish Road and Traffic Research Institute,
Linképing (1980).
22
THE 1980 INTERNATIONAL CONFERENCE ON NOISE CONTROL ENGINEERING Hotel Inter-Continental Miami, Florida, USA
8-10 December 1980
ROAD SURFACE INFLUENCE ON TIRE/ROAD NOISE - PART I
U. Sandberg and G. Descornet
National Swedish Road and Traffic Research Institute
8-581 01 Linkoping, Sweden
resp. Belgian Road Research Center, 42 boulevard
de la Woluwe, B-lZOO Bruxelles, Belgium
INTRODUCTION
The importance of tire/road noise as part of total vehicle noise has recently received growing attention. It has been recognized as a major component of passenger car noise, even at moderate speeds, and as a significant component of truck noise at high speeds
/8/*. The continuing development of more silent vehicle power units will even more emphasize tire/road noise.
During the last decade, in many countries, more deeply textured anti-skid road surfacings were implemented which appeared to be noisier and drew public awareness on what could be called "pave-ment noise". As a matter of fact, the surface characteristics of roads are now known as the main factors influencing car tire/road
noise /2, 5, 10/.
Then, in order to harmonize safety and environmental require ments and also to define a reference surface for measurement and regulation purposes, a better knowledge of the noise-relevant surface characteristics is required.
This was the common aim of two initially independent research works conducted at National Road and Traffic Research Institute
in Sweden (VTI)** and Road Research Centre in Belgium (CRR); they happened to yield complementary results and conclusions which are synthesized in this two-parts paper.
MEASUREMENT INFORMATION
External tire/road noise was measured using a fixed microphone
1.2 m above road level at 7.5 m from centre line of vehicle path,
and a test car coasting through the test section with the engine switched off. The measurement sites were chosen to eliminate
serious deviations from freefield conditions. During a coast-by
the noise was recorded for later frequency analysis. In every
case the maximum A-weighted level was measured (O.2-O.25 s time
constant). In the Swedish measurements, the vehicle speed
* ea
Ref. are listed at end of part II With participation of
23
was measured and corrections were made for deviations from nominal
speeds, which were 70 and 90 km/h. In the CRR measurements the vehicle speed indicator was calibrated and the speed was kept as close to the nominal as possible. The nominal speeds were 40, 60, 80, 100 and 120 km/h. Several runs were always made and averaged to increase the accuracy. Where Swedish and Belgian data are
compared, the reference speed of 80 km/h is used. The Swedish data
for 70 and 90 km/h have then been interpolated to correspond to
80 km/h.
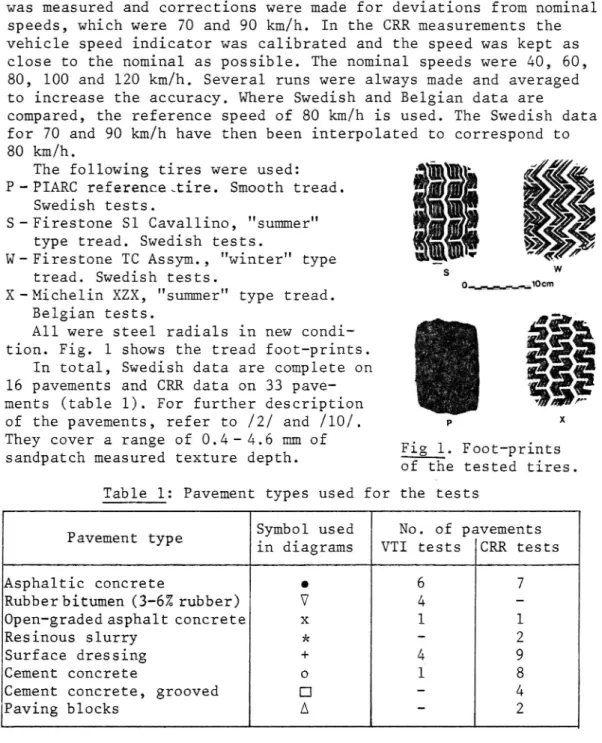
The following tires were used: P-PIARC reference-tire. Smooth tread.
Swedish tests.
S-Firestone Sl Cavallino, "summer" type tread. Swedish tests.
W-Firestone TC Assym., "winter" type tread. Swedish tests.
X-Michelin XZX, "summer" type tread. Belgian tests.
All were steel radials in new condi-tion. Fig. 1 shows the tread foot-prints.
In total, Swedish data are complete on
16 pavements and CRR data on 33
pave-ments (table 1). For further description
of the pavements, refer to /2/ and /lO/. They cover a range of O.4- 4.6 mm of
sandpatch measured texture depth. Fig l. Foot-printsof the tested tires. Table l: Pavement types used for the tests
Symbol used No. of pavements
p
avement type in diagrams.
.
VTI tests CRR tests
Asphaltic concrete
Rubber bitumen (3-67. rubber) Open-gradedasphaltconcrete
Resinous slurry Surface dressing
Cement concrete
Cement concrete, grooved
Paving blocks l> D O + > e > < < l o II |- l-\ I 94 45 0 N D O O K O N I J I V
To characterize each pavement, data were collected according to the following:
- Macrotexture profile curve was measured by profilometers. CRR data were collected using 500x200 mm2 mouldings on which a
computer-controlled mechanical needle-profilometer measured the profile /2/. Samples were taken by steps of 1 mm in longitudinal direction and 2 mm in transverse direction. VTI data were collected using a similar device but directly on the road surface. Here sampling was at 0.4 mm steps in longitudinal direction. Five statistically
independent tracks, each 0.5 m long, were measured in this way
(The present VTI profilometer, however, uses a laser technique to make it non-contact and fast).
- CRR also measured texture height by the sand-patch method.
1000 315. 100
24
VTI made in-situ measurements, but on CRR pavements these measure-ments were made afterwards on the mouldings.
- Skid resistance measurements were made. Either SFC at 20, 50
and 80 km/h by means of the odoliograph (CRR) or friction coef-ficient at 15% slip at 50 and 70 km/h (VTI).
- On at least the pavements where it could be eXpected significant,
sound absorption or acoustical impedance has been measured /l/.
- On the Swedish pavements, measurements were made of mechanical
impedance. See procedure and results in /l/.
The macrotexture profile was signal processed in order to get
the power spectral density. The bandwidth used for the final pre-sentation is 3rd octave bands, numerically following the recom-mended bands for acoustic measurements. The amplitude scale is
3rd oct.band power in dB re. 10 12 m2. The texture frequency
scale uses "spatial frequency" with the unit (cycles/m), and its inverse: wavelength (m).
NOISE/TEXTURE CORRELATIONS
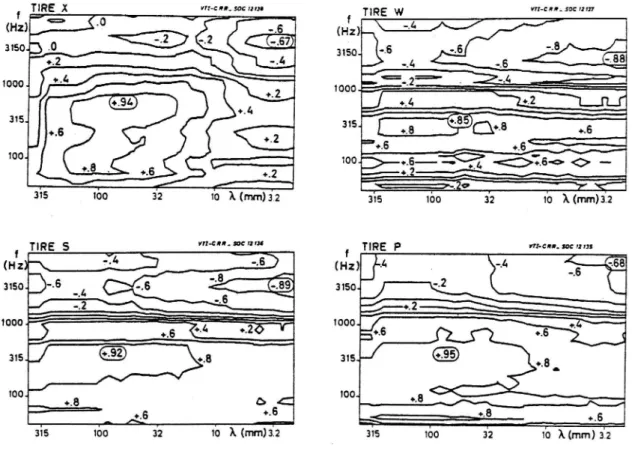
We have systematically computed the correlation coefficient
(p) between every couple of noise and texture 3rd oct.band levels;
then, D is a function of two variables, namely: sound frequency (f) and profile wavelength (X). It is represented by contour lines in fig. 2-5, for 4 tires, at a reference speed of 80 km/h.
VfI-CRD- 50612117 VII-C 0'. 50¢ 12 U. -.8 0.8 +.6 }<>.c>-+.6 +2 +2 315 100 1o A (m) 3.2 315 100 32 1o 1 (mm)3.2
VII-CHI. SOC 71 '3 VII-CID. 306 r: I)!
(Hz) 3150. 1000. 4 +.6 16 A(nmvi2 «6 16 7k (mm) 3T2 be is
Fig 2-5: Contour lines of the correlation coefficient between noise level (80 km/h) and texture level. Circles denote extreme values at "critical" frequencies and wavelengths
25
Whichever tire being considered, highly significant correla-tions appear in two separated frequency and wavelength domains: low frequency noise (f§;lSOO Hz) is positively correlated with large wavelength profile components (A;le mm), while higher
frequencies are negatively' correlated with shorter wavelengths. Let us call (ft, Xi) and (f3, RE) the critical frequencies and
wavelengths where Q has been found respectively maximum and
minimum; these values are listed in table 2 for various
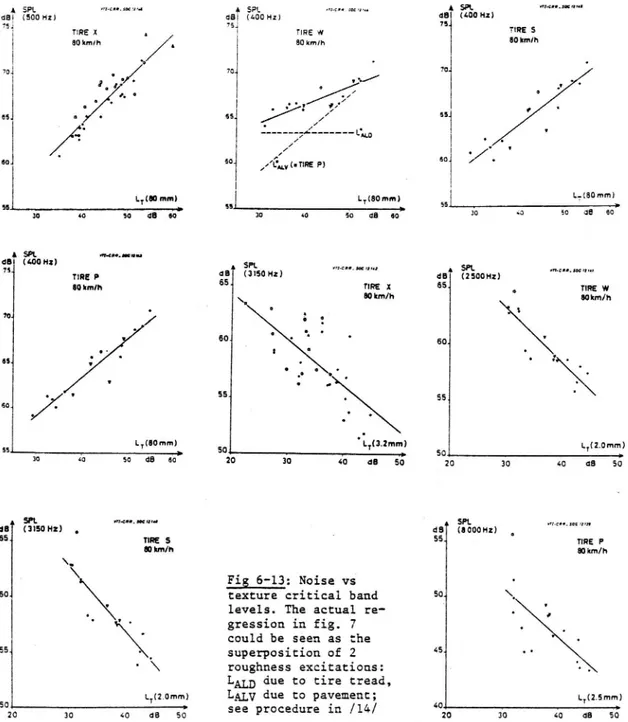
combina-tions of tires and speeds and some of the corresponding relation-ships are illustrated in fig. 6-13.
Although these critical values don't seem to be related to each other following f==speed/k as could have been expected, it must
however be noted that the correlation maximum could be affected
1| SPL V l-Cnl.sa¢rua dB (500 Hz) 75. was x 80km/h / 0 70 o / O 3. 4» a. 0 ° o G GSJ a 0 /'O 604 L,( mm) 55 I r : 3° 0 so dB to A SH. urn-enact».-do (600 Hz) 75. TIRE P UOkm/h 704 65. 60. o LT(80mm) 55 T V : so 40 so as so 1| 9L m-CDD.SICIJMI GB (3150 H2) . 55. TIRE 5 aim/h \. 50. ' o. ' . 55. . LT(2.0mm) SO ; 2O 30 0 dB 50 d8 75. 70. A SPL (400 Hz) t l-Cll. 50'1! TIRE W 80 km/h II as 55. v / O I 0// a '. . a, '1. as / I/ . / II o / LALD // / 1 5° l/L'm (mm: P) LT(80 mm) S! x 30 w 50 dB 60-7 SPL VYI-CD'- 3III (3350 Hz) TIRE X OOkm/h
So 20 . LT(3.2mm) 3b 40 as so Fig 6-13: Noise vs texture critical band levels. The actual re-gression in fig. 7 could be seen as the superposition of 2 roughness excitations: LALD due to tire tread, LALV due to pavement;
see procedure in /l4/
Fig 6-13 are reproduced in enlarged size at paper (part II, pp 7-8).
A 63 75.4 604 59!. (400 Hz) "I DI. 1 11 1 TIRE S 80 kmlh L, (80 mm) 55 Y 9.r 30 5.0 50 d8 50 A SPL m-cnmmmu d3 (2 500 HZ) 55 . nmzw 80km ! % 6m ' I . '. 55 . LT( 2.0mm) 50 ; 20 30 40 dB 50 n VN-C'...IOC1' d B (8 000 Hz) 55. 50. 51 m TIRE P 80 km/h L,(2.5mm) 20 3b Jo ca 55
26
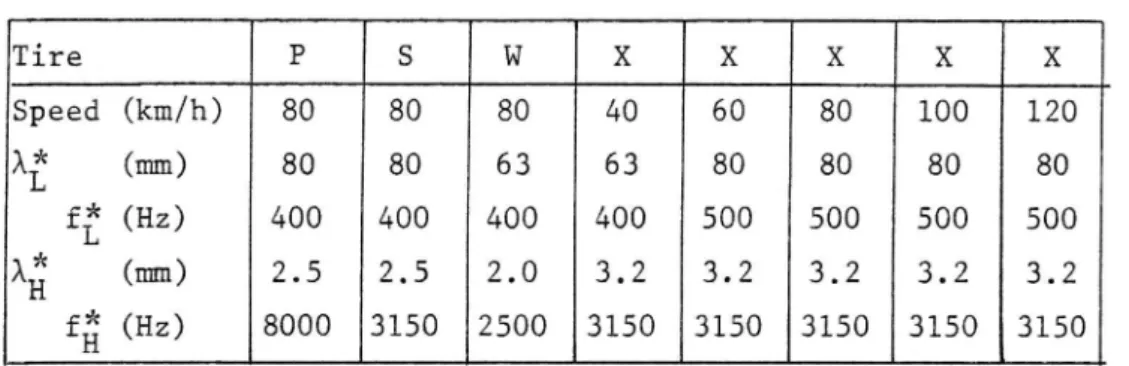
Table 2: Critical frequencies and wavelengths
Tire P S W X X X X X Speed (km/h) 80 80 80 40 60 80 100 120 Ag (mm) 80 80 63 63 80 80 80 80 ff (Hz) 400 400 400 400 500 500 500 500 A" (mm) 2.5 2.5 2.0 3.2 3.2 3.2 3.2 3.2 fg (Hz) 8000 3150 2500 3150 3150 3150 3150 3150
to some degree by some lack of precision in the measurement of
noise and texture, due to microphone wind noise and B- T product of profile spectra. It could (e.g.) still be possible that the
frequency content of the LF noise and the wavelength content of texture are related according to the above.
These results can undoubtedly be interpreted as giving a clear evidence that at least two different noise generating mechanisms are acting. One is such that the noise level increases with
in-creasing texture level; the other, on the contrary, appears to produce less noise on deeper textures.
Owing to the fairly close correlations obtained despite the wide variety of pavement types, it may be concluded that the main
characteristics determining the noisiness of road surfaces are geometrical features, notwithstanding some residual influences
which can be traced as related to acoustical and mechanical
prop-erties of the pavements, as shown in part II.
NOISE PREDICTING PAVEMENT DESCRIPTOR
Quite accurate, but rather empirical, predictors of pavement noisiness have already been proposed by us previously (like "TE",
"LLO" and drainage resistance: "LD" /2, 10/). The present analysis
seems to offer a new basis to tailor such descriptors more ratio-nally. However it has so far not been possible to include the full macrotexture wavelength range into any simple descriptor without a dramatic collapse of accuracy; the reason is thought to lie partly in the non-linearity of the relationships between sound and profile amplitudes as indicated by the slopes of the regressiOn lines on fig. 6'-l3, partly in the presence of two contradictory pavement effects.
Then presently the best predictions can only be made either from the abOve mentioned empirical descriptors or from some limited wavelength bands of the profile spectrum, preferably the critical ones, together with additional corrections for acoustical and mechanical characteristics as discussed in part II.
DIFFERENTIATION OF LF AND HF SPECTRA
For given tire and speed, the SPL's at the critical frequencies
ff and f were found to be quite uncorrelated (table 3); this
con-firms that tire/road noise is the superposition of two
independent-ly generated spectra. 1 LF==1ow frequency
27
Table 3: Correlation coefficients for correlation between SPL:s
at ff and f (critical bands)
Tire P S W X X X X X
Speed (km/h) 80 80 80 40 6O 80 100 120
Corr. coeff. -.l8 -.41* -.29 -.10 -.lO -.O7 -.O6 -.05
Sample size l6 16 16 33 33 33 33 33
I
Not signifiCant at 10% risk level
Let us call them "partial spectra". By means of the following approximations: a) the pavement doesn't much influence the shape but only the overall level of each partial spectrum, b) there is no overlapping at the critical frequencies between the two spectra, and using a regression analysis technique, it has been possible to compute the estimated shapes of the partial spectra shown in fig. l4-15, as well as their relative contributions to the
over-all A-level. \ VTI-CRR-30C 2752 dB 120 km/h \ VII-CRR-SOC 12150 S \
50.
w
p' W
P¢:~:a-x
\\ \ X WW\\\54o
,
,
,
.
r
40
,
,
,
r
P;
100 1N5 1000 3150 Hz 100 315 1000 3150 HzDifferentiation of noise spectra into LF and HF components
Fig 14: Tire X at different Fig 15: All tires at 80 km/h
speeds
When A-weighted, both spectra peak at rather close frequencies
lying in the most A-sensitive range; this helps explaining why previous measurements, performed in conditions which could have
favoured the generation of one or another partial spectrum, have
yielded discrepant results about noise-texture relations (as
reviewed in /8/), since the partial A levels can vary in opposite rways with texture.
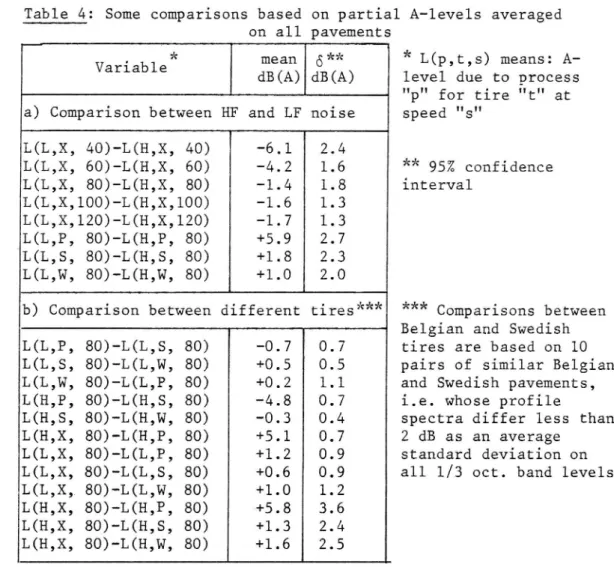
Table 4 illustrates the relative importance of HF and LF noise
contributions to the. overall..level; the differences between
A-weighted partial levels have been averaged on all pavements within a given sample, Belgian or Swedish, depending on where
the results come from; the Belgian (X) and Swedish tires (P, S, W) have also been tentatively compared by choosing the most similar pairs among the respective pavement sets.
For normally patterned tires like X, S and W, and at speeds higher than 60 km/h, HF and LF noise contribute nearly equal
28
amounts to the A-level on the average; at low speeds (40 and 60
km/h), HF noise seems to dominate, at least for tire X. The lower level exhibited by the treadless tire (P) is clearly due to its
smaller HF production, about 5 dB(A) below patterned tires; but
on the other hand, there is no significant difference between the average LF levels of any tire, including tire P.
Table 4: Some comparisons based on partial A-levels averaged
on all pavements
. * mean 5** * L(p,t,s) means:
A-varlable dB(A) dB(A) level due to process
"p" for tire "t" at
a) Comparison between HF and LF noise speed "s"
L(L,X, 40)-L(H,X, 40) ~6.l 2.4 L(L,X, 60)-L(H,X, 60) -4.2 1.6 ** 95% confidence L(L,X, 80)-L(H,X, 80) -l.4 1.8 interval L(L,X,100) L(H,X,100) -1.6 1.3 L(L,X,120) L(H,X,120) -l.7 1.3 L(L,P, 80)-L(H,P, 80) +5.9 2.7 'L(L,S, 80)-L(H,S, 80) +1.8 2.3 L(L,W, 80)-L(H,W, 80) +1.0 2.0 kkk *k*
b) Comparison between different tires Comparisons between
Belgian and Swedish
L(L,P, 80)-L(L,S, 80) -0.7 0.7 tires are based on 10
L(L,S, 80)-L(L,W, 80) +0.5 0.5 pairs of similar Belgian
L(L,W, 80)-L(L,P, 80) +0.2 1.1 and Swedish pavements,
L(H,P, 80)-L(H,S, 80) +4.8 0.7 i.e. whose profile
L(H,S, 80)-L(H,W, 80) -0.3 0.4 spectra differ less than
L(H,X, 80)-L(H,P, 80) +5.1 0.7 2 dB as an average
L(L,X, 80)-L(L,P, 80) +1.2 0.9 standard deviation on
L(L,X, 80)-L(L,S, 80) +0.6 0.9 all 1/3 oct. band levels
L(L,X, 80) L(L,W, 80) +1.0 1.2
L(H,X, 80) L(H,P, 80) -+5.8 3.6
L(H,X, 80) L(H,S, 80) +1.3 2.4
L(H,X, 80)-L(H,W, 80) +1.6 2.5
Thus it can be concluded that if significant tire/road noise
reductions are to be achieved, both underlying noise generating mechanisms should be equally damped, as far as A weighting is concerneda Here the use of weighting curves is critical.
A-weighting is justified to represent outdoor noise, while C-weight-ing might be better to compensate for the window/wall attenuation
when concerning immission into dwellings. This problem should be
observed in the future and it is suggested that C-weighting be introduced as a complement to A+weighting in future work.
INFLUENCE OF VEHICLE SPEED
For convenience and theoretical reasons the sound level change
with speed is best described as being proportional to a given power of speed; then one uses to write:
SPLn/lO log10 Vk
29
VfIvCRR- SOC 72221
1
The speed exponent of each medeummmt
1/3 oct.band level has been calcu- & QQFE
lated; at a cross-over frequency of
about 900 Hz it jumps from a lower 90% 99.9% 95%
to a higher range of values. This b F_ F
is consistent with the existence F
of two distinct noise generating processes having different speed
dependences (fig. 16). It could be
concluded from those data that the ,
HF process has a Speed exponent TireP Tire X Tires Tirew Svfrgggsfor
of c:a 4.5 compared to the LF
process which has 3.5. But if we instead look at the speed ex-ponent for the partial levels we
Fig 16: Average speed exponent. Left bar of each pair repre-sents the range 180-9OO Hz,
ha ? calmlated earlier We 8
right bar 900- 11 200 Hz. Figure
a different result. The mean .
above bars 13 the level of
Speed exponent for the LF process significance for the difference
will be 4.5 compared to 3.5 for
-the HF process. This is for tire between the two bars (F test).
X and levels are then A-weighted.
This contradiction can be eXplained by the shifting of energy towards lower frequencies when speed is decreasing (the so
called frequency-shift). The important A-weighted region for
the HF process is pushed downwards in frequency and so is also, to some degree, the case for the LF process. This can not be
seen directly as a narrowband frequency shift but rather as a shift of the maximum amplitudes. The speed-induced change in spectra for the LF process can be explained by the discussion in /9/, i.e. a gradual mismatch between frequency-changing excita-tion spectra and a fixed "transfer" funcexcita-tion for the tire when speed is decreasing. The frequency shift for the HF process can
be seen as the result of the speed-dependent tread - or pavement
roughness - "triggering" of the air-pumping or air-resonant process.
The outcome is that it seems likely that decreasing speed is "pulling" the LF process spectra more out of the sensitive region 500-2000 Hz, allowing the HF process to play a bigger role in the generation. Thus the HF process is somewhat more important at low speeds provided A-weighting is used (see
table 4).
30
THE 1980 iNTERNATlONAL CONFERENCE ON NOISE CONTROL ENGINEERING Hotel Inter-Continental Miami, Florida, USA 8-10 December 1980
ROAD SURFACE INFLUENCE ON TIRE/ROAD NOISE - PART II
G. Descornet and U. Sandberg
Belgian Road Research Centre, 42 boulevard de la Woluwe, B-lZOO Bruxelles, Belgium
resp. National Swedish Road and Traffic Research
Institute, 8-581 Ol Linkoping, Sweden
(Continued from Part I)
TIRE/ROAD NOISE GENERATING MECHANISMS
Among up to now hypothesized tire/road noise generating me-chanisms, radially excited tire vibrations and pumping of the air
entrapped between tire and surface are generally preferred; these
can also best explain our findings (cfr. part I).
Let us consider how a tire deforms when rolling on a wavy
surface (fig. 17). In addition to the steady deformation it had undergone on a flat surface (broken line in the fig.) a supple mentary alternate deformation component (d) appears which is
susceptible to excite noise emitting vibrations. Given a constant
texture depth (h), when the wavelength (A) of the profile is
larger than the foot-print length (a) the alternate deformation (d) is small and approaches zero with increasing A. When A is much shorter than a, the tire can no longer follow the profile shape.
Then, when A decreases to zero, so does d again. Between these two
extreme cases there exists a critical range of wavelengths, close to the length of the tire foot-print, which maximizes d. This is illustrated in fig. 18 obtained from static measurements of the deformation of tire X on a wavy surface (with inflation and load similar to in-service conditions).
Referring to fig. 2 (part I), there is a rather good agreement between the critical wavelength range around If which has been found responsible for the LF noise, on one hand, and the wave-length range (fig. 18) Where the alternate deformation of the
tire is maximum, onthe other hand. This is thought to be a strong
argument for identifying the LF noise generating mechanism with radially excited vibrations. It is also consistent with other recent work which indicated a frequency limit of 800-l600 Hz
below which noise proved to be related to such vibrations /3, 5,9/.
Of course, part of the radial excitation is likely to originate from the tire pattern itself; this is particularly noticeable when the latter contains periodicities which, at a given speed,
correspond to a frequency close to the critical one. Keeping that
in mind and referring to the hypothetical method sketched in
31 VTI-CRR- SOC 1213 K<<a h _..-.. '.
d<<h
_
JAL -
a
Reva
dash
K>>Gd<<h
Fig 17: Sketch showing how a tire deforms when rolling on a wavy surface. (a) foot-print length, (d) alternate deformation, (h) profile amplitude, (A) profile wavelength.
v n-cn- soc 12 Is: l
8 dh'rm
,
I I II 7 I II6, partial contactd- l p full contact. /
S« / I I l
&
/
I m a2
21 a I 491' x
x"
a0
.O
n
IL
L
.Xsz
2
é
1'0
2'0
5b
160
260
560
Fig 18: Amplitude (d) of the alternate deformation on tire X on a sinusoidal profile. Critical wavelengths related to HF and LF
32
relating to tire W can be explained.
At a given profile wavelength, when h increases, d increases but not higher than the broken line in fig. 18; above that
thres-hold, the tire separates from the troughs of the surface. On
actual pavements, with texture depths generally smaller than 5 mm,
this is more likely to happen when very short wavelength profile components are present; then it gives a hint to the identification of the HF noise generating mechanism. Remembering that the HF
noise level decreases with increasing short-scale surface roughness
(cfr. part I), this could be explained as air-pumping being short-circuited through the gaps between tire and surface. Outflow
tests performed on the pavements support that interpretation: highly significant positive correlations were found between HF noise level and water drainage reSistance which may be viewed as an indirect estimation of the closeness of contact between tire and surface /lO/.
Now, the original air-pumping theory of Hayden /4/, having not proved quite satisfactory, has subsequently received some modified interpretations according to which friction and tangen-tially excited vibrations could play a role in exciting air-pumping or "air resonant radiation" /6/. Some data suggesting an influence of friction (microtexture or adhesion) have been reported by Liedl and Denker /5/ and Nilsson et al /7/. Their laboratory tests revealed an increase of HF noise on a higher friction
sur-face having the same macrotexture. Accordingto Liedl and Denker
this means that tangential slip-stick motions in the tire tread are responsible for at least the HF noise.
Our wet friction tests (SFC at 20 km/h) don't exhibit a clearly
significant correlation with noise in any frequency range, but if a low probability level (p==lOZ) is accepted, the correlation is in favour of a friction influence on HF noise which is in fact
the opposite to the mentioned laboratory tests. Therefore we
cannot find any support for the mechanism suggested by Liedl and Denker. On the other hand it might be too early to definitely reject it; indeed the possibility could also be considered that
the correlation between HF noise and short wavelength texture
would be merely a part of an underlying more extended relationship which would include wavelengths shorter than the present limit of
our measurements (i.e. microtexture). Now one can argue that even for the smooth tire there appears to be a certain contribution to the HF process. This can probably be explained by air-pumping in the road surface, if there are fairly deep pockets in it. And indeed, for the smooth tire running on one smooth pavement which clearly exhibited closed pockets, HF noise was excessive (the circle in fig. ll-13). So, at present, we prefer to explain the
HF process as air pumping or a closely relatedprocess. DISCUSSION ON RESIDUAL DEVIATIONS
Highly significant noise/texture correlations have
beende-monstrated. There are however some deviations from the regres-sion lines that are not likely to be pure random errors.
Sound absorption. By measurement of the sound absorption coef-ficient and sound propagation over the actual road surfaces in relation to a perfectly reflecting surface, it has been found
33
that both opengraded pavements
we used exhibited a sound
absorp-tion big enough to influence the da
tire noise radiation. This can be demonstrated best (fig. 19)
by comparing two surfaces with :m
similar* texture spectra: one &
"ordinary" and one with
in-terconnected vertical chanels
in the wearing course (i.e. an opengraded pavement). The
difference in macrotexture, except the channels, can be
predicted to make a difference in noise of cza 1 dB.
From the figure it can be seen that differences in noise are bigger than in sound propa~ gation, although the frequency characteristics are similar. This might indicate that it is not only the sound propagation
that plays a role but also the acoustical impedance or additional vertical drainage influencing the generation process.
Other possible relevant pavement characteristics. Once the texture influence has been eliminated, it appears from the obser-vation of the residuals that: a) Rigid pavements (paving stones and cement concrete) are significantly noisier than flexible pave-ments (bitumen); this is valid throughout the whole frequency
spectrum; b) Old pavements are noisier than new ones, mainly in the HF range; this "age influence" is biggest for smooth and
compact pavements (some Swedish pavements were tested at different
periods of their lifetime).
The former obserVation (a) is partly explained as follows: when considering longitudinal profiles no distinction is made between isotroPic and oriented textures; this possibly makes a difference as to the tire excitation; indeed, the transversely
grooved pavements depart systematically from the general trend
as shown in fig. 6 (part I) for instance. But the fact is that the tendency is the same for non grooved cement concrete pave-ments; so, some further explanation is required.
Since a statistically weak difference (p==lOZ) of friction (SFC at 20 km/h) exists between cement concrete and bituminous pavements, it could be suggested as responsible for both mentioned deviations. But one should then invoke a friction/noise
relation-ship contrary to other results/5, 7/. Then the situation is not
clear.
A third hypothesis seems to us more likely to prove true, as it fits well with both observations a and b: the stiffness modulus is much higher for rigid than for flexible pavements;
and for the latter, stiffness increases with age (compaction)
and frequency. In a new asphalt pavement there are great
diffe-rences in stiffness between the binder and the aggregate. Stone-to-stone contact is poor due to the soft asphalt binder in-between the stones. Big impedance steps mean a poor transfer of
VTI-CRR- SOC 72.222 r r . x r I . ; v 1 r x 1 x . . v r t r'T F-T r-w r Tire noise ---Sound propagation I ' l l l r i I l O I ' I «A0 U1 I l l l l l l l l l l l l l L l l l l l l l l l l l l 1525 zéosbo1d30206045bosdnHz
Fig 19: Difference in tire/
road noise (average of tires P,
S, W) between two pavements,
compared to difference in
sound propagation (absorption). The r.m.s. difference in tex-ture spectra is less than 2 dB.
*"similar" being defined as in
vibrations. But in a rigid pavement, or an old compacted bitumi-nous pavement, the structure is more uniform concerning stiff-ness. See further /12/.
This can have the effect that surface stiffness influences either the sound generation in the tire (matching mechanical impedances) or the vibratory propagation leading to a sound radiation from the surface itself when radiation areas can get a sufficient size.
STANDARD SURFACE FOR TIRE TESTING
According to our findings, two different surfaces for tire noise testing should be standardized, each being specifically intended to excite a given noise generating process. One could
then suggest:
lo) a smooth and flat surface for testing the tire HF noise,
20) a rather rough surface for testing the tire LF noise.
More precise definitions couldn't be given at the time being since a lot of practical problems are still to be solved; the least not being to make the definitions compatible with field as well as laboratory testing technical requirements.
QUIET AND SAFE SURFACE
Reducing "pavement noise" has long been thought as conflicting with one of the major safety requirements, namely skid resistance.
This can however no longer be tu m xi since many counterexamples
have recently been given /2, ll, 13/.
The findings give some hints on how a quiet road surface
should be constructed:
10) limit surface roughness in the wavelength range above 10 mm,
20) enhance surface roughness in the wavelength range below 10 mm,
30) avoid superficial grooves or closed pockets,
40) favour sound absorption, (e.g. use porous, open surfaces),
50) if microtexture has any importance to noise, it should also be as pronounCed as possible (i.e. friction be high).
A quiet road surface as sketched above would probably also
be near-ideal concerning safety. There is no general conflict between the demands for high skid resistance and low noise.
CONCLUSIONS
Based on the two independent research projects reported
herein, it is concluded that:
- The road surface influence on tire/road noise can be character-ized on the basis of pure geometrical features - a large-scale and a small-scale macrotexture measure. Some residual deviations not explained by the latter can be traced to acoustical (sound absorption) or mechanical properties (probably surface stiffness). - Two independent generation processes have been identified;
one, in the low-frequency range (below about 1 kHz), is radial
roughness-induced vibration; the other, in the high-frequency
range, is tentatively identified as air-pumping or air-resonant radiation. The two processes give fairly equal contributions to the A-weighted level for the tested car tires (except patternless tire) which could explain some of the earlier confusion concerning
35
generation mechanisms. No friction influence as reported from some laboratory experiments /5, 7/ has been confirmed.
- There is no general conflict between safety and low noise for a pavement, on the contrary those demands can be easily combined.
ACKNOWLEDGEMENTS
The Belgian part of the work was financed by the IRSIA (Insti-tut pour l'Encouragement de la Recherche dans l'Industrie et l'Agriculture). The Swedish part of the work was made in a project sponsored by the Swedish Board for Technical Development. The cooperative work was sponsored by our respective institutes.
/l / /2 / /3 / /4/ /5 / l6 / / 7/ /8./ /9./ /10/ /ll/ /12/ /13/ /14/ REFERENCES
0. Bennerhult, "Acoustical and Mechanical Impedance of Road Surfaces and the Influence on Tire Noise", Proc. of the Int. Tire Noise Conf. 1979, Stockholm
G. Descornet, "Experimental Study of the Rolling Noise of a Test Car on Various existing Road Surfaces in Belgium", Proc. of the Int. Tire Noise Conf. 1979, Stockholm A.C. Eberhardt, "Investigation of the Truck Tire Vibration Sound Mechanism", Proc of the Int. Noise Conf. 1979, Stockholm
R.E. Hayden, "Roadside Noise from the Interaction of a Rolling Tire with the Road Surface", Blst Meeting of the Acoust. Soc. of America, Washington (1971)
W. Liedl, D. Denker, "The Influence of Road and Tread Pattern on Tire Noise and Skid Resistance", Proc. of the Int. Tire Noise Conf. 1979, Stockholm
N.A. Nilsson, "Air Resonant and Vibrational Radiation - Possible Mechanisms for Noise from Cross-Bar Tires", Proc. of the Int. Tire Noise Conf. 1979, Stockholm N.A. Nilsson, O. Bennerhult, S. soderqvist, "External Tire/Road Noise; its Genera-tion and ReducGenera-tion", Inter-Noise 80, Miami
P.I.A.R.C. (Permanent International Association of Road Congress) "Report of the Technical Committee on Surface Characteristics", XVIth World Road Congress, Vienna (1979)
U. Sandberg, "Road Texture Induced External Tire Noise", Report 174A, National Road and Traffic Research Institute, Link ping, Sweden (1979)
U. Sandberg, "Characterization of Road Surface with Respect to Tire Noise", Proc. of the Int. Tire Noise Conf. 1979, Stockholm
U. Sandberg, "A Road Surface for Reduction of Tire Noise Emission", Inter Noise, Warszawa (1979)
U. Sandberg, "A Hypothesis Concerning the Influence of Pavement Stiffness on External Tire/Road Noise", National Road and Traffic Research Institute, Linkbping, Sweden (1980)
J.C. Walker, A.R. Williams, "The Improvement of Noise and Traction due to Road/Tire Interaction", Int. Tire Noise Conf., Stockholm (1979)
O. Bennerhult, U. Sandberg, "vagbelaggningars inflytande p5 dackbuller", Nordic Acoustical Society, NAS-80 Abo (1980)
36 A VU'CRR'SOC N S A VT!-CRR-SOC121H dB (500 Hz) ' dB (400 Hz) 75- 75. TIRE X A TIRE W 80kn h /////2 , 80km/h +0 + 70. / 7o-0 . 0' t/ 65- / 654 D o // u 0* --- "'7 ; - LALD 4 / / / o // 4 '60- 60' ///L.ALV (3 . LT(80 mm) LT(80mm) 55 I I I I . l > I r 1 T t: 30 40 50 dB 60 30 40 50 dB 60 A SPL "Fen-5°C 1 A} SPL vrt-cRR-soc 127:: dB (400 H2) (18 (400 HZ) 75. '75.. TIRE S TIRE P 80 km/h 80 kah + + 70- 704
6'5- 654 .0 60. 60. . LT(80mm) LT(80mm) 55 I I I I i T } I l 1 I} 30 4o 50 dB 60 30 4o 50 dB so
'Fig. 6-9: Noise vs texture critical band levels. The actual reg-ression in fig. 7 could be seen as the superposition of two
rough-ness excitations :L. éI/D due to tire tread, LALV due to pavement.
A dB 65-60. 37 SPL (3150 HZ) VU CRR- SOC I2 742 TIRE X 80 km/h 55-g. LT(3.2mm) 50 e 1 e; 20 30 40 dB 50 A SPL vrl CRR-SOC!2140 dB (3150Hz) o 55- HRS s 80km/h \. \8 50. V o. 1 + 55- .
\
LT(2.0mm) 50 r , 1% 20 30 40 dB 50Fig. 10-13: hJoise vs texture band