Master of Science Thesis
KTH School of Industrial Engineering and Management
Techno-economic Feasibility Study of a
Biogas Plant for Treating Food Waste
Collected from Households in Kartamantul
Region, Yogyakarta
Master of Science Thesis
KTH School of Industrial Engineering and Management
Energy Technology EGI-2017-083MSC
Examensarbete EGI 2017:083 MSC
Techno-economic Feasibility Study of a Biogas
Plant for Treating Food Waste Collected from
Households in Kartamantul Region, Yogyakarta
Adam Al Naami
Godkänt ExaminatorSemida Silveira
HandledareDilip Khatiwada
Fumi Harahap
Uppdragsgivare KontaktpersonSammanfattning
Denna avhandling visar potentialen för biogasproduktion med hjälp av matavfall som samlats från regionen Kartamantul i Yogyakarta, Indonesien. Biogas kan användas för matlagning och elproduktion. Studien jämför två olika slutanvändningar eller marknader för att utnyttja biogasen i regionen. Det dagliga matavfallet som samlas i regionen Kartamantul är 120 ton. Detta motsvarar en daglig biogasproduktion på 13 087 m3. Elektricitet som genereras från biogas kan ersätta fossilbaserad koldioxid, medan tillagning av biogas kan ersätta det gemensamma fossila bränslet flytande petroleumgas (LPG). Priset för att sälja en kWh el till det statligt ägda företaget PLN är 16,5 USD cent. Priset för att sälja en m3 biogas för matlagning är 38,5 USD cent, vilket motsvarar det tillgängliga priset på LPG. Studien konstaterar att den undvikna utsläppet på grund av substitutionen av fossilbaserad kolkraft och matlagning av gasol är cirka 64 GgCO2-ekv per år.
Med tanke på de ekonomiska resultaten för en livslängd på 20 år i det första utnyttjandegradet ger Biogas for Electricity ett nettopåverkande värde (NPV) på 2 MUSD medan för utnyttjandegraden Biogas for Cooking ger ett nettoförskott (NPV) på 5,82 MUSD. Breakeven för biogas för el är 13,8 USD cent per kWhe medan för Biogas for Cooking är 25,5 USD cent per m3-biogas. Studien drar slutsatsen att det är möjligt att investera i AD-anläggningar i regionen Kartamantul där båda marknaderna är lönsamma och miljövänliga.
Nyckelord: Biogas anläggning, matavfall till biogas, tekno-ekonomisk genomförbarhet studie, utsläpp av växthusgaser
Master of Science Thesis
EGI 2017:083 MSC
Techno-economic Feasibility Study of a Biogas
Plant for Treating Food Waste Collected from
Households in Kartamantul Region, Yogyakarta
Adam Al Naami
Approved ExaminerSemida Silveira
SupervisorDilip Khatiwada
Fumi Harahap
Commissioner Contact person
Abstract
This thesis presents the potential of biogas production using food waste collected from the region of Kartamantul in Yogyakarta, Indonesia. Biogas can be used for cooking and generating electricity. The study compares two different end uses or markets for utilizing the biogas in the region. The daily food waste collected
in the region of Kartamantul is 120 tonnes. This corresponds to a daily biogas production of 13 087 m3.
Electricity generated from biogas can replace fossil-based coal electricity while cooking biogas can substitute the common fossil fuel liquefied Petroleum Gas (LPG). The price for selling one kWh of electricity to the state
owned enterprise PLN is 16.5 USD cents. The price for selling one m3 of biogas for cooking is 38.5 USD cents,
which is equivalent to the available price of LPG. The study finds that the avoided emission due to the substitution of fossil-based coal electricity and cooking LPG-gas is around 64 GgCO2-eq per year.
Considering the economical results for a life span of 20 years in the first utilization option Biogas for Electricity gives a net present value (NPV) of 2 MUSD while for the utilization option Biogas for Cooking gives a net present value (NPV) of 5.82 MUSD. The breakeven for Biogas for Electricity is 13.8 USD cents per kWhe while for Biogas for Cooking is 25.5 USD cents per m3-biogas. The study concludes that it is feasible to invest in AD plant in the region of Kartamantul where both markets are profitable and environmentally friendly. Keywords: AD plants, waste to biogas system, techno-economic feasibility, GHG emission
Foreword
First and foremost I would like to thank Prof. Semida Silveira, Mr. Dilip Khatiwada and Ms. Fumi Harahap for giving me the opportunity to work with this thesis. I would also like to thank the ITM School for financing a part of the trip to Indonesia. Then I would like to give my special thanks to my Indonesian supervisors Mr. Agus Prasetya, Mr. Teguh Ariyanto, Ms. Anggun and all UGM staff for their support through my work on gathering the data needed for completing the thesis and on making my trip a comfortable trip with only wonderful experience.
I would like to thank Mr. Widodo Brontowiyono, Mr. Kasem, and Mr. Fajri in the UII University for inviting me and giving me a presentation on a project on recycling MSW. I would also like to thank Rumah Energy for giving me the opportunity to meet households who use biogas for cooking today.
I am also grateful to the new and old friends and family members who always encouraged and supported me. Adam Al Naami
Nomenclature
AD Anaerobic Digestion
BFC Biogas for cooking
BFE Biogas for electricity
CWB Central Waste Bank
DM Dry matter
DC Direct Costs
FWMSW Food Waste from Municipal Solid Waste
IC Indirect Costs
IDR Indonesian rupiah
GHG Greenhouse Gases
HRT Hydraulic retention time
KTH Royal Institute of Technology
kWh Kilowatt hour
kJ Kilo joule
MSW Municipal Solid Waste
NPV Net Present Value
OLR Organic loading rate
PB Payback-time
PEC Purchase Equipment Costs
SPA Transfer Station
TS Total Solid
TPS Temporary Solid Waste Collection points
USD US dollars
VS Volatile Solid
Currency Equivalent
In this thesis, IDR refers to Indonesian Rupiah
Conversion rate varies in different dates; the equivalent rate is incorporated so far. For example:
Currency Unit – Indonesian Rupiah (IDR) US$ 1 = IDR 13 513 (2017-10-09)
Table of contents
Sammanfattning ... 2
Abstract ... 4
Foreword ... 6
Nomenclature ... 8
Table of contents
... 9
List of figures ... 11
List of tables ... 11
1
Introduction ... 13
1.1 Background ... 13 1.2 Problematization ... 14 1.3 Thesis Objectives ... 15 1.4 Study Scope ... 15 1.5 Outline ... 152
Current Waste Management Practice in the region of Kartamantul ... 17
2.1 Waste composition of the collected waste ... 17
2.2 Waste management in the region of Kartamantul ... 17
3
Process of Anaerobic Digestion ... 20
3.1 Food waste characteristics ... 20
3.2 Biogas yield from Food waste ... 20
3.3 Anaerobic Digestion Process ... 21
3.4 Operational Parameters of Anaerobic Digestion ... 22
3.5 Type of anaerobic reactors ... 23
3.6 Biogas storage ... 27
3.7 Biogas applications ... 28
3.8 Carbon credits ... 29
4
Data and methods ... 30
4.1 Biogas for cooking and for electricity production ... 30
4.2 Utilization of biogas in the region of Kartamantul ... 30
4.3 Appropriate AD technology for biogas production ... 31
4.4 Estimation of Investment cost and revenues ... 33
4.5 Environmental Analysis ... 36
5
Results ... 38
5.1 Biogas and energy production from FWMSW ... 38
5.2 Choice of the AD technology ... 38
5.3 Economic analysis ... 39
5.4 Environmental analysis ... 41
6
Sensitivity analysis for NPV ... 42
6.1 Change in the fuel price ... 42
6.2 Change in price of gate fee ... 42
6.3 Change in the capital cost ... 43
6.4 Change in interest rate ... 44
6.5 Change in the price of emission ... 45
6.6 Change in the TS content of food waste ... 46
8
Conclusions and future work ... 49
8.1 Conclusions ... 49
8.2 Future work ... 49
9
Bibliography ... 50
10
Appendix ... 52
Appendix A: Interview Questions ... 52
List of figures
Figure 1.1 Waste composition towards of MSW from Kartamantul region... 14
Figure 1.2 Outline of the report ... 16
Figure 2.1 Current MSW management in Kartamantul ... 18
Figure 2.2 The landfill Piyungan in picture taken during the observation made in 2017-04-13 ... 18
Figure 3.1 The supply chain of biogas production using food waste as a feedstock ... 20
Figure 3.2 Anaerobic digestion process of complex organic matter adapted from Li Stephen and Jiying (2011) ... 21
Figure 3.3Available anaerobic digestion technologies for waste treatment ... 25
Figure 3.4 Simplified diagram of different designs of anaerobic digesters. A) BIOCEL, B) KOMPOSGAS, C) Valorga, D) Schwarting-Uhde, E) DRANCO and Puxintech and F) Linde-BRV adapted from Nayono (2010) ... 26
Figure 4.1 Method for the calculation of digester volume ... 32
Figure 4.2Method dry or wet AD system. ... 32
Figure 5.1 Avoided emissions due to the substitution of fossil-based coal to electricity and cooking LPG-gas ... 41
Figure 6.1 Sensitivity analysis: Percentage change in net present value (NPV) for a percentage change in fuel price ... 42
Figure 6.2 Sensitivity analysis: Percentage change in net present value (NPV) for a change in gate fee ... 43
Figure 6.3 Sensitivity analysis: Percentage change in net present value (NPV) for a percentage change in capital cost ... 44
Figure 6.4 Sensitivity analysis: Percentage change in net present value (NPV) for a change in interest rate ... 45
Figure 6.5 Sensitivity analysis: Percentage change in net present value (NPV) for a change in emission price ... 46
Figure 6.6 Sensitivity analysis: Percentage change in net present value (NPV) for a change in total solid ... 46
Figure 7.1 Preferred MSW management in Kartamantul ... 47
List of tables
Table 3.1Characteristics of typical food waste... 20Table 3.2 Biogas composition for food waste and the average biogas and methane yields ... 20
Table 3.3 Consumption rates of different biogas appliances ... 28
Table 4.1 Data used to calculate biogas production ... 30
Table 4.2Feedstock characteristics ... 33
Table 4.3 Breakdown of fixed-capital investment items for biogas plant process ... 34
Table 4.4 Filling LPG containers prices ... 35
Table 4.5Data used for calculating the biogas for cooking price ... 35
Table 4.6 Emission factor of alternative Fuels and landfilling of food waste ... 36
Table 4.7 CO2-eq of each GHG ... 37
Table 5.1 Biogas and energy production from FWMSW in the Kartamantul region ... 38
Table 5.2 the design parameters for the proposed AD plant for Kartamantul ... 38
Table 5.3 Components included in the calculation of Capital cost for biogas plant treating food waste from MSW ... 39
Table 5.4 O&M cost parameters ... 39
Table 5.5 Incomes of the analyzed utilization options ... 40
Table 5.6 Basic economic parameters for the analyzed utilization options ... 40
Table 5.7 Economic analysis results ... 40
1 Introduction
1.1 Background
MSW produced and collected by the municipality of Yogyakarta waste management office are treated by using an uncontrolled landfilling system. The uncontrolled landfilling system should be closed in 2014 based on the Act No. 18 per 2008 on Solid Waste Management (Gunamantha et al., 2012). Therefore the local government of Yogyakarta should immediately look for new alternatives for the treatment of MSW.
The second largest category of the MSW sent to landfills in Kartamantul region is food waste, accounting for approximately 27% of the waste stream. Over 120 tonne per day of food waste is sent to Piyungan landfill mixed with MSW (Kurniawati et al., 2014). Food waste in landfill breaks down and releases methane, this gas is a potent greenhouse gas, which contributes to the global warming effect. Methane as a greenhouse gas has about 25 times greater global warming potential than carbon dioxide within a 100-year period (Anderson et al., 2010). The food waste also contributes to landfill leachate that can pollute waterways (EPA, 2015). According to Waste to Energy guidebook (2015) the high moisture content of waste in Indonesia is what makes the waste a potential feedstock for the selection of anaerobic digestion (AD) as a suitable waste to energy technology (Mulyana, 2015).
Kartamantul region is an acronym of three cities: Yogyakarta city, Sleman and Bantul. The intercity region lies in the province of Yogyakarta, Indonesia. The GDP of the region has grown at an annual rate of 4.53% over the past five years. This has led to an increase to the household consumption, which in turn leads to an increase of the Municipal Solid Waste (MSW) produced, from households (Gunamantha et al., 2012).
Kartamantul region does not have any local fossil fuels, coal and natural gas. Therefore it needs to secure these fuels for transport and energy use. Therefore, regional government, research institutions, universities and NGO are focusing on the development and use of renewable energy sources such as biomass (Rahmada 2017, personal communication, April 20). Biomass includes municipal solid waste, organic waste such as food waste from resident- and commercial buildings. The landfill available in the region is named Piyungan and is located
in Bantul, where the area of the disposal location is about 120 000 m2 accommodating 2.7 milliontonnes of
waste (Rahmat et al., 2009).
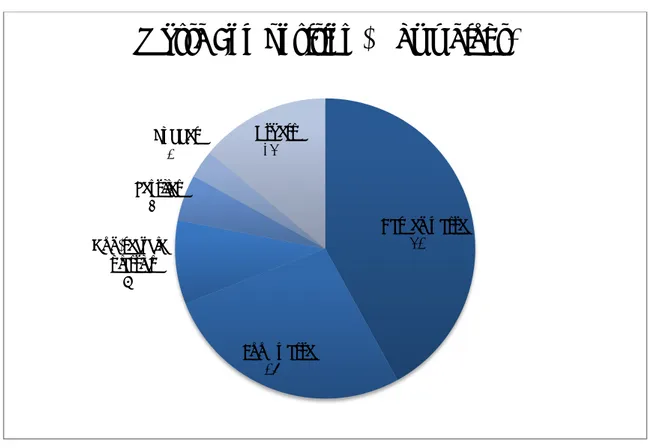
The average MSW collected and transported to the landfill in Kartamantul is around 440 tonnes per day in 2014 (Kurniawati et al., 2014). The composition of waste collected and transported to the landfill Piyungen in Kartamantul region is presented in figure 1.1 below.
Figure 1.1 Waste composition towards of MSW from Kartamantul region (Kurniawati, et al., 2014)
Out of the waste collected garden waste is the highest waste generated by weight, food waste is the second highest waste generated by weight about 27%. Garden waste is not suitable for anaerobic digestion because it contains a large amount of non-organic materials compared with food waste, which has a large amount of organic waste (Cassie, DiLeo and Lee 2010).
This feasibility study intends to focus on anaerobic digestion (AD) plants as an alternative instead of uncontrolled landfilling for treating collected food waste contained in the MSW.
1.2 Problematization
The region of Kartamantul faces many problems that can potentially be solved with help of anaerobic digestion of food waste. The biogas production could provide multiple benefits to the Kartamantul region by providing energy services (e.g. cooking, heating and electricity), improving local environment, and contributing to the mitigation of the climate change. Furthermore, social benefits such as new job opportunities and a better living environment for the inhabitants of the city could result from the successful implementation of the waste to biogas project (Perez, 2014).
The region uses fossil fuels for both cooking and electricity production. For cooking the main fuel is liquefied petroleum gas (LPG), which contains flammable hydrocarbon gases including propane and butane. For electricity production the main fuels used are coal followed by natural gas (Rahmada 2017, personal communication, April 20). These fuels contribute to the increase of greenhouse gases. Anaerobic digestion of food waste produces biogas which is a fuel that can be used for both cooking and electricity production. The landfilling system used is uncontrolled system which contributes to GHG emission e.g. food waste in the landfill breaks down into methane which is a potent gas and has a high greenhouse gas potential. It also pollute the waterways used in the region (EPA, 2015).
There is enormous amount of food waste produced from households where the waste is dumped directly into the landfills instead of utilizing it (Rahmada 2017, personal communication, April 20). Waste to biogas is a potential solution to provide the urban area with clean energy services and clean environment.
Garden waste 42% Food waste 27% Non-recycled plastics 9% Textiles 5% Rubber 3% Others 14%
The economic feasibility and the technology suitable for the use of food waste from MSW in the region of Kartamantul are still undocumented. This study aims to identify the potential of biogas production from food waste and the use of biogas in conditions specific for the region of Kartmanatul. Since the region is consisted of the urban area of Yogyakarta, the results of the study might be relevant to other urban regions with similar conditions.
This study focus on the technical and economic factors which will help investors from private industry and the municipality to base their decisions in developing anaerobic digestion plant in the region of Kartamantul using collected food waste from MSW.
1.3 Thesis Objectives
The objective of this study was to identify the potential of biogas production from food waste and use in the region of Kartamantul and which anaerobic digestion technology should be used for biogas generation and
which biogas utilization alternativegives the most benefit in case of the possible direct economic benefits and
environmental gains can be accrued.
The main research question of this study was:
• What are the economic and environmental impacts of biogas utilization from food waste using anaerobic digestion technology?
To answer this question it leads to the following sub-questions, these questions are the main focus of this study:
• What technology should be used for biogas generation using food waste from MSW? • What utilization option of biogas is more profitable?
• What is the avoided emission from substituting fossil-based coal electricity and cooking LPG gas to biogas?
1.4 Study Scope
This study is limited only to the MSW that is already being collected by the municipality and transported to the landfill in the region of Kartamantul. The focus on collected MSW is because the data on the collection of MSW is available while the data of MSW generation in the region is not available from the received reports and the interviews done. The AD technology focused will be large scale AD systems. The study focus on the economic and environmental feasibility of a biogas plant for treating food waste collected from MSW in the region of Kartamantul.
Two utilization options are focused on biogas for electricity production (BFE) and biogas for cooking (BFC). The capital investment for BFE has no transmission costs for the electricity produced because the transmission investment is done by the state owned enterprise PLN. While for BFC transmission cost is needed in form of pipes to households and residential buildings to transport the biogas produced in the plant.
1.5 Outline
Chapter 1: The first part introduces the reader to the municipal solid waste management problems introduced in the region of Kartamantul. The chapter also contains the objectives of this study with the study scope. Chapter 2: The second part presents the reader with an overview of the current waste management practice in the region of Kartamantul
Chapter 3: The third part describes the theory behind utilizing food waste as a feedstock. The chapter includes technology options to treat food waste for biogas production in the region of Kartamantul. It also includes the factors to consider for producing biogas and choosing the right technology.
Chapter 4: The fourth part introduces the data and the methods used in the analysis.
Chapter 5: The fifth part presents results and discussion and presents the appropriate design parameters of the AD technology to implement in Kartamantul.
Chapter 6: The sixth part presents the sensitivity analysis
Chapter 7: The seventh part presents the discussion of the results
Chapter 8: The eighth part presents the conclusions and recommendations for future studies on the topic.
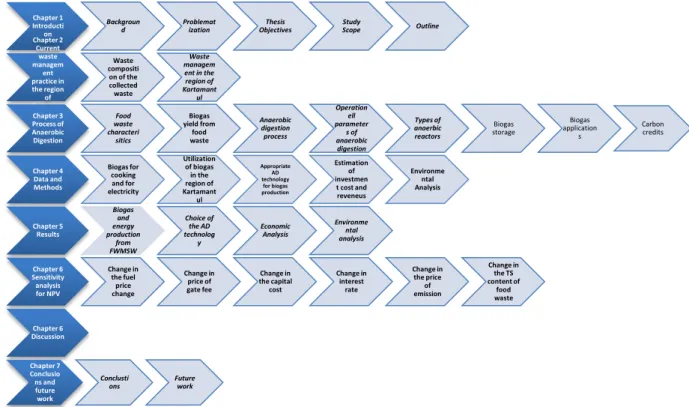
Figure 1.2 Outline of the report
Chapter 1 Introducti on
Backgroun
d Problematization ObjectivesThesis Study Scope Outline Chapter 2 Current waste managem ent practice in the region of Kartamant ul Waste compositi on of the collected waste Waste managem ent in the region of Kartamant ul Chapter 3 Process of Anaerobic Digestion Food waste characteri sitics Biogas yield from food waste Anaerobic digestion process Operation ell parameter s of anaerobic digestion Types of anaerbic reactors Biogas storage Biogas application s Carbon credits Chapter 4 Data and Methods Biogas for cooking and for electricity Utilization of biogas in the region of Kartamant ul Appropriate AD technology for biogas production Estimation of investmen t cost and reveneus Environme ntal Analysis Chapter 5 Results Biogas and energy production from FWMSW Choice of the AD technolog y Economic Analysis Environme ntal analysis Chapter 6 Sensitivity analysis for NPV Change in the fuel price change Change in price of gate fee Change in the capital cost Change in interest rate Change in the price of emission Change in the TS content of food waste Chapter 6 Discussion Chapter 7 Conclusio ns and future work Conclusti
2 Current Waste Management Practice in the region
of Kartamantul
2.1 Waste composition of the collected waste
The region of Kartamantul produces large quantities of municipal solid waste that is suitable for conversion to energy. According to the document made by the department of Public Works (2015) the volume of waste collected in the region has an average increase of 10% per year. It has increased from 9300 tonnes per month in 2010 to 13200 tonnes per month in 2014. Based on this data the average mass of waste to the Piyungan landfill amounts to 440 tonnes per day (Kurniawati et al., 2014). Segregation and sorting of the waste at source is not common in the region because the requirements are not met. I.e. it requires community per producer agreement and robust government collection systems (Rahmada 2017, personal communication, April 20). Out of the waste collected garden waste is the highest waste generated by volume about 42%, food waste is the second highest waste generated by volume about 27%. The dominant waste generated in region of kartamantul is from the household sector, traditional markets and commercial areas while the rest come from public facilities (schools, offices, roads etc.). The composition of waste in the landfill Piyungen in Kartamantul is presented in figure 1.1.
2.2 Waste management in the region of Kartamantul
Collection of waste depends on the sector the waste is generated from. In the first case of residential waste there are two options for waste collection. The first option is called collection points and also called TPS. This option is more practiced in most middle and low-income areas. Private waste collectors or residents bring their waste to the TPS. Thereafter the waste is collected from the TPS and transported to the landfill using 7.8 tonnes dump trucks (Ariyanto 2017, personal communication, April 18). The second option is door-to-door service, which is mainly focused in high-income areas.
In the case of non-residential waste the daily collection of mixed MSW use 7.8 tonnes dump trucks which is the same type of trucks used when collecting residential waste. The waste is collected first to various TPS near the non-residential area, and then collected by the municipality and transported to the Piyungan landfill In the case of market waste the daily collection use either 7.8 tonnes arm-roll containers or trucks to collect and transport directly to the landfill (Ariyanto 2017, personal communication, April 18).
The intermediate handling options that are used in the region is the following (Rahmada 2017, personal communication, April 20):
• Waste banks: Waste banks also called community based waste banks (CWB) helps increase the participation in recycling and improve the rates of recycling. Household owners have the opportunity to sell their recyclables like plastics. The recyclables are then sold to local waste dealers or to the central waste bank.
• Transfer station – SPA: Is a facility where MSW is unloaded from collection vehicles and briefly held before being reloaded onto larger, long-distance transport vehicles for shipment to a landfill or other treatment facility.
• Temporary solid waste collection point – TPS: Are collection points where residents or private waste sector collect the waste and unload it there. It is serving 300 households or a community association called (Rukun Warga RW). Typical TPS are made of concrete bunkers with volumes of approximately 2 m3.
There is also another intermediate handling that is not used yet in Kartamantul but is used in other regions in Indonesia (Waste to Energy guide book, 2015):
• Temporary solid waste storage and recycling point – TPS-3R: Is similar to TPS but can cover an area of more than 200 m2. In TPS-3R waste can be sorted manually into three different categories: food waste, inorganic recyclables and residue waste destined for landfill disposal.
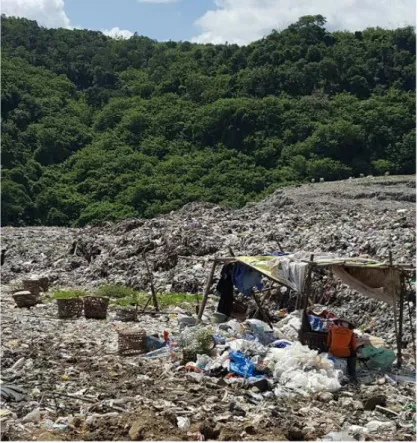
Figure 2.1 shows the current waste management in the region of Kartamantul. In the current waste management there is no separation of food waste available. The waste generated is being collected by private waste collectors or residents bringing their waste to the temporary solid waste collection point (TPS). Thereafter the waste is collected from the TPS by the department of public works and transported to the landfill using 7.8 tonnes dump trucks (Rahmada 2017, personal communication, April 20). Piyungan landfill is an uncontrolled landfill where no treatment of the waste unloaded there is done from the department of public works. However, informal treatment occurs in the landfill. The informal treatment includes sorting and depositing in the landfill done by scavengers. The scavengers do not act on environmental awareness, but on the financials gains. Many farmers who live nearby the landfill feed their cows from the foodwaste unloaded in the landfill. (Rahmada 2017, personal communication, April 20).
Figure 2.1 Current MSW management in Kartamantul (Rahmada 2017, personal communication, April 20)
Figure 2.2 The landfill Piyungan in picture taken during the observation made in 2017-04-13
Gate fee
Gate fee is the charge paid by the local authority to the treatment facility. It represents a unit usually per tonne. The department of Public works pays 1.8 USD per tonne in the region of Kartamantul. This generates a stream of revenue to the service provider (Subekti 2017, personal communication, April 21).
Depending on the budget for waste management of the local authority the gate fee vary over time. The estimated gate fee paid in Europe for treating food waste is around 60 Euro per tonne, which is equivalent to 70 USD per tonne (Eunomia Research & Consulting, 2002).
3 Process of Anaerobic Digestion
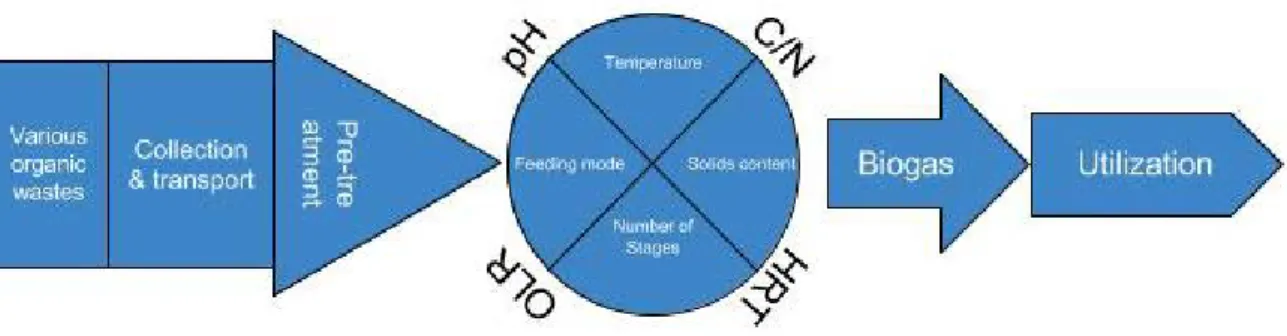
This chapter explains in detail the process of anaerobic digestion for biogas production using food waste from MSW (FWMSW). The figure 3.1 below shows the supply chain of biogas produced from FWMSW adapted from the Vögeli (2014).
Figure 3.1 The supply chain of biogas production using food waste as a feedstock (Vögeli et al., 2014)
3.1 Food waste characteristics
When using a feedstock for anaerobic digestion there are few characteristics that need to be considered. The first one is the moisture content (wt. %) and second one is the dry matter (TS). The dry matter contains both organic and inorganic material. The content of organic dry material also called volatile solid (VS) is what makes an attractive feedstock for anaerobic digestion or not. Volatile solid (VS) should be at least 60% of the total matter to consider it for anaerobic digestion (Favoino et al., 2013).
Table 3.1 shows the food waste characteristics conducted by two international studies made by Tang 2008 and Kiran 2014. These values are optimal for anaerobic digestion.
Table 3.1Characteristics of typical food waste (Tang, et al., 2008; Kiran, et al., 2014).
Component Percentage (%)
Moisture content 80.30
Total Solid (TS) 19.70
Volatile Solid (VS) 95.4
3.2 Biogas yield from Food waste
The product of the anaerobic digestion process is the biogas. Biogas is mostly composed of methane and carbon dioxide (Perez, 2014). Table 3.2 shows the biogas characteristics and composition produced from food waste.
Table 3.2 Biogas composition for food waste and the average biogas and methane yields (Vögeli, et al. 2014; Basdata om biogas, 2012)
Parameter Unit Biogas composition
Density Kg per Nm3 1.1
Calorific value MJ per Nm3 23
kWh per Nm3 6.5
Methane Vol-% 65
Methane, variation Vol-% 60-70
Carbon dioxide Vol-% 35
Carbon dioxide, variation Vol-% 30-40 Nitrogen Vol-% 0.2 Water % 2 (20°C) – 7 (40°C) Hydrogen sulphide ppm 0-4000 Ammonium ppm 100
The average methane production from mixed food waste is 381 m3 per tonne-VS taken from an international
study on biogas yield recorded from anaerobic digestion of food waste (Khalid et al., 2011). This average yield is used in the calculations of this report.
3.3 Anaerobic Digestion Process
Anaerobic digestion process includes biological and chemical transformation processes of feedstock in the digester, which leads to value products.
Anaerobic Digestion (AD) is a series of biological processes where bacteria break down organic material in an environment absent of oxygen to produce biogas. The other product produced is the digestate or even called for effluent, which is a mixture of bacterial biomass (Vögeli et al., 2014).
The anaerobic digestion process can be divided into four stages that are presented in figure 3.2 below.
Figure 3.2 Anaerobic digestion process of complex organic matter adapted from Li Stephen and Jiying (2011)
Hydrolysis
This stage is the slowest of the four degradation stages. In this stage water is added to the mixture in order to break down the chemical bonds of lipids, carbohydrates and protein into simple, soluble monometers that can be absorbed and used by microorganisms as food source. Proteins are broken down into amino acids, lipids into fatty acids, and carbohydrates into sugars (Vögeli et al., 2014).
CH4, CO2
Acetic acid, H2, CO2
Methanogenesis
Volatile fatty acids
Acetogenesis
Sugars, amino acids, fatty acidsFermentation
Carbohydrates, protiens, fatsFermentation per Acidogenesis
In this stage the sugars, fatty acids and amino acids are broken down by the acidogenic bacteria per fermentative bacteria into carbon dioxide, hydrogen, alcohol, organic acids and ammonia. This stage is the fastest in the anaerobic conversion (Chen and Neibling, 2014).
Acetogenesis
In this stage, acetogenic bacteria convert the organic acids and alcohols left from the previous stages into hydrogen, carbon dioxide and acetic acid. The hydrogen plays an important intermediary role; because the reactions need low partial pressure to allow the conversion of the acids from stage 2 (Chen and Neibling, 2014). Methanogenesis
During this last stage, methanogenic bacteria convert the hydrogen and acetic acid to methane and carbon dioxide. This stage is affected by the conditions presented in the reactor. The conditions of the reactor are affected by the following factors: temperature, feed composition and organic loading rate (OLR) (Chen and Neibling 2014).
The anaerobic digestion process stages depend on the following parameters: • Temperature
• pH • C:N ratio
• Organic loading rate (OLR) • Hydraulic retention time (HRT) • Mixing
3.4 Operational Parameters of Anaerobic Digestion
The microorganisms grow rate is of great importance for the AD process. The operating parameters are the ones that control the grow rate of the microorganisms and therefore helps break down the organic material. Therefore it needs to be controlled by the user to increase the AD efficiency. In this subchapter the most important parameters are explained.
Temperature
Temperature in the digester is very important since the microorganisms are temperature sensitive. Low temperatures below 15 °C make the digestion process very slow and therefore would not work satisfactorily (Kossmann and Pönitz 2011). Large temperature variations, such as those between day and night or even seasonal variations, can also affect the performance of the AD system negatively. Therefore a heating system and insulation can be required to provide optimal digestion temperature in cold climates or in the changes between day and night.
There are two unique temperature ranges for the performance of anaerobic digestion of food waste. One is called mesophilic range for mesophilic microorganisms which is between 30-40 °C where the most stable temperature is around 35 °C. The other one is called thermophilic range is for thermophilic microorganisms which is between 45-60 °C where the optimum temperature is around 55 °C (Vögeli, et al., 2014; Curry et al., 2012).
Mesophilic microorganisms are more stable when operating a digester because they can tolerate greater changes in environmental parameters and they can consume less energy. Another advantage is that the ammonium production is less than in the thermophilic range. However there is also a disadvantage using mesophilic microorganisms, which is that the digestion system is slower than the use of thermophilic microorganisms (Vögeli et al., 2014).
Another important parameter in the AD system is the pH level where the optimum pH for a generally stable AD process and high biogas yield lies in the range of 6.5 – 7.5 (Mata-Alvarez, 2003; Khalid et al., 2011; Chen et al., 2014). During hydrolysis and acidogenesis phases the pH levels is between 5.5-6.5, while during methanogenic phase pH level lies between 6.5-8.2 (Khalid et al., 2011). To raise the pH of AD systems, lime and sodium bicarbonate can be used. Lime is usually cheaper but because it is not soluble, it leads to clogging of pipes if large quantities are used (Vögeli et al., 2014).
Carbon to nitrogen ratio (C:N)
The optimal C:N ratio is between 16 and 25. A high C:N ratio results in low gas production. While a low C:N ratio causes ammonia accumulation, which leads to a high pH value approximately 8.5. These conditions may be harmful to the methanogenic bacteria and therefore can harm the AD process (Verma et al., 2007). To achieve an optimal C:N, mixing of different feedstock materials can be required, with high and low C:N ratios. High C:N ratio feedstock can be organic solid waste while low C:N ratio can be sewage or animal manure.
Organic Loading Rate (OLR)
Organic Loading Rate (OLR) represents the substrate quantity introduced into the reactor volume in a given time. It measures the biological conversion capacity. OLR is a parameter that is particularly important in continuous systems. Overloading leads to an increase in volatile fatty acids which leads to acidification and can therefore lead to a system failure because of an increase in the pH level. The examples of continuous AD systems in industrialized countries where the reactors is continuously stirred, describe that the optimal OLR should be between 4-8 kg VS per m3 reactor and day (Lissens et al., 2001). While in reactors where the mixture is not stirred continuously the recommended OLR should be below 2 kg VS per m3 reactor and day (Vögeli et al., 2014).
Hydraulic Retention Time (HRT)
Hydraulic Retention Time (HRT) measures the time the liquid fraction remains in the reactor. The HRT required to allow complete AD reactions varies with the following parameters: process temperature and waste composition. The recommended HRT for wastes treated with mesophilic microorganism’s range from 30 to 35 days (Rahmada 2017, personal communication, April 20). The steady HRT reached was 35 days in the mesophilic digester while only 30 days in the thermophilic digester (El-Hadj et al., 2007).
Mixing
Advantages of mixing and stirring inside the digester are to blend the feedstock with the digestate to make the feedstock reachable for the bacteria. Mixing also helps avoid temperature gradients within the digester and also prevents formation of scum (Deublein and Steinhauser 2011).
3.5 Type of anaerobic reactors
AD technology varies from simple plants to complex plants depending on the conditions it is implemented at. Factors like volume, characteristics of the feedstock used. AD plants can be located in both rural and urban areas.
In rural areas in developing countries like Indonesia the main AD systems used are small-scale biogas plants uses mainly dung from cattle as a feedstock and the biogas produced are mainly used for cooking. Small-scale
plants implemented in Indonesia have a volume up to 12 m3 (BIRU, 2015).
In urban areas in developing countries like Indonesia both small scale and large scale AD systems can be used. However for this study the focus will be on large scale AD systems.
A study made by European Commission estimate the cost of large scale AD plants in Europe between 60-70 euro per tonne in Sweden and 80-96 euro per tonne in UK, which is equivalent to 70-82 USD per tonne and 93-112 USD per tonne respectively (Eunomia Research & Consulting, 2002). The cost of AD systems in Indonesia is not known therefore this study makes an estimation of the cost by using sources from interviews made during the trip and from the literature recommended by the professors interviewed.
The price of electricity in Europe is between 0.14-0.20 euro per kWh which is equivalent to 0.164-0.234 USD per kWh (Eurostat, 2017)
Types of anaerobic reactors for food waste
Figure 3.3 shows the technologies available depending on the characteristics of the plant.
Typically anaerobic digestion reactors can be distinguished depending on the feeding mode and the moisture content of the substrate.
In case of the feeding mode there are two modes that are generally used in AD of food waste: the continuous mode or the batch mode. In the batch mode the digesters are filled once and sealed until the retention time finishes. Later it is opened and the effluent is removed. While in the continuous mode, the feedstock continuously enters the digester and an equal amount of effluent is removed (Lissens et al., 2001).
One of the most important parameters for AD systems is the moisture content or total solid contained in the feedstock. The process of AD can be either wet or dry system. The wet system has a feedstock with the TS between 0.5%-15% while the dry has a feedstock with the TS between 15-40% (Curry and Pragasen, 2012; Li, et al., 2011).
Some advantages of dry system are smaller reactor capacity requirements, less energy used for heating, no processing energy needed for stirring, the produced digestate is much easier to handle due to its lower water content. Some disadvantages of dry system are larger amounts of organisms is required and much longer retention time (Vandevivere, 2002).
Some advantages of wet system are dilution of inhibitory substances by process water and requirement of less sophisticated mechanical equipment. Some disadvantages of wet system are complicated pre-treatment, high consumption of water and energy for heating and the reduction of working volume due to sedimentation of inert materials have to be taken into account (Banks and Steniford 2007).
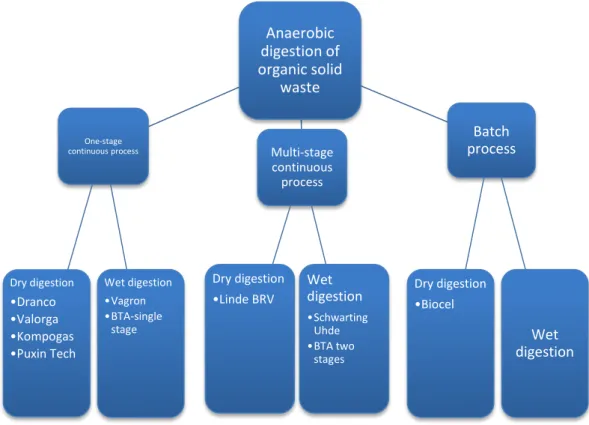
Commercialized anaerobic digester plant designs have been developed according to several basic characteristics. These characteristics are batch or continuous feeding mode, characteristics of waste, operating temperature, mixing method, reactor type and process flow. Figure 3.3 presents the available anaerobic digestion technology for food waste treatment.
Figure 3.3Available anaerobic digestion technologies for waste treatment (Nayono, 2010) Anaerobic digestion of organic solid waste Multi-stage continuous process Wet digestion •Schwarting Uhde •BTA two stages Dry digestion •Linde BRV Batch process Wet digestion Dry digestion •Biocel One-stage continuous process Wet digestion •Vagron •BTA-single stage Dry digestion •Dranco •Valorga •Kompogas •Puxin Tech
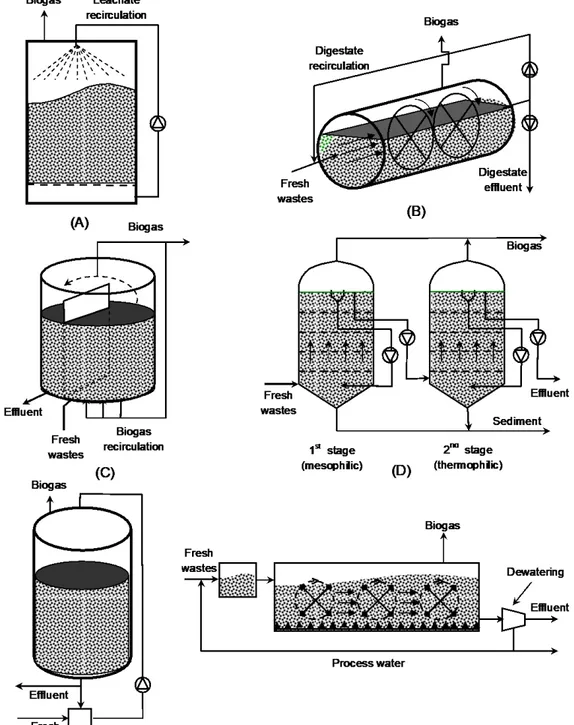
Figure 3.4 Simplified diagram of different designs of anaerobic digesters. A) BIOCEL, B) KOMPOSGAS, C) Valorga, D) Schwarting-Uhde, E) DRANCO and Puxintech and F) Linde-BRV adapted from Nayono (2010)
A. BIOCEL anaerobic digestion system
This system developed by BIOCEL has a batch-feeding mode and has a dry anaerobic digestion system. The total solid (TS) concentration of the feedstock substrate needs to be maintained between 30-40% dry matter. The digester is built by concrete and the process has mesophilic temperature. The floors of the digesters have small holes and have a chamber below for leachate collection. During the feeding phase, the waste substrate and inocula (is the digestate from previous feeding) are mixed together and loaded to the digester. In order to control the odor emission, the digesters are closed with airtight doors. This system should be housed in a closed building that is kept under-pressure. Typical retention time in this process is between 15 – 21 days (Brummeler, 2000).
This system developed by KOMPOGAS has a one-stage continuous feeding mode and dry anaerobic digestion process. The digestion process takes place in a horizontal plug-flow reactor operated at thermophilic temperature. The waste is mechanically pre-treated to reduce the size of the substrate and to remove the impurities. A Total Solid concentration between 23-28% is maintained in the digester. Typical retention time in this process is between 15-20 days (Nayono, 2010).
C. Valorga anaerobic digestion system
This system developed by Valorga has a one-stage continuous feeding mode and dry anaerobic digestion system. It uses a cylindrical reactor, which can be operated at both, mesophilic and thermophilic temperature. There is a vertical mixing performed by internally recirculate high pressure biogas injection every 15 minutes. Typical retention time in this process is between 18- 25 days at mesophilic temperatures (Nayono, 2010). One technical disadvantage is when treating feedstock with TS less than 20% the gas injection ports are easily clogged (Vandevivere, 2002).
D. Scwarting-Uhde anaerobic digestion system
This system developed by Scwarting-Uhde has a two-stage continuous feeding mode and wet anaerobic digestion system which is performed by two vertical plug-flow reactors. The first reactor is operated at mesophilic temperature for both hydrolysis and acidification while the second reactor is operated at thermophilic temperature for methanogenesis. The TS concentration of the feedstock should be maintained at around 12%. The retention time of this system is between 10-12 days (Nayono, 2010).
E. DRANCO, Puxin Tech anaerobic digestion system
This system developed by DRANCO and Puxin Tech has a one-stage continuous feeding mode and dry anaerobic digestion system. It is mostly operated by thermophilic temperature (50-55 °C). This process is typically a vertical plug-flow reactor. The feeding is done on the top of the reactor and the removal of the digested slurry is done on the bottom at the same time. Typical retention time in this process is between 15- 30 days (Edelmann and Baier 2005; Vandevivere 2002).
F. Linde-BRV anaerobic digestion system
This system developed by Linde-BRV has a two-stage continuous feeding mode and dry anaerobic digestion system, which is performed by aerobic upstream stage where the slurry is partially hydrolyzed. The pre-digested slurry is then pumped to a rectangular shaped concrete digester. This system is commonly kept at thermophilic temperature. Typically the retention time is between 21-25 days (Zaher et al., 2007).
G. Waasa anaerobic digestion system
This system developed by Waaasa has a one-stage continuous feeding mode and wet anaerobic digestion system. This system can be operated at both mesophilic and thermophilic temperatures. This digestion process takes place in a vertical reactor. For pre-treating the feedstock, both mechanical sorting and waste washing has to be done. The TS concentration is maintained between 10-15%. The thermophilic process requires a retention time of 10 days compared with the mesophilic process, which require 20 days of retention time (Nayono, 2010).
3.6 Biogas storage
Gas production and consumption does not happen at the same time. Therefore it is necessary to collect the produced biogas in appropriate storage facilities. A clear advantage of biogas over other renewable energies such as solar or wind energy is that it can be stored for a long period of time without losing its energy content (Vögeli, et al., 2014). However a disadvantage would be the small energy density where 1 m3 of biogas amounts to 0.6 to 0.7 liters of fuel oil which amounts to 23 MJ. A solution to solve big volumes of biogas is to compress it (Vögeli et al., 2014).
All biogas storage facilities that are not inside a building must be UV-, temperature- and weather-proof. It also must be gastight and pressure-resistant. Gas storage container size can be determined by the gas production rate and the biogas usage rate (Vögeli et al., 2014).
There are three types of storage systems depending on the pressure. The following are the three most used systems for storage:
• Low-pressure storage systems
• Medium-pressure storage: Biogas can be stored in gas storage tanks under pressure of 5-20 bar. This storage method needs less space than low-pressure alternatives. A compression of 10 bar result in saving 10 times more biogas than at normal pressure. This can be achieved with a single stage
compressor. The energy required for this storage method is 0.22 kWh per m3 (Al Seadi, et al., 2008;
Vögeli, et al., 2014).
• High pressure storage systems: This system is more used for car engines and needs about 20 % of biogas energy content to drive the compressor.
3.7 Biogas applications
The biogas conversion efficiency varies depending on the conversion technology and the biogas characteristics. In developing countries biogas is mostly used in stoves, lamps and engines (Vögeli et al., 2014).
The conversion efficiency when using biogas for stoves is 55%, 30% when using it for engines or generators, and only 3 % in biogas-lamps. According to Kossmann the most efficient way of using biogas in large scale AD plants is in a heat-power combination where 88% efficiency can be reached (Kossmann and Pönitz 2011). However, the market for heating is not developed yet in the region. Therefore, this study does not focus on the heat-power combination.
Table 3.3 shows the typical utilization rates of biogas in liters per hour.
Table 3.3 Consumption rates of different biogas appliances (Vögeli et al., 2014)
Biogas Application Consumption Rate (L per h)
Household cooking stove 200 – 450
Industrial burners 1000 – 3000
Refrigerator (100 L) depending on outside
temperature 30 – 75
Gas lamp, equivalent to 60 W bulb 120 – 150
Biogas engine per brake horsepower (746) 420
Generation of 1 kWh of electricity with biogas per
diesel mixture 700
Cooking stove
As mentioned in the table 3.7 above, that household cooking stove requires a consumption rate between 200-450 L per h depending on the gas pressure (Vöegeli et al., 2009). The average consumption is therefore 325 L per h.
Electricity generation
For every cubic meter of biogas there contains around 23 MJ of energy content (Curry et al., 2012). According to a report made by EURELECTRIC on converting biogas into electricity has the efficiency between 30-40%. Which amounts to about 2 kWh of usable electricity can be obtained and the remaining biogas is converted into heat, which also can be used for heating applications (Pomeda and Camacho 2003).
3.8 Carbon credits
Carbon credit is a financial instrument that place a cost on carbon emissions that the energy company using fossil fuels to pay when emitting one ton of carbon. These credits are granted to countries or companies that take action to measurably reduce their greenhouse gases. These credits can be legally traded in the international market at their current market price (http: per www.investopedia.com per terms per c per carbon_credit.asp). An article written by Gold Standard claim that the price of carbon credit paid to renewable energy companies is between 9.4-15.3 USD. It also claims that the economical value of reducing one ton of carbon dioxide by using biogas is 41 USD. Gold Standard is an organization established by WWF as a best practice standard to ensure projects that reduced carbon emissions under the clean development mechanism (Gold Standard, 2016). However this system is not yet released in Indonesia (Subekti 2017, personal communication, April 21). Therefore the current revenue of avoiding emission in the region is US$0.
4 Data and methods
4.1 Biogas for cooking and for electricity production
Method
The total amount of daily biogas produced can be estimated considering the biogas yield. Equation 1 represents this value.
Q̇biogas= ṁfoodwaste∗ γ Equation 1
Where:
Q̇biogas is the daily biogas produced [m3 per day]
ṁfoodwaste is the daily mass of food waste collected [kg per day]
γ is the biogas yield [m3 per kg]
To calculate the energy production the following equation is used:
E = µ ∗ Q̇biogas Equation 2
Where:
E is the daily energy production
µ is the biogas energy density MJ per m3
Data
From table 3.2 the energy content of the biogas produced from food waste is 23 MJ per m3, and the efficiency
of the biogas turbine generator used is around 30% according to the sales engineer Vane Yen from Puxin Tech (2017).
As mentioned in subchapter 3.2 that the biogas yield used for calculation in this study is equivalent 590 m3 per
tonne VS (Khalid et al., 2011).
Table 4.1 shows the data used to calculate biogas production and production.
Table 4.1 Data used to calculate biogas production
Value Unit Reference
Food waste (𝐦𝐦̇𝐟𝐟𝐟𝐟𝐟𝐟𝐟𝐟𝐟𝐟𝐟𝐟𝐟𝐟𝐟𝐟𝐟𝐟) 440 Kg per day (Kurniawati et al.,
2014)
Biogas yield (𝛄𝛄) 590 m3 per
tonne-VS (Khalid et al., 2011)
Energy density (𝛍𝛍) 23
6.25 MJ per m
3
kWh per m3
(Curry et al., 2012)
4.2 Utilization of biogas in the region of Kartamantul
Biogas produced from food waste can be either utilized for cooking or electricity with no upgrading of the gas needed. The utilization options presented here are related to the region of Kartamantul. These utilization options are used throughout the study for the analysis and calculations of the economic-, environmental benefits and the choice of technology.
As mentioned in the chapter that the region of Kartamantul uses now fossil fuels for both cooking and electricity production. However, biogas can be used for both electricity production and for cooking this study will compare and analyze these two utilization options.
4.2.1 Biogas for electricity production
Biogas can be used as a fuel in biogas generators. Biogas generators commercialized now has a power capacity between 144-2000 kW and efficiency between 30-40% (Yen 2017, personal communication, May 22; Bartaire, et al., 2003).
The electricity consumption of an average household in the region of Kartamantul is 196 kWh per month (Wijaya et al., 2011). The electricity produced from biogas plant can be sold to the state owned enterprise Perusahaan Listrik Negara (PLN). PLN has a monopoly on electricity distribution in Indonesia. PLN is controlling the electricity infrastructure in Indonesia, including power generation, transmission, distribution and retail sales of the electricity produced. PLN buy electricity from electricity producers who produce less than 20 MW of electricity for 16.5 USD cents (Rizal, 2015). This means that no distribution costs are needed from the investment in biogas for electricity production. In other countries like Sweden the electricity price varies from 16.4-23.4 USD cents (Eunomia Research & Consulting, 2002).
4.2.2 Biogas for cooking
Biogas can just as LPG work as a fuel for cooking. It can be either stored in containers or sent by pipes to the end consumer. The main fuel used for cooking in the region is LPG, which is a fossil fuel, produced from oil and gas mining and refining (Rahmada 2017, personal communication, April 20).
In this option we substitute LPG with biogas by installing a biogas pipe transmission where the end users e.g. households or restaurants get biogas supplied to their kitchen continuously without the need to buy refill because no container is needed here. This utilization method is validated during the interviews conducted on 3 May 2017, Agus Prasetya who is an expert and teacher in waste treatment and utilization at UGM and conducted on 20 April 2017, Anggun Rahmada who is a professional staff at Waste Refinary Center (2017). The average cooking consumption in the region of Kartamantul is 122.4 kWh per month (Wijaya et al., 2011).
The cost of LPG in Indonesia is between 0.5-0.83 USD per kg-LPG. 0.5 USD per kg-LPG is for the subsidized LPG price and 0.83 is for the unsubsidized LPG price (källa). LPG prices around the world varies between 0.24-0.94 USD per kg (GlobalPetrolPrices, 2017).
4.3 Appropriate AD technology for biogas production
Method
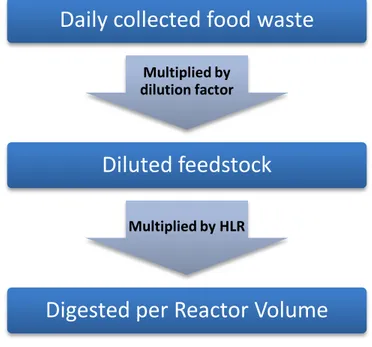
Size of the anaerobic digester
In order to figure out the size of the tank needed to digest the waste, several related parameters are needed: diluted feedstock volume, and hydraulic retention time. The size of the reactor can be calculated by the following equation:
Vreactor(m3) = Q̇Diluted feedstock�m
3
day� ∗ nHRT (days) Equation 3
Figure 4.1 Method for the calculation of digester volume
Organic Loading Rate (OLR)
To calculate the organic loading rate (OLR) the following formula is used (Vögeli et al., 2014):
OLR =Q̇dıluted feedstock̇ ∗Svolatile solid concentration
Vreactor volume Equation 4
Where:
Q̇diluted feedstock is the daily diluted feedstock m3 per day
Svolatile solid concentration is the volatile solid concentration kg VS per m3
Vreactor volume is the reactor volume
The state of the AD
Figure 4.2 shows the method for deciding which is the feeding mode or state do the AD plant and the digester have. When the total solid (TS) is less than 15% then the state of the AD plant should be wet, and when TS is higher than 15% then the state of the AD plant should be dry (Curry & Pragasen, 2012).
Figure 4.2Method dry or wet AD system (Curry & Pragasen, 2012; Li, et al., 2011).
Data
Size of the anaerobic digester
The data needed here to calculate the anaerobic digester size is the dilusion ratio and the retention time. The feedstock will be diluted with water in a ratio of one part of food waste and one part of water (Rahmada 2017,
Daily collected food waste
Multiplied by dilution factor
Diluted feedstock
Multiplied by HLR
Digested per Reactor Volume
Daily collected
food waste
Are Total Solid
less than 15%
Wet process
Dry process
Yes
personal communication, April 20). The ideal retention time for a tropical climate with an average ambient temperature of 25-30°C is recommended to be around 30 days (Rahmada 2017, personal communication, April 20).
Organic Loading Rate (OLR) and Feedstock characteristics
To calculate the OLR the feedstock characteristics needs to be present. These characteristics are presented in table 4.2.
Table 4.2Feedstock characteristics
Operational days and plant lifetime
In a trusted study about AD estimate the operational days to 330 days per year (Zamalloa, et al., 2011). For both utilization options the number of operational days is therefore set to 330 days per year. The NPV are calculated for project lifetimes of 20 years. The lifespan of the plant is estimated to be between 20 and 25 years are commonly used lifetime assumptions according to the same trusted study (Zamalloa, et al., 2011). Assuming from a conservative approach the lifetime of the entire plant to be 20 years, while keeping the maintenance costs constant at 5% throughout the project lifetime (Zamalloa, et al., 2011).
4.4 Estimation of Investment cost and revenues
Method
Total capital investment
Total capital investment is the fund that is required to purchase land, to make the design of the plant system, purchase and install equipment and buildings, as well as to bring the facility into operation (Peters, et al., 2003). All these parameters are explained and taken into account. The costs of the AD reactor and of the land are based on current market values. The capital cost of the AD reactor depends on the volume of the reactor and the capital cost of the generator depends on electricity generation. The capital cost of the generator unit is calculated for a 1200 kWel biogas plant.
Direct and indirect fixed capital investment
Fixed capital investment is the capital that is needed to supply the manufacturing and plant facilities for AD plant. Fixed capital investment is divided into manufacturing fixed capital investment (direct costs) and nonmanufacturing fixed capital investment (indirect costs). Manufacturing fixed capital investment includes the capital necessary for purchasing the equipment needed and installation of them for complete process operation. Other expenses included are piping, instruments, insulation, foundations, and site preparation (Peters, et al., 2003; Budzianowski & Budzianowska, 2015). Non-manufacturing fixed capital investment includes the
1 (Kurniawati et al., 2014)
2 (Kiran, et al 2014; Tang, et al 2008)
3 (Kurniawati et al., 2014)
Feedstock characteristics Value
Amount of food waste 120 tonne1
Total solid 19.7%2
Total solid amount 24.44 tonne
Volatile solid 95.4%3
Volatile solid amount 22.36 tonne
Inflow of daily diluted
feedstock 237.6 m
3 per day
Volatile solid
concentration 94 kg VS per m
expenses required for construction overhead and for all the components that are not directly related to the AD process operation (Peters et al., 2003).
A more detailed breakdown of the capital investment needed for the anaerobic digestion plant system is presented in table 4.3 and adapted from the book “Plant design and economics for chemical engineers” by Max S. Peters et al. (2003) and from the Budzianowski & Budzianowska study (2015).
This study uses a combination of the book’s method of capital cost estimation and estimated capital cost from real case plants mentioned in the Budzianowski & Budzianowska study. The method from the book used here is called study estimate which is based on knowledge of major items of equipment. In this study the major equipment is the purchased equipment needed for each option.
Table 4.3 Breakdown of fixed-capital investment items for biogas plant process (Peters et al., 2003; Couper and Roy Penny 2009; Budzianowski & Budzianowska, 2015)
Expenditure Items
Purchased equipment
(PEC) Anaerobic digester Generator
Purchased-equipment
installation Installation of all equipment
Piping to households
Land Property: Near the landfill
Building and logistic
infrastructure Process buildings Auxiliary buildings
Service facilities Utilities
Facilities
Non-process equipment Distribution and packaging
Others Permissions, management, etc.
O&M
Operation and maintenance include the costs for sorting the household waste into food waste, operating labor and the cost for maintenance and repairs.
Assuming that for every two tonnes there is needed one employee at the TPS collection points to separate food waste from household waste. Because there is around 440 tons of daily produced household waste there will be needed 220 employees for the separation of waste.
The operating labor needed for operating the AD plant is around 50 employees (Peter, et. al, 2003). Operating labor cost is calculated by using the following equation:
Coperating labor= nemployees∗ saverage salary Equation 5
Where:
Coperating labor is the cost of separation of food waste
nemployees is the number of employees needed
saverage salary is the average salary in the region of Kartamantul, which is 150 USD/month
In the case of maintenance and repairs the annual costs for equipment maintenance and repairs is estimated to be 5% of the fixed-capital investment (Zamalloa & Vulsteke, 2011).
Net present value (NPV)
Net present value is the difference between the present value of income and the present value of operation and maintenance costs. It is used to analyze the profitability of a project.
R N
Where,
i is the discount rate used in Indonesia N is the number of periods presented in years
Rt is the cash flow in year t presented in USD
Payback period (PB)
This method presents the number of years needed to recover the investment costs. It is calculated by using equation by dividing the initial investment cost (PC) on the estimated annual cash flows (R).
PB =PCR Equation 7
Internal rate of return (IRR)
The internal rate of return is the discount rate at which the NPV is zero.
IRR = NPV = ∑ Rt
(1+i)t
N
t=0 = 0 Equation 8
Breakeven analysis
The breakeven shows what price is needed to cover the total capital costs and O&M costs within the lifespan presented.
Estimation of selling biogas for cooking
The 3 kg of LPG container is subsidized by the government, which makes it very cheap to buy. However in the calculations for the biogas price, it is assumed that the price is as equal as the LPG price with equivalent energy when no subsidization is implemented from the government. This is equivalent to the 12 kg LPG container. All biogas are transported via gas pipes installed to residential buildings and commercial buildings. Biogas is sent by PVC pipes with grade 1 quality of the smallest diameter founded in the market.
To calculate the biogas to cooking price the following equation is used:
PBFC= PLPG per θ Equation 9
PBFC is the biogas to cooking price USD per m3
PLPG is the LPG price USD per kg
θ is the volume equivalence of biogas to LPG m3 per kg
Data
The prices of filling containers with LPG taken from interviewing supermarket owners (2017) in the region of Kartamantul are presented in table 4.4.
Table 4.4 Filling LPG containers prices (Warun 2017, personal communcation, May 3)
LPG containers Filling Value
(USD)
3 kg 1.5
5.5 kg 4.5
12 kg 10
The data used for calculating the biogas for cooking price is presented in table 4.5.
Table 4.5Data used for calculating the biogas for cooking price (Wang, Lee and Molburg 2004)
LPG price (𝐏𝐏𝐋𝐋𝐏𝐏𝐋𝐋) 0.834 USD per kg LPG
LPG energy content 13.65 kWh per kg
Biogas energy content 6.256 kWh per m3
Biogas to LPG equivalence (𝛉𝛉) 2.18 m3 biogas per kg LPG
4.5 Environmental Analysis
MethodTo make an environmental analysis the following cases are chosen and validated by the interviews made with Agus Prasetya (2017).
These cases used for comparison of emissions are the following: Current condition of landfilling food waste
The waste is unloaded at the Piyungan landfill where the organic material is decomposed into methane and carbon dioxide. Assuming that the landfill gas is equivalent to the biogas compositions of methane and carbon dioxide. To calculate the gases produced the following equations are used:
VCH4= Vbiogas∗ σCH4 Equation 10
VCO2 = Vbiogas∗ σCO2 Equation 11
Where:
σCH4 is the percentage of methane in the landfill gas.
σCO2 is the percentage of carbon dioxide in the landfill gas.
Biogas to electricity or cooking
According to the combustion reaction of methane that one cubic meter of carbon dioxide is generated for each
one cubic meter of methane (Eurotron, 2006). However the carbon dioxide produced with biogas is CO2
-neutral.
CH4+ 2O2→ CO2+ 2H2O + Heat Equation 12
Hard coal to electricity
In the region of Kartamantul the common fuel for production of electricity is hard coal, which is why this case is chosen to compare with biogas to electricity.
Using LPG for cooking
In the region of Kartamantul the common fuel for cooking is LPG, which is why this case is chosen to compare with biogas to cooking.
Data
Table 3.2 shows the biogas composition of methane is equal to 65 % while for carbon dioxide is 35 %. Table 4.6 gives the emission factor of alternative fuels and landfilling of food waste.
Table 4.6 Emission factor of alternative Fuels and landfilling of food waste (Quaschning, 2015) Emission factor Unit
4(Warun 2017, personal communcation, May 3; Equation 9)
LPG (𝛗𝛗𝐂𝐂𝐎𝐎𝟐𝟐 𝑳𝑳𝑳𝑳𝑳𝑳) 0.237 kg CO2 per
kWh
LPG (𝛗𝛗𝐍𝐍𝐎𝐎𝐱𝐱 𝑳𝑳𝑳𝑳𝑳𝑳) 0.0068 kg NOx per
kWh
Hard coal (𝛗𝛗𝐂𝐂𝐎𝐎𝟐𝟐 𝑯𝑯𝑯𝑯𝑯𝑯𝑯𝑯 𝒄𝒄𝒄𝒄𝑯𝑯𝒄𝒄) 0.349 kg CO2 per
kWh
Hard coal (𝛗𝛗𝐍𝐍𝐎𝐎𝐗𝐗 𝑯𝑯𝑯𝑯𝑯𝑯𝑯𝑯 𝒄𝒄𝒄𝒄𝑯𝑯𝒄𝒄) 0.002410 kg NOx per
kWh
Landfilling of food waste 0,10 kg CO2 per
kWh
Biogas to electricity 0.2911 kg CO2 per
kWh
Biogas to cooking 0.29 kg CO2 per
kWh Table 4.7 gives the data needed to calculate the CO2eq of each GHG.
Table 4.7 CO2-eq of each GHG (ClimateChangeConnenction, 2017) Specific CO2eq CO2 1 CH4 25 N2O 286