An initial study on
external warning
signals for Quiet
Road Transport
Vehicles
PAPER WITHIN Master thesis project
AUTHOR: Isabel Hwang
TUTORS:Johan Ekbäck and Lennart Mähler
Postadress: Besöksadress: Telefon:
Box 1026 Gjuterigatan 5 036-10 10 00 (vx)
Engineering. The work is a part of the Master of Science programme.
The authors take full responsibility for opinions, conclusions and
findings presented.
Examiner: Roland Stolt
Supervisors
:
Johan Ekbäck, CEVT AB
Lennart Mähler, Jönköping University
Scope: 30 credits
Abstract
The increasing number of electric and hybrid vehicles in urban areas has shown to be beneficial in reducing both air and noise pollution. However, the lack of sound when driving at low speed has negatively affected the pedestrian safety since many rely on the vehicle sound for orientation. Regulatory bodies have therefore introduced minimum sound requirements for all silent vehicles, which has resulted in a key challenge for car manufacturers to develop external warning signature sounds. The objective of this project has been to study how these signals should sound in order to fit the image of electric and hybrid vehicles and minimize noise and annoyance. To complete the study, five sound concepts with different characteristics and rhythms were developed using the concept generation process. In order to gain subjective impressions of the sounds, three measurement methods were utilized. The first listening test was performed to eliminate the possibility that the sound samples would be perceived variously loud in the upcoming tests. The second listening test was performed to gain information on how suitable the signals are for electric and hybrid vehicles, and the third listening test was conducted to obtain information on how much annoyance the signals contributed with. A reference signal representing an internal combustion engine was included in the tests as well.
The results of the measurement methods showed that the sound samples with long tone sequences were more preferred than those with short tone sequences, and that the artificial approach was more popular than the sound of an internal combustion engine vehicle. It was also established that additional tests need to be performed in order to confirm that these results are valid. It was suggested that field tests should be conducted and that new sound concepts should be developed based on the results of these tests.
Keywords
Quiet Road Transport Vehicles, Acoustic Vehicle Alerting System, External warning signals, Sound quality, Product sound design, Measurement methods, Psychoacoustics.
Contents
1
Introduction ... 4
1.1
BACKGROUND ... 4
1.2
OBJECTIVE AND RESEARCH QUESTIONS ... 4
1.3
DELIMITATIONS ... 4
1.4
OUTLINE ... 5
2
Theoretical background ... 6
2.1
QUIET ROAD TRANSPORT VEHICLES ... 6
2.1.1
REGULATIONS ... 6
2.2
HUMAN HEARING AND PERCEPTION OF SOUND ... 7
2.3
CONCEPT DEVELOPMENT PROCESS ... 11
2.4
MEASUREMENT METHODS ... 13
3
Method and implementation ... 17
3.1
CONCEPT DEVELOPMENT PROCESS ... 17
3.2
MEASUREMENT METHODS ... 20
4
Result and analysis ... 25
4.1
RESULT ... 25
4.2
ANALYSIS ... 28
5
Discussion and conclusions ... 29
5.1
DISCUSSION OF METHOD ... 29
5.2
DISCUSSION OF FINDINGS ... 30
5.3
CONCLUSIONS AND FUTURE WORK ... 30
6
References ... 32
7
Appendices ... 35
7.1
CONCEPT GENERATION ... 36
7.2
CONCEPT COMBINATION TABLE ... 37
7.3
INSTRUCTIONS TEST METHODS ... 38
1
Introduction
The current chapter gives an understanding of the subject of this study, the background and purpose as well as delimitations and the outline of the report.
1.1 Background
Electric and hybrid vehicles have been recognized as a promising transportation solution to reduce fuel consumption and reduce greenhouse gas without sacrificing performance or safety [1]. The development of alternative energy vehicles has also shown to be beneficial in reducing noise pollution since these vehicles are designed to operate using electric propulsion systems [2]. However, the absent of audio cues have become an issue for other road users to travel safely. Particularly vulnerable are blind and visually impaired persons as these rely on the traffic sound for orientation. As a consequence, regulatory authorities have introduced minimum sound requirements for all silent vehicles [2]. This has resulted in a key challenge for vehicle manufacturers to develop suitable warning sound signatures that can alert pedestrians and cyclists without contributing to noise and annoyance. In order to construct these external warning signals, an understanding of human impression of sound is essential. However, as this is a relatively new topic, the amount of research made on the subject is limited.
1.2 Objective and research questions
This project is conducted as an initial study for the automotive company China Euro Vehicle Technology AB (CEVT AB). The objective is to develop external warning signals for electric and hybrid vehicles and perform measurement methods to determine how these signals should sound in order to enhance pedestrian safety while minimizing the disadvantages of noise and annoyance.
With regard to the result of the measurement methods the following research question has been formulated:
• How should external warning signals for electric and hybrid vehicles sound to alert vulnerable road users without contributing to noise pollution?
1.3 Delimitations
The main focus of this study will be allocated to the development of sounds and the measurement methods. Due to time restriction this project will be conducted with the following simplifications and limitations:
• The result is limited to a subjective approach as the development process will be carried out from a human design perspective.
• The position of the speaker(s) will not be taken into consideration when performing the measurement methods.
• This study will only follow the requirements covered by the United Nation Economic Commission of Europe (UNECE) regulation.
1.4 Outline
Chapter 1 presents a brief introduction to clarify the background, objective and research question of this study.
Chapter 2 presents a literature review of the most important aspects of this study. The chapter is divided into four sections and has its main focus on electric and hybrid vehicles and sound design.
Chapter 3 presents a thorough description of how the work has been implemented and which methods that have been utilized.
Chapter 4 presents the result of this study and an analysis of the findings.
Chapter 5 presents a discussion of the chosen methods and a discussion of the results and findings. Included in the chapter are also a conclusion and ideas on how to proceed the work in the future.
2
Theoretical background
The current chapter includes a theoretical review of this study. The material has been collected to give an understanding of the subject and the methods chosen for the project.
2.1 Quiet Road Transport Vehicles
Electric and hybrid vehicles are usually referred to as Quiet Road Transport Vehicles (QRTV) since the electric propulsion system makes the vehicles so quiet when driving at low speed [2]. Although this may be viewed as a benefit for some, a risk to safety exists for those who rely on the engine noise for localization.
The vehicle sound from an internal combustion engine car comes from the vehicle’s power train, tires and aerodynamics [3]. The engine sound is predominated at low speed whereas tire and aerodynamic sound are prominent at higher sped. The vehicle sound from electric and hybrid cars comes however exclusively from tires and aerodynamic, which means that these vehicles can be capable of very quiet operation at low speed maneuvers [2]. Although it is important to reduce noise pollution, it has been shown that pedestrians benefit from hearing sound from traffic activity, including vehicles and audible signals [3]. Particularly vulnerable are blind and visually impaired persons as these rely on the engine sound to help detect the presence, location and behavior of a vehicle.
The reduction of sound emitted by quiet road transport vehicles could also affect the driver’s awareness of speed [4]. Louder sound from a vehicle’s internal combustion engine is usually indicative of faster speed and research has shown that driving performance is reduced when motor loudness is not matched to vehicle acceleration and in complex driving tasks, e.g. shifting gears.
2.1.1 Regulations
To address the issue with quiet road transport vehicles, regulatory authorities have voted to make Acoustic Vehicle Altering Systems (AVAS) mandatory for all electric and hybrid cars [5]. An Acoustic Vehicle Alerting System can be described as a sound module system that generates sound to signal the presence and behavior of silent vehicles in order to enhance the safety of vulnerable road users.
The requirements that the sound shall comply with varies with different regulations [5, 6, 7]. In writing, three regulations concerning AVAS have been approved and these have been elaborated by the European Union (EU), China Automotive Technology and Research Center (CATARC) and the United Nation Economic Commission of Europe. This study focuses on the regulation specified by the UNECE due to its large number of contracting countries.
United Nation Economic Commission of Europe
The United Nation Economic Commission of Europe is one of five regional commissions of the United Nations [8]. The UNECE World Forum for Harmonization of Vehicle Regulations started working with the development of
framework of the Working Party on Noise (GRB). The QRTV regulation was approved in 2016 and was adopted under the 1958 Agreement, in which 50 contracting parties are included. It applies to electrified cars that can travel in normal mode, in reverse or at least one forward drive gear, without an internal combustion engine operating in respect to its audibility [7].
Included in the regulation are specifications concerning minimum sound pressure levels, stationary sound and frequency shift to signify acceleration and deceleration [7]. It also includes specifications for acoustic characteristics, stating that the speed range for operation of AVAS shall be during reversing and in the range greater than 0 km/h up to and inclusive 20 km/h. To provide for environmental protection, the regulation also specifies a maximum overall sound limit of 75 dB(A), measured at a distance of 2 meter [9]. This sound level should be quiet enough to protect against noise pollution but loud enough to provide a warning to road users. The minimum sound pressure level requirements are listed below, measured at a distance of 7.5 meter [7]:
• For reversing: 47 dB(A) • For 10 km/h: 50 dB(A) • For 20 km/h: 56 dB(A)
2.2 Human hearing and perception of sound
An understanding of human auditory capabilities and limitations is essential for sound design and evaluation issues related to the perception of sound quality [10]. This chapter is therefore focused on the basics of the human auditory system, psychoacoustics and sound quality.
Human auditory system
The human auditory system constitutes the combination of two ears and one brain, creating a bio-mechanical system that converts vibration of objects into sounds [11]. Already in the embryonic phase, the human brain develops preferences for rhythm, patterns and word recognition in order to train the auditory system to be as effective as possible. The connecting point that is linking the nervous system inputs and outputs, such as audio and vision as well as muscle control, to the other areas of the brain is the brain stem. When the brainstem receives information of incoming audio signals, it first feeds back commands to the middle ear’s muscles and the inner ear’s outer hair cells to optimize hearing in real time before it converts it to sound.
The hearing threshold of normal hearing persons is illustrated in Figure 1 [12]. Each equal loudness contour indicates combinations of levels and frequencies that are perceived as equally loud for pure tones. From the figure it is possible to see that at lower and higher frequencies, the sound pressure level needs to be much higher for the sound to be heard.
If hair cells are exposed to high sound pressure levels for long times, or extremely high sound pressure levels for a short time, the hairs will damage or even break off [11]. This causes inabilities to hear certain frequencies, which also happens with increasing age when the hair cells at the beginning of the basilar membrane in the inner ear die. The average hearing threshold of age-related hearing loss can be seen in Figure 2 [12]. Looking at the figure it is possible to see that in order for elderly persons to hear a sound, it needs to have its essential frequency components lower than 1-2 kHz.
Psychoacoustics
Psychoacoustics is the scientific field of choice to bridge the gap between physical quantities of sound and subjective hearing impressions [13]. The psychoacoustic parameters related to this study include loudness, pitch and localization.
A sound is created when acoustic audio waves are impressed upon a medium such as air or water, reaching the human ear and the central auditory nervous system in the human brain [11]. One of the simplest types of sound is the sine wave, also known as a sinusoid [14]. The sinusoid is described by the number of times per second the waveform repeats itself, called frequency; the amplitude, which is the value of sound pressure at a given time; and the phase, which corresponds to the portion of the cycle through which the wave has advanced in relation to some fixed point in time. Sounds that are encountered in everyday life, such as those produced by musical instruments and certain speech sounds are also repeated regularly but are generally more complex than sinusoids. One common subjective characteristic that all sounds share is the variation in pitch. Pitch is one of four basic parameters of hearing sensation and it is directly related to frequency. A sound wave with a high frequency produces the sensation of a high, sharp pitch and sound of a low frequency produces a low, dull pitch [15]. A low, dull pitch, with a frequency range between 10 to 200 Hz has been identified as a special environmental noise problem as it has the ability to spread widely both indoors and outdoors.
Another dimension of human psychological sensation of sound is loudness [11]. Loudness is a subjective response to the amplitude of sound, describing the individually perceived level of hearing sensation with the unit ‘sone’ [16]. In the
Figure 2 - Average hearing threshold for different age groups (males) according to ISO 7029 [12].
physical world, acoustic loudness is defined as sound pressure level and is quantified in decibels, dB [15]. The relationship between perceived loudness and the physical acoustic pressure of sound is non-linear in both amplitude and frequency, meaning that the relative loudness and detectability of two sounds with the same sound pressure level value can change substantially depending on the amplitude and frequency. To adjust the measurement of loudness sounds to more accurately reflect the human hearing an A-weighted filter can be used. Figure 3 illustrates a loudness-thermometer that shows the sone-values and the A-weighted values of the same sounds [17]. However, in situations when one sound interferes with the perception of another, also referred to as masking, the overall A-weighted sound pressure level cannot be predicted [18]. This is common in road-traffic situations when collective background noise overshadows the signal from nearby vehicles. The ability to localize sound sources is of considerable importance as it determines the direction of object to seek or to avoid and indicates the appropriate direction to direct visual attention [14].
Sound quality
Sound quality can be defined as how users perceive the quality of sounds of industrial objects and establishes specifications for the design of these sounds [19]. According to Guski, there are three approaches to the the psychological side of sound quality; suitability, pleasantness of sounds and indefinability of sounds or sounds sources.
The first aspect of sound quality can be defined as the suitability of a sound for a special product [19]. For example, the sound of a coffee machine should either be reduced to a zero sound level, because it has to inform the user about the running status of the machine. It should neither be increased to a maximum because it hinders communication between the persons who make coffee. The second aspect of sound quality refers to the evaluation of a sound with respect to its pleasantness and unpleasantness, or to its annoyance. Individual attributes observed to influence annoyance include age, mood, level of education and cultural background [10]. Other influencing attributes can be the familiarity of a certain sound and the expectations of a sound [20].
The third aspect of sound quality refers to cognitive influences, which include factors related to the sound source, e.g. image of the source, whether it is a sports car of a family car, factors related to the situation in which the product emitting the sound is used, and factors related to the person using the product, e.g. expectation [21].
2.3 Concept development process
Concept development is one of the initial phases in the product development process and can be utilized for physical products as well as sound design [22]. The method is according to Karl T. Ulrich and Steven D. Eppinger, a seven-step process that begins with identifying needs of the target market and results with a set of concepts that are selected for further development (see Figure 4). The first five steps used in this study are explained in detail below.
Identifying customer needs
To ensure that the product is focused on the customer, the process of concept development starts with understanding the expectations of the customers in the target market [22]. The raw data collected from the focus group are interpreted into needs and expressed as written statements, which later are organized in a hierarchical list to find the importance weightings of all needs.
When interpreting the raw data in terms of customer needs, there are five guidelines that can be followed [22]. The first two guidelines are fundamental and critical to effective translation and the remaining three guidelines ensure consistency of phrasing and style across the development team.
• Express the need in terms of what the product has to do, not in terms of how it might do it.
• Express the need at the same level of detail as the raw data to avoid loss of information.
• Express the need with a positive phrasing.
Identify
customer needs Establish target specifications
Generate product concepts
Select product
concepts Test product concepts specficationsSet final
Plan downstream development
• Express the need as an attribute of the product. • Avoid the words must and should.
Establishing target specifications
The target specifications are established after the customer needs have been identified but before product concepts have been generated, representing the hopes and aspirations of the product development team [22]. The specifications are the translation of customer needs into technical terms, providing a precise description of what the product has to do.
A specification consists of a metric and a value, where the values always are labeled with the appropriate units [22]. In some cases, needs cannot be translated into quantified metrics and are therefore repeated as specifications and noted to be subjective. These metrics are then later evaluated by a panel of customers.
Concept generation
A product concept is an approximate description of the technology, working principles and form of the product [22]. It is a concise description of how the product will satisfy the customer needs. In this stage, the customer needs and target specifications collected from the earlier steps are converted into concepts. A good concept generation assures that the full space of alternatives has been explored, which will greatly reduce the likelihood that some customer needs will not be fulfilled.
In order to help individuals in the idea generation process, methods to stimulate creative thoughts have been developed [23]. One approach is to use personal knowledge within the company to generate solution concepts, meaning that all of the ideas are created from knowledge already in the possession of the firm [22]. An example of an internal idea generation technique is the brainwriting method 6-3-5, which involves silently writing and sharing ideas in groups [24]. Other examples of concept generation techniques are mindmapping, morphological analysis and brainstorming [22].
Four useful guidelines for improving the creativity are: • Suspend judgment
• Focus on quantity
• Welcome ideas that may seem infeasible • Use graphical and physical media
After collecting a big amount of solutions, a systematic exploration can be used to navigate the space of possibilities by considering combinations of all of these solutions [22]. Concept combination table is a tool where potential solutions to the overall problem are formed by combining one idea with another. The combinations may not even be possible or may lead to more than one solution but the goal of the method is to involve additional creative thoughts. In order to make the process easier, the fragments that are considered to be infeasible should be eliminated before combining it with other fragments to reduce the number of combinations.
Concept selection
Concept selection is the process in which various product concepts are analyzed and successively eliminated to identify the most promising concepts [22]. The concept selection activity evaluates concepts with respect to customer needs and other relevant criteria, comparing the relative strengths and weaknesses and selecting one or more concepts for further testing and development.
Even if the concept selection process is a method for narrowing down the set of ideas to a smaller set, it is frequently iterative and helps to combine and improve the concepts to temporarily enlarge the set of ideas under consideration [22]. Through several iterations one or many dominant concepts are finally chosen. Whether or not the concept selection is explicit, at least one method is used to choose among the concepts. The methods vary in effectiveness and include the following:
• External decision: The concept selection is made by the customers, clients, or some other external entity.
• Product champion: An influential person that has been following the product development process chooses concepts based on personal preference.
• Intuition: The selection of concepts is made based on intuition – the concepts feel right. Explicit criteria or trade-offs are not used.
• Multivoting: A group of people involved in the product development process votes for several concepts and the concepts with the most votes are selected. • Web-based survey: Each concept is rated by many people using an online
survey tool.
• Pros and cons: Strengths and weaknesses are listed for each concept and the product development team makes a choice based upon the group opinion. • Prototype and test: The organization builds and tests prototypes of each
concept, making a selection based upon test data.
• Decision matrices: Each concept is rated against pre-specified selection criteria, which may be weighted.
Concept testing
When the final concepts have been selected, the next step is to verify that the customer needs have been met, assess the market potential of the product and identify how to improve the concepts for further development [22]. This type of testing is based on data gathered directly from potential customers. The test methods used for this study is presented in the following chapter.
2.4 Measurement methods
An important part of sound quality is to measure the subjective perceptions of sound via listening tests. The measurement methods presented in this chapter are developed to address external warning signals for electric and hybrid vehicles. The test methods are focused on the three main characteristics audibility, suitability and annoyance.
The audibility test follows the main principles of the triangle test defined in ISO 4120, which is used for determining whether a perceptible sensory difference exists between samples of two products [25].
The objective of the measurement method is to find the A-weighted sound pressure level of the warning signals, i.e. the sound pressure level that reflects the human hearing, so that the signals can be perceived equally loud as an internal combustion engine vehicle [12]. The sound levels calculated from the audibility test will be used for both the suitability test and the annoyance test.
The test is divided into a number of test rounds (one for each warning signal), in which each test round consists of a block [12]. The block has a set of combinations in which each combination consists of three samples, i.e. a triad. Two of the samples are alike and one is different, hence the task is to identify which sample that is different from the other two. The block of combinations is shown in Table 1. Sample A consists of the warning signal together with a background noise and sample B consists of the background noise only. The background noise should reflect the sound of urban areas and is used to make sure that the signals are not masked by ambient sound.
Table 1 - The block of combinations.
Block
Combinations ABB BAB BBA BAA ABA AAB
In addition to the warning signals, a reference signal representing an internal combustion vehicle shall be included in the test [12]. Each signal shall reflect the speed of 10 km/h and shall be low pass filtered at 2 kHz. The recommended frequency variation for 10 km/h is between 400 to 500 Hz.
In order to find the A-weighted sound pressure level for each signal, a number of sound levels shall be tested [12]. A preliminary threshold level shall be found for each warning signal by adjusting the sound level of the signal so it is deemed just audible over the background noise. This gives the participants a 50 % probability to hear the signal together with the background noise. The recommended sound levels to test are +9, +6, +3, +0, -3, -6 and -9 dB relative to the preliminary threshold level of the warning signal. The first block shall be performed with the loudest signal and the succeeding blocks should be performed with the decreasing sound levels. The order of the triads shall be randomized from block to block and from one listener to another. Each sound sample should have a duration of at least 5 seconds and a total of ten normal hearing assessors should be recruited for the test.
When the result of the measurement method has been collected, the A-weighted sound pressure level is calculated for each warning signal [12]. First, the correct number of answers for each listener i, in each block j, are counted. The percentage of correct answers, Pcij in a block is calculated from the following general formula:
𝑃𝑐#$= 𝑁𝑐#$ 6 ∗ 100
Where Ncij is the number of correct answers and 6 is the number of combinations in
each block.
From the percentage correct answers, the detection probability for each signal level and for each listener is calculated. Due to random variations, negative numbers may appear [12]. The detection probability can be estimated as:
𝑃𝑑#$ = 1.5 ∗ 𝑃𝑐#$− 50
Furthermore, the average values for all listeners per signal level are calculated [12]. The relationship between the signal level and the probability detection is assumed to be logarithmic. This result may be linearized by transforming it with the logit function:
𝐿𝑜𝑔𝑖𝑡 𝑃𝑑#$ = ln (𝑃𝑑#$ (100 − 𝑃𝑑#$))
The next step is to calculate the sound pressure level relative to the preliminary threshold level ΔL(Pd) [12]. This can be referred to as the 50 % detection threshold and can be found with the following formula:
∆𝐿 𝑃𝑑 = − 𝑏 𝑎 [dB relative to the preliminary threshold level] Where a and b are constants for the line y = ax + b.
Further, the A-weighted sound level of a warning signal Ls(Pd) in a simplified
background noise is found from [12]:
𝐿< 𝑃𝑑 = 𝐿𝑝<+ ∆𝐿(𝑃𝑑)
Where Lps is the preliminary threshold level for a warning signal.
To find the A-weighted sound pressure level that gives the same audibility as an internal combustion engine car, i.e. the equal Audibility Level as an Internal Combustion Engine, dBALICE, the following formula is used [12]:
𝑑𝐵@ABCD = 𝐿𝑝E− (𝐿<E− 𝐿<)
Where Lpr is the A-weighted sound pressure level of an internal combustion engine
vehicle driving with a speed of 10 km/h and Lsr is the A-weighted sound level of the reference signal.
The measurement uncertainty is estimated to be of the magnitude +/- 2 dB [12]. Suitability and annoyance tests
The suitability and annoyance test follows the main principles of the Multi Stimulus test with Hidden Reference and Anchor (MUSHRA) defined by ITU-R recommendation BS.1534-1 [26].
The objective of the two test methods is to find subjective assessments of how suitable the warning signals are for electric and hybrid vehicles, and how much environmental annoyance the signals are contributing with [12]. As clusters of persons with different preferences and reactions to noise may exist, a large number of listeners with normal hearing should be recruited for each test method.
(2)
(3)
(4)
(5)
The signals should be presented to the listener with the A-weighted sound pressure levels that gives the same audibility as an internal combustion engine vehicle, dBALICE
[12]. The sound samples shall be randomized from listener to listener and each sample should have a duration of at least 15 seconds. The mean values and confidence intervals shall be computed when the result of the tests have been collected and the difference between the suitability and annoyance assessments is used as the final test result.
3
Method and implementation
The current chapter presents what methods have been utilized and a description of how the work has been implemented and why.
3.1 Concept development process
The concept development process was conducted to create external warning signals and to ensure that the result of the sound concepts was focusing on the requirements of the customers.
Identifying customer needs
To identify customer expectations on the product, interviews were conducted with customers and several potential consumers. The raw data collected from the interviews were interpreted into customer needs by following the guidelines stated in chapter 2.3.
The needs are listed below in a hierarchical order: • The warning signal is easy to hear
• The warning signal indicates the behavior of the vehicle • The warning signal is harmonized with the environment • The warning signal is suitable for electric and hybrid vehicles • The warning signal is original and unique
Establishing target specifications
After identifying the customer needs, the needs were translated into metrics in order to provide a precise description of what the product has to do. Each metric was specified with a unit, a target value and rated from 1 to 5 based on its importance (see Table 2). The values in the list of metrics are based on the theoretical background and the metrics that could not be quantified were given the unit ‘subjective’.
Table 2 – List of metrics for the warning signal.
Concept generation
Based on the customer needs and the target specifications, a set of product concepts was generated using the brainwriting method 6-3-5 and a concept combination table. The focus for the 6-3-5 method was to generate a big amount of ideas of different types of sounds using the guidelines stated in chapter 2.3. A team of five employees from the company with the titles test engineer, project manager, software engineer,
Metric Imp. Unit Value
Maximum audibility of the warning signal 5 Hz 200-1000 Indication of the behavior of the vehicle 5 dB(A) 47-56
Minimal annoyance of the warning signal 4 Subj. -
Maximum suitability of electric and hybrid vehicles 2 Subj. - Originality and uniqueness of the warning signal 1 Subj. -
task leader and system manager participated in the workshop. Each participant had to write or sketch at least three ideas every five minutes. After each five-minute round, the concepts were passed round to the adjacent participant, giving the team the opportunity to draw on each other’s ideas for inspiration. The idea generation method resulted in a total of 82 unique concepts. A selection of the ideas has been collected in a mindmap illustrated in Figure 5, and the remaining concepts can be seen in Appendix 1.
To navigate the space of possibilities, a systematic exploration was carried out using a concept combination table. The generated ideas from the internal search were organized into subcategories in order to find a wide variety of combinations (see Appendix 2). The solutions were formed by combining one fragment from different columns, creating unique sounds with diverse characteristics. Ideas that were too similar to one another were eliminated before starting the exploration process to reduce the number of arrangements.
A total of 12 combinations were created and the result of the activity is shown in the list below:
• Traditional ICE + Electric sparkle + Wave + Phone vibration • Sleigh + Bees + Phone vibration + Drilling machine
• T-Ford + Bird song + Heart beat + Rain • Train + Bird song + Breeze + Flute • Forest + Classical music
• Jet plane + Jungle + Downhill skiing + Coffee machine • Bike + Singing + 2000 Space odyssey + Vacuum cleaner • Boat + Screaming monkey + Drums + Saw
• Cricket + Guitar + Rain + Sleigh • Laughter + Frog + Clock + Star Wars Concept selection
The concept selection process was carried out using the selection method ‘product champion’. Because sounds are based on subjective sensations, the selection criteria would have been difficult to state using decision matrices for example. The evaluation of the concepts was conducted with respect to the customer needs, the measurement methods and the research question stated in chapter 1.2. The target was to find concepts that differ in rhythm and characteristic, and that could work with the design of the listening tests.
The chosen signals were:
• Future: Train + Bird song + Breeze + Flute • Music: Forest + Classical music
• Space: Star ship + Bee + Ping Pong + Star Wars
• Electric: Traditional ICE car + Wave + Electric sparkle + Phone vibration • Nature: Cricket + Guitar + Rain + Sleigh
Concept development
When the concept selection process had been finalized, sound samples were created using the music software GarageBand.
Since the sound samples are meant to alert road users, it was important to create signals that would give the proper amount of attention to pedestrians and cyclists without being annoying or causing unnecessarily dangerous levels of distraction. For example, a signal that repeats itself with small intervals are usually perceived as highly urgent but can at the same time be vastly annoying. Also, since the warning signals were going to be developed for electric and hybrid vehicles, it was important to find sounds that could fit the image of these vehicles.
To create the sound samples, synthetic instruments and effects of the software were used. The process of developing the warning signals underwent many design iterations in order to find sounds with different characteristics and rhythms. The five final signals were created with an artificial approach and are described in Table 3. All signals were low pass filtered to 2 kHz and with a frequency of 420 Hz to represent a constant speed of 10 km/h. The resolution of the sound samples was set to 16 bit.
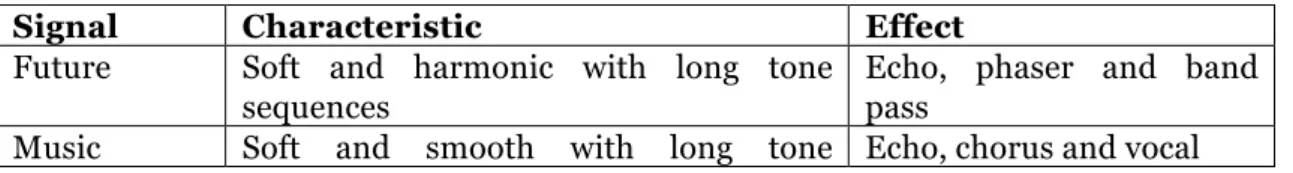
Table 3 - Sound characteristics explained with words.
Signal Characteristic Effect
Future Soft and harmonic with long tone sequences
Echo, phaser and band pass
sequences transformer Space Sharp pitch and rough with short tone
sequences
Echo and phaser Electric Sharp pitch and electric with short tone
sequences
Echo, flanger and track echo
Nature Soft and electric with long tone sequences
Echo and nature sound
3.2 Measurement methods
The final step of the concept development process was to test the concepts to measure the subjective perception of the signals. The tests were carried out for four days in a music studio at Jönköping University in April, 2016.
In addition to the five sound samples presented in the previous chapter, a reference signal was included in the tests as well. The reference signal represented a Mitsubishi Colt 2010 ClearTec 1.3 and was low pass filtered at 2 kHz with an internal combustion engine at 1160 rpm, which corresponds to a speed of 10 km/h driving with 1’st gear [12].
A total of 48 assessors were recruited to the tests. The participants were mainly engineering students and professors aged from 19 to 60. Each test was conducted one by one over calibrated Urbanear Plattan headphones, using a Macbook Air 2012 and software from SenseLabOnline. All participants were given a short oral background description of the objective of the study, as well as written instructions of the tasks (see Appendix 3). The order of the sound samples was randomized and all signals could be looped during the presentation.
Audibility test
The goal of the audibility test was to find the A-weighted sound pressure level for each signal and ascertain that the warning signals are perceived equally loud as an internal combustion engine vehicle.
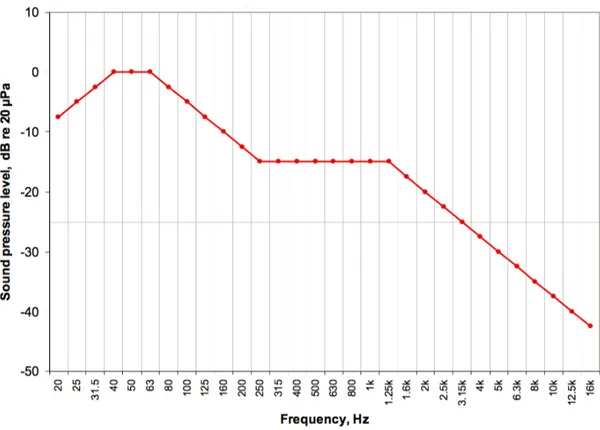
The simplified background noise included in the test was a pink noise signal (the power per hertz is inversely proportional to the frequency) that has been frequency weighted according to Figure 6 [12]. The weighting curve has been constructed to fit the average spectrum of background noise measured in a number of parking lots in city and suburb environments in Denmark. The background noise was played back with an A-weighted sound pressure level of 55 dB.
A total of six assessors participated in the audibility test. The age distribution is shown in Table 4. Three different sound levels of +6 dB, +0 dB and -6 dB relative to the preliminary threshold level were tested for each warning signal, resulting in a total of 108 test rounds. Each sample sound was 10 seconds long.
Table 4 - Age and quantity of the assessors of the audibility test.
Age < 20 21 – 30 31 – 40 41 – 50 51 – 60 > 60
Quantity 1 5 0 0 0 0
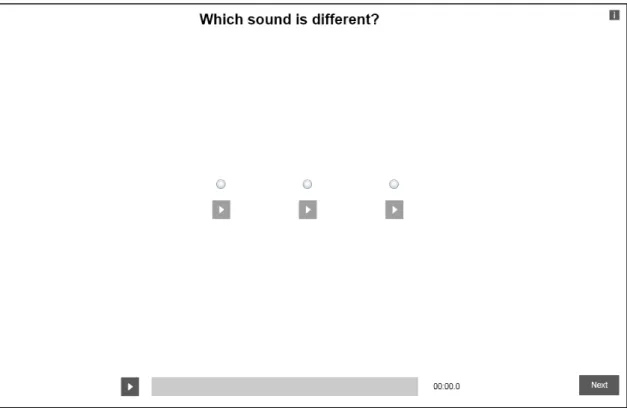
The listeners were given the task to choose which sound that was different from the other two using the graphical user interface illustrated in Figure 7. When all participants had completed the test, the A-weighted sound pressure level and the dBALICE were calculated. The sound level of the reference car Lpr, was set to 50 dB(A),
which represents a constant speed of 10 km/h according to the UNECE regulation.
Suitability test
The goal of the suitability test was to find out how external warning signals for electric and hybrid cars should sound to fit the image of the product. A total of 21 assessors participated in the test and the age distribution is shown in Table 5.
Table 5 - Age and quantity of the assessors of the suitability test.
Age < 20 21 – 30 31 – 40 41 – 50 51 – 60 > 60
Quantity 1 13 5 1 1 0
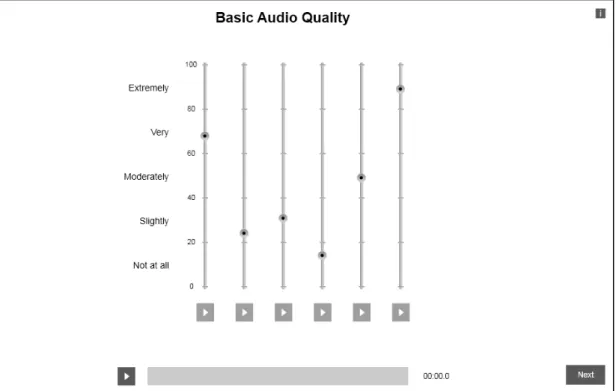
The sound samples were 15 seconds long and were presented without background noise. The listeners were given a picture of a BMW i3 as a reference electric vehicle and were asked to rate the suitability of the warning signals for the car using the graphical user interface illustrated in Figure 8. The result of the suitability test is presented in the upcoming chapter.
Annoyance test
The goal of the annoyance test was to find out the unpleasantness of each warning signal. A total of 21 assessors participated in the test and the age distribution is shown in Table 6.
Table 6 - Age and quantity of the assessors of the annoyance test.
Age < 20 21 – 30 31 – 40 41 – 50 51 – 60 > 60
Quantity 1 16 2 1 1 0
The sound samples were 15 seconds long and were presented without background noise. The listeners were asked to imagine being at home, hearing the warning signals outside as part of traffic noise and rate the annoyance of the signals using the graphical user interface illustrated in Figure 9. The result of the annoyance test is presented in the upcoming chapter.
4
Result and analysis
The current chapter presents the result data of this study and an analysis of the findings.
4.1 Result
The results from the audibility test, suitability test and the annoyance test are presented below.
Audibility test
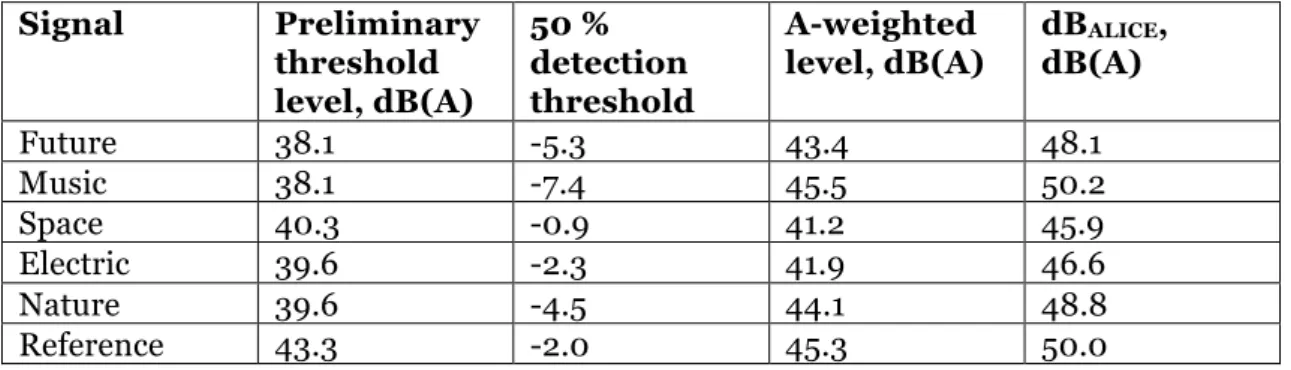
The obtained result of the audibility test is shown in Table 7. The second column of the table illustrates the A-weighted sound pressure levels that were assessed as the preliminary threshold levels for the warning signals in a simplified background noise. The third column shows the offset of the preliminary threshold values found as the average for the six assessors. The fourth column shows the calculated A-weighted sound pressure levels in a simplified background noise, i.e. for the stated levels all warning signals are equally audible. The fifth and last column presents the values that gives the same audibility as an internal combustion engine vehicle.
It is possible to see that for the same audibility of the warning signals; the A-weighted sound pressure levels differ more than four decibels.
Table 7 - The result of the audibility test.
Signal Preliminary threshold level, dB(A) 50 % detection threshold A-weighted level, dB(A) dBALICE, dB(A) Future 38.1 -5.3 43.4 48.1 Music 38.1 -7.4 45.5 50.2 Space 40.3 -0.9 41.2 45.9 Electric 39.6 -2.3 41.9 46.6 Nature 39.6 -4.5 44.1 48.8 Reference 43.3 -2.0 45.3 50.0
Suitability and annoyance tests
The results of the suitability and annoyance tests are computed and plotted with a mean value and a 95 % confidence interval. The confidence interval may be regarded as the measuring uncertainty, which means that if the experiment is re-run there is a 95 % probability that the mean value will be within this interval. Both test results are evaluated individually but in order to find which warning signal that was considered most optimal, the differences between both test methods are used as the final test result.
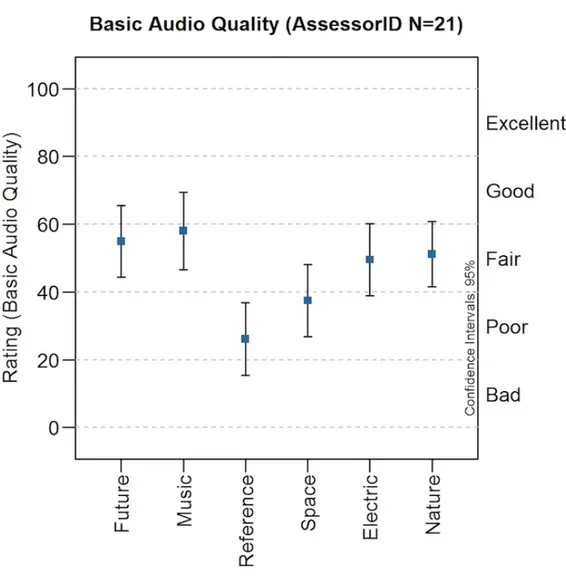
The result obtained from the suitability test is illustrated in Figure 10. The warning signals are displayed on the x-axis and the numerical assessment scale (left) as well as the verbal category scale (right) are displayed on the y-axis. The confidence intervals are represented with vertical bars and the mean values with blue squares. As seen
from the figure, the mean values of all sound samples are within the categories ‘Fair’ and ‘Poor’. The warning signal that was rated most suitable for electric and hybrid vehicles was the ‘Music’ signal. However, the confidence intervals show a wide distribution of opinions which means that the values of the systems may not be utterly reliable. The individual results of the suitability test are illustrated in Appendix 4.
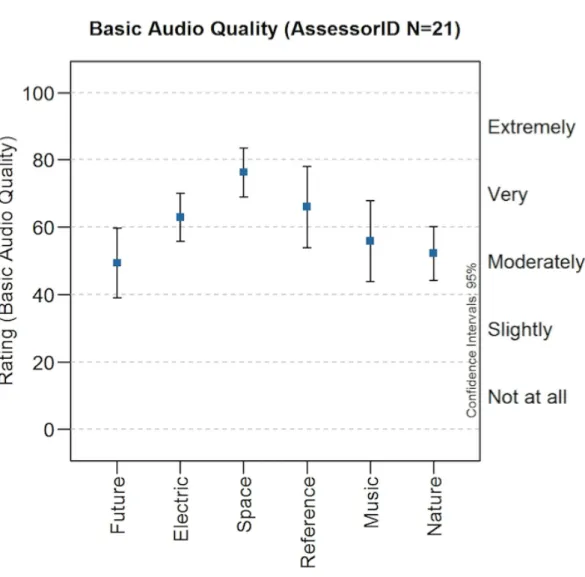
The result obtained from the annoyance test is illustrated in Figure 11. The mean rating of all warning signals is within the verbal categories ‘Very’ and ‘Moderately’. From the figure it is possible to see that the most annoying sound sample according to the assessors was the ‘Space’ signal. The sound sample ranked as least annoying was the ‘Future’ signal, closely followed by the ‘Nature’ signal. The individual results of the annoyance test are illustrated in Appendix 5.
The confidence intervals of the annoyance test showed to be smaller for some of the sound samples compared to the result of the suitability test.
The difference between the suitability and the annoyance assessments is shown in Table 8. The result was obtained by subtracting the mean values of the annoyance test from the corresponding values of the suitability test. The signals with the highest scores are considered most optimal.
The result between the two test methods show that the distribution of the mean values is widely spread amongst the warning signals. The sound sample that received the best mean was the ‘Future’ signal and the sound sample that received the worse mean was the ‘Reference’ signal. However, the target specifications stated in chapter 3.1 indicates that the annoyance of a warning signal is weighted more important than the suitability. This means that based on the customer needs, the ‘Space’ signal is the least optimal one.
Table 8 - The final result of the suitability and annoyance tests.
Signal Mean value
Future 5.57
Music 2.10
Space -38.81
Electric -13.43
Nature -1.05
Reference -39.81
4.2 Analysis
The analysis has been based on the assumption that the A-weighted sound pressure levels calculated in the audibility test are accurate. This to eliminate the possibility that the results of the suitability and annoyance tests have been affected by a difference in sound levels.
Based on the mean values, the results suggest that none of the sound samples are appropriate candidates for external warning signals. None of the samples pass the verbal category ‘Fair’ in the suitability test and none of the samples pass the verbal category ‘Moderately’ in the annoyance test. Nonetheless, it is clear from the final result displayed in Table 8 that the sound samples most preferable are those that are smooth and soft with long tone sequences. However, important to consider is that these results are solely based on listening tests. Results from field tests would perhaps appear different since surrounding objects such as buildings, road-traffic and the weather can make large impacts. As stated in chapter 2.2, sound quality is not only evaluated in terms of annoyance or suitability, it is also important with people’s interaction with the product.
Introducing new audio experiences to a group of consumers is challenging regardless of what test method is being used. Also stated in chapter 2.2 is that familiar sounds are usually perceived less annoying than unfamiliar sounds. Interesting is that the ‘Reference’ signal was rated second worse in the annoyance test although this would supposedly be the only sound that the listeners are accustomed to hearing. The large confidence interval of the signal shows however that the ratings were distributed variously amongst the listeners thus if the test were to be re-run, it might be rated less annoying. The mean values of the suitability test indicate that the ‘Reference’ signal together with the ‘Space’ signal are the least suitable warning signals for electric and hybrid vehicles such as an BMW i3
The large confidence intervals of the sound samples make it difficult to give the results reliance. Individual attributes such as mood and expectations can have a big influence in what the listeners choose to answer. The theoretical background of sound quality discusses the importance of product expectations and its relation to annoyance and unpleasantness. If the tests were to be repeated with the same assessors, the expectations of the sounds would presumably be different than before the first test round and the results would maybe change completely because of this. Although the large confidence intervals are less favorable in order to reach a conclusion, it indicates that the educational background of the participants did not affect the outcome of the tests. However, to ensure that this supposition is true, further tests should be performed.
5
Discussion and conclusions
The current chapter includes a discussion of the implementation and the findings. It also presents a conclusion of the work and suggestions for future studies.
5.1 Discussion of method
This project was intended to produce useful warning signals for electric and hybrid vehicles to enhance the safety of pedestrians and cyclists. The current chapter discusses the choice of method and the outcome of the study.
Concept development process
The concept development process was chosen based on its structured approach in creating product concepts, but also on its simplicity and flexibility. Although the process is intended for the development of physical products, it can be applied to any type of artifact. An alternative method would have been the product sound design process, which is specifically designed for the development of sound concepts but because it requires a deeper understanding of the nature of sound and a wider availability of sound sketching tools, the method was deselected.
The first step of the concept development process was to identify customer needs. For this study, the needs were established from interviews with the customer and potential end users. However, in order to complete the list, needs from lead users should have been included as well. The lead users in this project would have been blind and visually impaired persons who have experienced the need of external warning signals months or years ahead of the majority of the market.
After the customer needs had been translated into product specifications, the concept generation process was started. The idea of choosing the 6-3-5 method was to get a large amount of concepts to work with, and to involve the company in the process without being time consuming. A good complement to the brainwriting method would have been a design tool that involves group discussion and creative thinking with restrictions. This to generate even more ideas for the concept combination table but also to hear how people reflect on the subject of external warning signals. Another idea would have been to use a mood-board to specify which feelings and emotions the signals should provide to pedestrians and other road users. A mood-board could also have been beneficial during the concept selection process as it could have helped to determine if the sound concepts are appropriate as warning signals. The concept selection was carried out using the method ‘product champion’. This was not the ultimate choice but because of time restriction, this was the best option. A better choice would have been to involve the company in the selection by for example listing pros and cons or by voting for the best concepts. However, acoustic characterizations are difficult to describe in words and it is not until the sound has been created that it is clear how it is perceived.
Measurement methods
When test methods were chosen, it was essential to use methods that would work with the objective of this study and that would provide information to answer the
research question. For this reason, the measurement methods described in chapter 2.4 were selected.
The audibility test was important to use to eliminate the risk that difference in sound levels would affect the result of the suitability test and the annoyance test. However, the test was only performed with three out of the seven recommended sound levels because of time limitation. This together with the choice of assessors may have affected the result negatively. Since the audibility test is based on finding differences and not on personal opinions, it would have been preferable to use a trained sensory panel instead of a consumer panel.
The suitability test and the annoyance test were chosen to investigate how well the sound samples fit the image and expectations of the product, as well as how much annoyance and unpleasantness the sounds are contributing with. The tests were performed with 21 assessors each, which is enough to avoid clusters but the ideal would have been to use at least between 100 and 150 consumers in this type of studies to obtain reliable information. Field testing of the suitability and annoyance of the warning signals for a specific vehicle would also be preferable in order to test how the signals are perceived in the right environment.
5.2 Discussion of findings
The research question for this study was defined as ‘How should external warning signals for electric and hybrid vehicles sound to alert vulnerable road users without contributing to noise pollution?’.
Based on the results of the tests it could be established that the sound samples with long tone sequences were more preferred than those with short tone sequences, and that the artificial approach was more popular than the sound of an internal combustion engine vehicle. However, as mentioned in the analysis section the results are solely based on listening tests and can therefore be deceptive. What is perceived as annoying from a certain sound can be masked when combined with other sounds. This means that when the warning signals are merged with background noise, acoustical parts of the signals may be overshadowed and the perception of the sound will change. To confirm the results of the measurement methods and in order to answer the research question in a proper way, it is therefore essential that the warning signals are evaluated together with the product in its right context.
5.3 Conclusions and future work
This study has collected first-phase information about external warning signals and a need for further development has been identified.
As previously mentioned, important when working with sound quality is to connect the product sound with its sound source so that people can interact with the object in its right context. Although the results from the listening tests show a certain connection between the subjective impressions of the assessors and the sound characteristics, the information is not enough to be translated into actual facts. It is therefore suggested that field tests should be conducted. The field tests can give information on how the warning signals interact with a vehicle, it can give information on whether the signals alert other road users and whether these sounds
give knowledge on how the signals interrelate with background noise and if the signals can travel through walls. It will also be important in the future to perform tests on how the different warning signals from different car brands work together in urban areas.
When results from the field tests have been obtained, it is recommended that the concept development process is repeated. This to make sure that all needs from different users have been covered and that the full space of alternatives have been explored with the new found knowledge. Based on the results of the field tests, new sound concepts should be developed and further tests should be utilized. It is important that the process of product sound design continues to iterate until all customer needs have been fulfilled.
Another suggestion for future work is to examine the sensation magnitude ‘sone’, which is briefly mentioned in chapter 2.2. Since the sound levels in the UNECE regulation are specified with the A-weighted sound pressure unit, it was natural to use the same unit when specifying the target specifications and when performing the measurement methods. However, as Figure 3 suggests there can be essential differences between the A-weighted sound pressure levels and the individually perceived level of hearing sensations and it would therefore be interesting to examine this difference for the different warning signals.
6
References
[1] Khajepour, A., Fallah, S.M. & Goodarzi, A. (2014). Electric and hybrid
vehicles: technologies, modeling and control: a mechatronic approach.
Chichester United Kingdom: Wiley
[2] Gillibrand, A., Suffield, I., Vinamata, X., Williams, R. & Brückmann, A. (2011). An Initial Study to Develop Appropriate Warning Sound for a Luxury Vehicle Using an Exterior Sound Simulator. SAE Technical Paper. doi: 10.4271/2011-01-1727
[3] Ashmead, D.H., Grantham, D.W., Maloff, E.S., Hornsby, B., Nakamura, T., Davis, T.J., … Erin, G. (2012). Auditory Perception of Motor Vehicle Travel Paths. Human Factors: The Journal of Human Factors and Ergonomics
Society, Vol. 54(3), pp. 437-453
[4] Wogalter, M.S., Lim, R.W. & Nyeste, P.G. (2014). On the hazard of quiet vehicles to pedestrians and drivers. Applied Ergonomics, Vol. 45(5), pp. 1306-1312
[5] Regulation (EU) No 540/2014 of 16 April 2014 on the sound level of motor vehicles and of replacement silencing systems, and amending Directive 2007/46/EC and repeating Directive 70/157/EEC.
[6] China Automotive Technology and Research Center. (n.d.). China EV
standardization roadmap was approved after evaluation. Retrieved March
12, 2016, from
http://www.catarc.ac.cn/ac_en/content/20160119/14519.html
[7] Economic Commission for Europe ECE/TRANS/WP.29/2016/26 of March 2016 on Proposal for a new Regulation concerning the approval of quiet road transport vehicles (QRTV).
[8] United Nations Economic Commission of Europe. (n.d.). Mission. Retrieved March 17, 2016, from
http://www.unece.org/mission.html
[9] United Nations Economic Commission of Europe. (2016). New UN
Regulation keeps silent cars from becoming dangerous cars. Retrieved May
21, 2016, from
http://www.unece.org/info/media/presscurrent-press- h/transport/2016/new-un-regulation-keeps-silent-cars-from-becoming-dangerous-cars/doc.html
[10] Okokon, E.O., Turunen, A.W., Ung-Lanki, S., Vartiainen, A.K., Tittanen, P. & Lanki, T. (2015). Road-traffic noise: annoyance, risk perception, and noise sensitivity in the Finnish adult population. International Journal of
Environmental Research and Public Health, Vol. 12(6), pp. 5712-5734
[11] Yamaha Commercial Audio. (n.d.). Audio quality in networked systems. Retrieved March 25, 2016, from
http://download.yamaha.com/api/asset/file/?language=en&site=countrysite-master.prod.wsys.yamaha.com&asset_id=60732
[12] Torben, H.P. (2011). White paper on external warning sounds for electric
http://www.unece.org/fileadmin/DAM/trans/doc/2011/wp29grb/QRTV-06-04e.pdf
[13] Lui, H., Zhang, J., Guo, P., Bi, F., Yu, H. & Ni, G. (2015). Sound quality prediction for engine-radiated noise. Mechanical Systems and Signal
Processing, Vol. 56-57, pp. 277-287
[14] Moore, B.C.J. (1977). An Introduction to the Psychology of Hearing. Retrieved from
https://books.google.se/books?id=LM9U8e28pLMC&printsec=frontcover#v= onepage&q&f=false
[15] Bloxsom, W. (2012). Understanding, implementing genset noise control.
Consulting – Specifying Engineer. Retrieved from
http://search.proquest.com.bibl.proxy.hj.se/docview/1221160841/fulltext/48 A45E883B374980PQ/1?accountid=11754
[16] Lamancusa, J.S. (2000). Human Response to Sound. Retrieved February 27, 2016, from
http://www.mne.psu.edu/lamancusa/me458/3_human.pdf
[17] Fastl, H. (2006). Psychoacoustic Basis of Sound Quality Evaluation and
Sound Engineering. Retrieved April 18, 2016, from
https://www.mmk.ei.tum.de/fileadmin/w00bqn/www/Personen/Fastl/PDF/ 1013.pdf
[18] Zwicker, E. & Fastl, H. (1999). Psychoacoustics: Facts and Models. Retrieved from
https://books.google.se/books?hl=en&lr=&id=WLvtCAAAQBAJ&oi=fnd&pg= PA1&dq=E.+Zwicker+Psychoacoustics&ots=kHpDaCalLy&sig=6qYDFwQWl MVmwkWTww77WKmFYn4&redir_esc=y#v=onepage&q=E.%20Zwicker%20 Psychoacoustics&f=false
[19] Guski, R. (1997). Psychological Methods for Evaluating Sound Quality and Assessing Acoustic Information. The Journal of the European Acoustics
Association, Vol. 83, pp. 765-774
[20] Genuit, K. & André, F. (2014). Sound design of electric vehicles – Challenges
and risks. Retrieved May 3, 2016, from
https://www.acoustics.asn.au/conference_proceedings/INTERNOISE2014/p apers/p515.pdf
[21] Bodden, M. (1997). Instrumentation for Sound Quality Evaluation. The
Journal of the European Acoustics Association, Vol. 83, pp. 775-783
[22] Ulrich, K.T. & Eppinger, S.D. (2012). Product Design and Development (Fifth edition). New York: McGraw-Hill
[23] Herring, S.R., Jones, B.R. & Bailey, B.P. (2009). Idea Generation Techniques among Creative Professionals. 42nd Hawaii International Conference on System Sciences, pp. 1-10
[24] Heslin, P.A. (2009). Better than brainstorming? Potential contextual boundary conditions to brainwriting for idea generation in organizations.
Journal of Occupational and Organizational Psychology, Vol. 82(1), pp.
[25] International Organization for Standardization. (2004). ISO 4120: Sensory
analysis – Methodology – Triangle test. Genève, Switzerland: International
Organization for Standardization.
[26] International Telecommunication Union. (2003). ITU-R BS.1534-1: Method for the subjective assessment of intermediate quality level of coding systems.
7
Appendices
Appendix 1 Concept generation
Appendix 2 Concept combination table Appendix 3 Instructions test methods Appendix 4 Data distribution suitability test Appendix 5 Data distribution annoyance test
7.1 Concept generation
The concepts generated from the 6-3-5 method are shown in Table 9. A total of 82 ideas of different types of sounds were generated using this creativity tool.
Table 9 - Concepts generated from the 6-3-5 method.
Boat Storm Horse clapping Heart beat Star Wars
Classical music Vacuum cleaner Ping pong Milling machine Whining gears
Breeze Bird song Applause Jaws Noise
Toilet flushing Downhill skiing Saw Star ship Forest Screaming
monkeys Whistling 2000 odyssey Space Debussy Dish washer Drilling
machine
Train Jungle Bees Laughter
Transformers Jingles Fan Bike Rain
Wasp Children crying Flute Orchestra Clock
Traditional
airplane Water fall Bumblebee Singing Drums
Computer Propeller Wave Wolf Yelling
Guitar Coffee machine Jet plane Tram Sleigh
Frog Speech Electric sparkle Phone vibration Winter tires
Cricket Walking Jojk Bubble pool Rc model plane
Helicopter Turbine Cheering Yodel Boiling water
Car horn Soft music Tuning fork Bicycle ring
clock Traditional ICE Church bell T-Fort Sports car Draft beer Car accident Robot Army walking
7.2 Concept combination table
The structure of the concept combination table is shown in Figure 12. The concepts generated from the 6-3-5 were organized into subcategories to facilitate the combination activity.
7.3 Instructions test methods
The written instructions that were given to the listeners are illustrated in this Appendix. The instructions for the audibility test is shown in Figure 13, the instructions for the suitability test is shown in Figure 14 and the instructions for the annoyance test is shown in Figure 15.
7.4 Data distribution suitability test
The data distribution of the suitability test is shown in Figure 16. The figure illustrates a box plot, in which the sound samples are displayed on the x-axis and the numerous scale is displayed on the y-axis. The headline of each box displays the assessor ID.
7.5 Data distribution annoyance test
The data distribution of the annoyance test is shown in Figure 17. The figure illustrates a boxplot, in which the sound samples are displayed on the x-axis and the numerous scale is displayed on the y-axis. The headline of each box displays the assessor ID.
![Figure 1 - Normal hearing thresholds and equal loudness curves according to ISO 226 [12]](https://thumb-eu.123doks.com/thumbv2/5dokorg/5393881.137790/11.892.145.751.124.659/figure-normal-hearing-thresholds-equal-loudness-curves-according.webp)
![Figure 3 - Level-thermometer (left) in comparison to loudness-thermometer (right) [18]](https://thumb-eu.123doks.com/thumbv2/5dokorg/5393881.137790/13.892.213.702.423.899/figure-level-thermometer-left-comparison-loudness-thermometer-right.webp)