THESIS
ANALYSIS OF LAND USE CHANGE AND GREENHOUSE GAS EMISSIONS IN KALASIN PROVINCE, THAILAND
Submitted by Preeyarat Chailangka
Department of Soil and Crop Sciences
In partial fulfillment of the requirements For the Degree of Master of Science
Colorado State University Fort Collins, Colorado
Summer 2018
Master’s Committee:
Advisor: Keith Paustian Steven Fonte
Copyright by Preeyarat Chailangka 2018 All Rights Reserved
ii ABSTRACT
ANALYSIS OF LAND USE CHANGE AND GREENHOUSE GAS EMISSIONS IN KALASIN PROVINCE, THAILAND
Growing global population causes many stresses on the environment, perhaps the most serious is global warming due to Greenhouse Gas (GHG) emissions. Major contributors to GHG emissions include agricultural production and land use change. Southeast Asia is one of the world’s fastest growing regions and provides many crops for export, so the land use changes are rapid and not always made in an environmentally conscious manner. The province chosen for this study, Kalasin, is located in a major economic development region with the multi-country East-West Economic Corridor (EWEC) running through it. The EWEC has brought many changes to this province such as expansion of the manufacturing sector, more urban growth to support new factories, and new roads to reach areas which were previously not developed. The largest single land use in Thailand and the Kalasin province is cropland. There have been many changes in farming practices in the province as well, from the types of crops grown to the increasing numbers of commercial farms. These shifts in land use are leading to changes in the amount of GHG emissions and are also leading to land degradation in parts of the province as well. The largest GHGs emissions in agricultural sector come from rice cultivation (45%), followed by biomass carbon stock losses (40%). Some government policies have led to crops being grown on unsuitable lands, which is often associated with greater use of fertilizers and intensive tillage practices applied. Other practices involve draining wetlands, creating rice paddies on unsuitable soils, or clearing forests to farm the area. In this study we look at land use and land use changes throughout the province and use that data to estimate a GHG emissions inventory in the agricultural sector in
iii
order to better understand the effects that growth, land use and land use changes in the Kalasin province have on the environment.
iv
ACKNOWLEDGEMENTS
I want to extend my deepest gratitude to the people who helped me achieve my goals. First, I would like to thank my advisor Keith Paustian who agreed to have me as his student when I was in Thailand and still mastering English. Keith has been an excellent role model and always an inspiration when I felt hopeless in this endeavor. He has always found a way to explain concepts and materials that I was having a hard time understanding in a way that made sense to me. He is not only my academic advisor, but he has taught me much about life in the U.S. Thanks to his kindness I have never felt homesick because I feel like he is part of my family.
I would also like to thank my graduate committee Steven Fonte and Stephen Leisz, without whom I would not have been able to accomplish this. Stephen Leisz shared with me his experiences working in Southeast Asia and gave me the suggestion that led to the study in this thesis. He helped me in so many ways, including giving me some study information for the comparisons, providing me with a lab and access to the ARCGIS software that I was able to create the maps with.
I am very grateful for the opportunity to come to CSU and be surrounded with so many scientists who are at the top of their areas of study. They have all been very welcoming and helpful through my studies and research.
I will be forever indebted to my senior colleague Pitayakon Limtong, who was my personal consultant through much of this project. He gave me inspiration when I needed it the most made sure I was staying on track with my research. He provided me with information concerning land use planning, soil degradation and other issues regarding the soil in the study area. I am also so thankful for all of my other colleges who helped me with current information from Thailand.
v
I would like to thank the Royal Thai Embassy in Washington, D.C. for supporting me any time I had an issue. The Thai government for providing me with this amazing opportunity and the Land Development Department for investing in me.
Last, but certainly not least, I would like to thank my friends and family for all of their support and inspiration they gave me every day during these past two and a half years. I would like to thank Thitinon Thiud for supporting me when I had so many hard times. He also read my thesis, checked my grammar and helped me make some of my thoughts clearer in the papers.
vi TABLE OF CONTENTS ABSTRACT ... ii ACKNOWLEDGEMENTS ... iv CHAPTER 1 INTRODUCTION ... 1 REFERENCES ... 6
CHAPTER 2 LAND USE CHANGE IN NORTHEAST, THAILAND ... 9
SUMMARY ... 9
INTRODUCTION... 10
MATERIAL AND METHODS ... 15
DESCRIPTION OF THE STUDY AREAS ... 15
TOOLS AND DATA SOURCES ... 18
METHODS ... 19
RESULTS AND DISCUSSION ... 23
LAND USE CONVERSION... 23
SOIL FERTILITY, SOIL TEXTURE AND LAND USE ... 33
THE EAST-WEST ECONOMIC CORRIDOR AND LAND USE CONVERSION .. 36
CONCLUSION ... 38
PHYSICAL FACTORS ... 40
ECONOMIC AND SOCIAL FACTORS ... 40
REFERENCES ... 42
CHAPTER 3 GREENHOUSE GAS EMISSIONS ASSOCIATED WITH LAND USE AND LAND USE CHANGE, NORTHEAST THAILAND ... 49
SUMMARY ... 49
INTRODUCTION ... 50
MATERIAL AND METHODS ... 54
TOOLS ... 54
DESCRIPTION OF THE STUDY AREAS AND VARIABLES INFLUENCING EMISSIONS... 54
Temperature and precipitation ... 55
Climate and ecological zone ... 56
vii
Land use category and sub-category... 57
Biomass management... 58
Crop residue management ... 58
Rice system ... 59
Soil carbon ... 59
Land use change ... 59
BOUNDARY OF THE STUDY AREA AND INVENTORY EMISSIONS ... 60
BIOMASS CARBON STOCKS ... 61
SOIL CARBON STOCK CHANGES ... 62
METHANE EMISSIONS FROM RICE CULTIVATION ... 63
NON-CO2 GREENHOUSE GAS EMISSIONS FROM BIOMASS BURNING (CROP RESIDUES) ... 63
DIRECT N2O EMISSIONS FROM CROP RESIDUES AND MINERAL N FERTIZERS ... 64
INDIRECT N2O EMISSIONS FROM CROP RESIDUES AND MINERAL N FERTIZERS ... 65
CO2 EMISSIONS FROM UREA FERTILIZATION ... 65
RESULTS AND DISCUSSION ... 66
BIOMASS CARBON STOCKS FROM LAND USE AND LAND USE CHANGE .. 66
CARBON STOCK CHANGES FROM MINERAL SOILS ... 68
CH4 EMISSION FROM RICE CULTIVATION ... 69
CH4, N2O, NOX, AND CO EMISSIONS FROM BIOMASS BURNING (CROP RESIDUES) ... 70
DIRECT N2O EMISSIONS FROM CROP RESIDUES AND SYNTHETIC FERTILIZERS ... 71
INDIRECT N2O EMISSIONS FROM CROP RESIDUES AND SYNTHETIC FERTILIZERS ... 72
CO2 EMISSIONS FROM UREA FERTILIZATION ... 73
CONCLUSION ... 73
REFERENCES ... 76
1 CHAPTER 1
INTRODUCTION
Growing population and increased demands for food, fiber and energy pose a huge challenge to global food security and environmental sustainability (FAO, 2005). Furthermore, many people continue to suffer from malnutrition; the number of people suffering severe hunger in the world increased from 777 million in 2015 to 815 million in 2016 (FAO, 2017). World Food Programe (2017) reported that there were approximately 815 million people who suffer from starvation and 52 million children have weight too low given their height. Not only does food demand continue to grow every year, but also demand is growing for natural resources such as fuel, clean water, and the land needed for growing food. Thus, to meet global demand for food and other natural resources, agricultural production must grow to meet human population growth. Globally, Bergeron (2010) reported that many forestlands continue to experience deforestation and that land degradation has expanded, while the area of farmland has been growing since the 1980s. Moreover, Gibbs et al. (2010) showed that nearly 13 million hectares of new agricultural land was created in the developing countries between 1980 and 2000. Thus, growing need for agricultural lands continues to be a major driver of land use conversion.
There is much evidence that the Earth is getting warmer which could severely impact society in multiple ways, including human health, natural disasters, food security, and natural resources availability and uses (Mann et al., 1998; Dietz, 1997; McMichael et al., 2006; Haines et
2
al., 2006; Ritchie & Roser, 2018). The major cause of global warming and climate change is anthropogenic greenhouse gas (GHG) emissions, leading to increased carbon dioxide (CO2) and
other GHGs (e.g. N2O, CH4) concentration in the atmosphere that could lead to serious climate
disruptions (Mercer, 1978). IPCC (2014) reported that seventy-six percent of the net warming due to global GHG emissions is attributable to CO2, of which is a significant portion is produced from
Agricultural, Forestry and Other Land Use (AFOLU) (11%) and fossil fuel and industrial processes (65%). However, it is not only CO2 that is emitted from the AFOLU sector, but also CH4 and N2O.
These gases (CH4 and N2O) have more warming impact of than CO2 over a hundred year time scale;
a tonne of CH4 or N2O has 28 times and 265 times the warming impact of a tonne of CO2,
respectively (IPCC, 2013). Furthermore, forty-six percent of the warming effect of GHG emissions in the AFOLU sector is from N2O which is generated from soils, followed by CH4 (45%) which is
produced from enteric fermentation, manure management, and rice paddies cultivation (World Resources Institute: WRI, 2005; McMichael et al., 2007; Schwarzer, 2012). Since, AFOLU is a major contributor to global GHG emissions, any activity or disturbance which occurs in this sector, such as deforestation and land use conversion, is likely to affect the global warming.
From the beginning of the industrial revolution until 1992, 30% of the increase in CO2 in
the atmosphere has been from land use conversion (Heil and Selden, 2001). Moreover, the Food and Agriculture Organization of the United Nations: FAO (2014) also reported that GHG emissions from crop and livestock management increased 14% from 2001 to 2011. Population expansion in developing countries leads to further land use conversion to agricultural uses, which contributes to soil carbon losses (Smith, 2008). However, croplands that are converted back to forest or pasture
3
can result in increased soil carbon accumulation (Post and Kwon, 2000; Lal, 2005). Over the decade of 2001-2010, there was a decrease in GHG emissions from land use conversion, and during the same period the rate of deforestation decreased by roughly 10% (FAO, 2017). Therefore, land use change is one of many causes that can influence GHG emissions and soil carbon stock losses which lead to the global warming, while management of forest plantations, decreased deforestation, and afforestation have the ability to store soil and biomass carbon and reduce atmospheric CO2
concentrations (Terakunpisut et al., 2007).
According to the Gross Domestic Product (GDP) growth data from World Bank (2018), over past the 10 years, Thailand has been one of the most dynamic and fastest growing countries in Southeast Asia. The high GDP growth rate in Thailand not only improves the quality of life of the Thai people, but also contributes to a high rate of land use conversion. As described in above, deforestation, GHG emissions, soil carbon stock losses, and land degradation all result of land use change and subsequent management. Land use changes without a sustainable soil management plan has been a major cause of land degradation in agricultural lands in the country. The northern region of Thailand has soil erosion problems, while the northeastern and the eastern region of the country are faced with soil salinity and low soil fertility. These problems impact not only crop growth and crop yield, but also general environmental quality.
The northeastern region of Thailand is one of two regions where the East-West Economic Corridor (EWEC) passes through. The EWEC is an economic improvement project which connects transportation routes and the trade system between the four countries of Myanmar, Thailand, Lao PDR, and Vietnam (Office of the National Economic and Social Development Board, 2012). The
4
EWEC stimulates economic activities such as infrastructure development for more efficient product distribution, market expansion, growth in urban areas, increased manufacturing, agricultural production and tourism in the region. This economic corridor is the important route, which connects between south China sea and Indian ocean. This route can improve transportation faster and cheaper. The increased access and economic activities also increase the risk for illegal logging, wood smuggling and increased land use conversion to meet growing land demand. Moreover, since there are increasing building area demands, areas of cropland, grassland, and forestland might be converted to housing, businesses, factories and other urban land uses. Therefore, the EWEC could be a major factor driving land use changes in the region.
In this study, the Kalasin province in northeastern Thailand was selected for conducting a GHG emission inventory and analysis, as this province is part of the EWEC. The Forestland Management Office, Royal Forest Department of Thailand (2015) reported that the forestland in the Kalasin province have decreased from 2006 to 2015 with the expansion of croplands as one of several causes of deforestation. Some forest areas were changed to cash crop production due to the increasing agricultural demand. With its location in the EWEC, Kalasin’s recent development plan (2011-2014) had four strategies, including development of agricultural products, development of Wa silk, economic development focused on tourism, and socio-economic development (National Statistical Office Thailand, 2014). This development plan has incentivized increased outputs from the agricultural sector and changes in the farming systems, with a shift from subsistence agricultural production to more commercial farming. The main economic crops of the Kalasin
5
province are rice, cassava, para rubber, and sugarcane. There are also many industrial factories which process agricultural outputs from the province (Kalasin Provincial Agriculture Office, 2016).
The aims of this study were to quantify land use changes and related greenhouse gas emissions from the agricultural sector excluding livestock in the Kalasin province. The GHG inventory builds off of a high resolution, spatially-resolved analysis of land use and management change in the province from 2006 to 2015 (Chapter 2). Emission sources and removal categories include changes in biomass and soil carbon stocks, CH4 emissions from rice cultivation and from
burning crop residues, as well as direct and indirect N2O emissions from soil management.
Analyzing GHG emissions in the region can provide a basis to explore emission reduction strategies for the agricultural sector in the future.
6
REFERENCES
Bergeron, L. (2010). Most new farmland comes from cutting tropical forest, says Stanford researcher. Stanford Report. Retrieved from
https://news.stanford.edu/news/2010/september/farmland-cutting-forests-090210.html. Charuppat, T. (1998). Forest situation of Thailand in the past 37 years (1961-1998). Forest
Research Office, Royal Forest Department, Bangkok, Thailand.[in Thai].
Dietz, W. H. (1997). Periods of risk in childhood for the development of adult obesity—what do we need to learn?. The Journal of nutrition, 127(9), 1884S-1886S.
Food and Agriculture Organization. (2005). The state of food insecurity
in the world 2005: Eradicating world hunger-key to achieving the millennium development goals. Rome, Italy: FAO Viale delle Terme di Caracalla.
Food and Agriculture Organization. )2014(. Agriculture, forestry and other land use emissions by sources and removals by sinks. Retrieved from
http://www.fao.org/docrep/019/i3671e/i3671e.pdf
Food and Agriculture Organization. (2017). Forest and climate change. FAO’S work on climate change forests. Retrieved fromhttp://www.fao.org/3/a-i6374e.pdf
Food and Agriculture Organization. (2017). How close are we to # ZeroHunger?: The state of food insecurity and nutrition in the world 2017. Retrieved from www.fao.org/state-of-food-security-nutrition.
Gibbs, H. K., Ruesch, A. S., Achard, F., Clayton, M. K., Holmgren, P., Ramankutty, N., & Foley, J. A. (2010). Tropical forests were the primary sources of new agricultural land in the 1980s and 1990s. Proceedings of the National Academy of Sciences, 107(38), 16732-16737.
Haines, A., Kovats, R. S., Campbell-Lendrum, D., & Corvalán, C. (2006). Climate change and human health: impacts, vulnerability and public health. Public health, 120(7), 585-596. Heil, M. T., & Selden, T. M. (2001). Carbon emissions and economic development: future
trajectories based on historical experience. Environment and Development Economics, 6(1), 63-83.
7
Intergovernmental Panel on Climate Change (IPCC). (2013). Anthropogenic and Natural
Radiative Forcing. In: Climate Change 2013: The Physical Science Basis. Contribution of Working Group I to the Fifth Assessment Report of the Intergovernmental Panel on Climate Change, T.F., D. Qin, G.‐K. Plattner, M. Tignor, S.K. Allen, J. Boschung, A. Nauels, Y. Xia, V. Bex and P.M. Midgley (eds.). Cambridge, United Kingdom and New York, NY, USA: Cambridge University Press.
Intergovernmental Panel on Climate Change (IPCC). (2014). Agriculture, Forestry and Other Land Use (AFOLU). In: Climate Change 2014: Mitigation of Climate Change. Contribution of Working Group III to the Fifth Assessment Report of the Intergovernmental Panel on Climate Change, Edenhofer, O., R. Pichs-Madruga, Y. Sokona, E. Farahani, S. Kadner, K. Seyboth, A. Adler, I. Baum, S. Brunner, P. Eickemeier, B. Kriemann, J. Savolainen, S. Schlömer, C. von Stechow, T. Zwickel and J.C. Minx (eds.). Cambridge University Press, Cambridge, United Kingdom and New York, NY, USA.
Kalasin Provincial Agriculture Office. (2016). Kalasin ecomomic crops. Retrieved from http://www.kalasin.doae.go.th/home_2015.html
Lal, R. (2005). Forest soils and carbon sequestration. Forest ecology and management, 220(1- 3), 242-258.
Mann, M. E., Bradley, R. S., & Hughes, M. K. (1998). Global-scale temperature patterns and climate forcing over the past six centuries. Nature, 392(6678), 779.
McMichael, A. J., Powles, J. W., Butler, C. D., & Uauy, R. (2007). Food, livestock production, energy, climate change, and health. The lancet, 370(9594), 1253-1263.
McMichael, A. J., Woodruff, R. E., & Hales, S. (2006). Climate change and human health: present and future risks. The Lancet, 367(9513), 859-869.
Mercer, J. H. (1978). West Antarctic ice sheet and CO2 greenhouse effect: a threat of disaster. Nature, 271(5643), 321.
National Statistical Office Thailand. (2014). Kalasin’s development plan. Retrieved from http://osthailand.nic.go.th/masterplan_area/userfiles/files/Kalasin_Draft.pdf
Office of the National Economic and Social Development Board (2012). The expectation of the number Thai population in 2010–2014. NI, QGDP, GPP. Retrieved from
8
Post, W. M., & Kwon, K. C. (2000). Soil carbon sequestration and land‐use change: processes and potential. Global change biology, 6(3), 317-327.
Ritchie, H., & Roser, M. (2018). Energy Production and Changing Energy Sources. Our World In Data, University of Oxford.
Schwarzer, S. (2012). Growing greenhouse gas emissions due to meat production. UNEP GEAS Releases Alert on GHG Emissions from Meat Consumption. UNEP GEAS Bulletin.
Smith, P. (2008). Land use change and soil organic carbon dynamics. Nutrient Cycling in Agroecosystems, 81(2), 169-178.
Terakunpisut, J., Gajaseni, N., & Ruankawe, N. (2007). Carbon sequestration potential in aboveground biomass of Thong Pha Phum national forest, Thailand. Applied ecology and environmental research, 5(2), 93-102.
World Food Program. (2017, September 15). World hunger again on the rise, driven by conflict and climate change, new UN report says. News. Retrieved from
https://www.wfp.org/news/news-release/world-hunger-again-rise-driven-conflict-and-climate-change-new-un-report-says
World Bank National. (2018). GDP growth (annual %). Thailand. Retrieved from https://data.worldbank.org/indicator/NY.GDP.MKTP.KD.ZG?locations=TH
WRI. (2005). Navigating the numbers: Greenhouse Gas Data and International Climate Policy. World Resources Institute. Retrieved from http://pdf.wri.org/navigating_numbers.pdf
9 CHAPTER 2
LAND USE CHANGE IN NORTHEAST, THAILAND
SUMMARY
Increasing global demand for food and natural resources results, in part, from population growth. A major consequence of meeting this increased demand is land conversion, which has important impacts on land degradation and GHG emissions. Thailand has been one of the fastest growing countries in Southeast Asia over the past 50 years. To understand the changing dynamics of this area, land use changes in the Kalasin province, Thailand were studied. The Kalasin province is an important source of agricultural products in Thailand including rice, sugarcane, and cassava. The Kalasin had a development plan from 2011 to 2014, that had the aim of changing the pattern of land use from local farming to commercial farming. Moreover, Kalasin is a province within the East-West Economic Corridor (EWEC). The EWEC connects transportation routes and trade systems between four countries in Southeast Asia. In this study, land use conversion from 2006 to 2015 is analyzed using spatial analysis, land use maps and soil series data of the Kalasin province along the corridor. The results indicate that the most common land use in both years (2006 and 2015) was devoted to cropland, followed by forest, wetlands, settlement, grasslands and other lands, respectively. Croplands and forest decreased from 2006 to 2015, while wetlands, settlement, grasslands and other land uses increased in area during this time period. The area under rice paddy declined between 2006 and 2015, likely due to the unstable rice subsidy program and the decreasing of market price. The major rice land conversion was from paddy field to sugarcane,
10
most likely because sugar’s price and global demand have been rising. This study demonstrates that physical, economic and social factors affect land use change. Moreover, land use conversion related to GHG emission, is often a result of non-suitable land use including deforestation. To evaluate key environmental impacts of land use conversion a GHG emissions inventory should be considered.
INTRODUCTION
Increasing global population leads to increase demands for food and energy uses a considerable challenge to global food security and environmental sustainability (FAO, 2005). In addition, there are many people continue to suffer from malnutrition.Not only is food demand growing every year, but demand is also on the rise for natural resources such as fuel, clean water, and land needed for growing food. Thus, to meet the global demand for food and other natural resources, agricultural growth must increase to account for human population growth. Globally, Bergeron (2010) reported that many forestlands continue to experience deforestation and that land degradation has expanded while the area of farmland has been increasing since the 1980s.
Moreover, Gibbs et al. (2010) showed that nearly 13 million hectares of new agricultural land was created in the developing countries between 1980 and 2000.
Many previous studies have quantified impacts of land use change. Meyer and Turner (1992) reported that global land use conversion leads to biodiversity loss, increased hydrological variability, and land degradation. In addition, land use conversion also contributes to global
11
warming, including GHG emissions (Permpool et al., 2016; Leisz et al., 2007; Fearnside, 2000). Changes in soil carbon stocks resulting from land transformation are often substantial, with as much as 50% or more of the topsoil organic matter stocks lost following land conversion from natural forest or grassland to cropland (Da Silva Oliveira et al., 2016; Frazão et al., 2013; Smith, 2008; Del Galdo et al., 2003). Other land use change might lead to non-suitable outcomes; for example, using an area which highly productive cropland for building factories, or building a house in a wetland or a lowland. In the first case, the farmer (and society) would lose fertile soils for growing plants, while in the second case increased risk for flooding and property damage would likely occur. Finally, conversion of marginal lands (e.g., poor soils, steep slopes, unfavorable climate) to crop production would require a high cost of production, due to high fertilizer requirements and intensive land management in order to improve crop yield. Therefore, land use conversion and unsuitable land use change can lead to land degradation problems.
Eswaran et al. (2001) said that the loss of land quality, unfavorable changes in the chemical, physical and biological properties of soils or extreme disturbances to soil are all components of land degradation. They went on to say that human activities including unsuitable land use, lack of proper soil management, and economic growth without consideration of environment consequences can lead to land degradation (Eswaran et al., 2001). These activities lead to decreased soil quality which is detrimental for agricultural production. The Global Assessment of Soil Degradation (GLASOD) reported that from the mid-twentieth century until now, worldwide around two billion hectares of agricultural land, grassland, and forest, worldwide, has been degraded (Gibbs and Salmon, 2015). The largest proportion of global land degradation is in Asia, with
12
roughly 43 percent of the land degraded followed by Africa (20%) and South America (14%) (Gibbs & Salmon, 2015; Cai et al., 2011).
World Bank (2018) reported that the Gross Domestic Product (GDP) growth data over the past 10 years of Thailand is one of the most dynamic and fastest growing countries in Southeast Asia. The high GDP growth rate not only improved the quality of life of the Thai people, but also contributes to a high rate of land conversions. As described in the previous paragraph, deforestation, GHG emissions, soil carbon stock losses, and land degradation all results of land use change. A major cause of land degradation in agricultural lands of Thailand comes from lack of sustainable soil management plan. The northern region of Thailand has soil erosion problems, while the northeastern and the eastern region of the country are faced with soil salinity and low soil fertility conditions. These problems impact not only on crop growth and crop yield, but also general environmental quality.
Agricultural land in Thailand comprises 54 percent of the total land area, while 32 percent is covered by the total land area is forest; and the remaining area is under other land use, (e.g., grasslands and, wetlands). Settlement and urban areas comprise about 12 percent of the country’s area (Land Development Department, Thailand, 2017). The historical trend of cultivation and farming area had been largely stable from 1986 to 2006 (Wongsaichue, 2010). The forestland in Thailand has decreased while the agricultural area has grown. The region which has the largest area (17 million hectares or 42 million acres) and population (Approximate 21 million) is northeast Thailand (Department of Provincial Administration, Ministry of Interior of Thailand, 2015). Although the largest proportion of gross national income (GNI) of the northeast region is not
13
agriculture, the northeastern region of Thailand holds potential to generate substantial revenue from agriculture, and is second only to the southern region in this regard. Therefore, the northeast region of Thailand is critical for the Thai agricultural system.
The East-West Economic Corridor (EWEC) passes two regions of Thailand including the north and the northeastern region Thailand. The EWEC is an economic development program which connects transportation routes and facilitates trade between the four countries of Myanmar, Thailand, Lao PDR, and Vietnam (Office of the National Economic and Social Development Board, 2012).The EWEC stimulates economic activities through infrastructure development for more efficient product distribution, market expansion, development of urban areas, increased manufacturing, agricultural productions and tourism in the region. The increased access provided by the EWEC and the new and expanding economic activities also increase the risk for illegal logging, wood smuggling and increased land use conversion to meet growing demand for land. Furthermore, since there are rising urban demands, cropland, grassland, and forestland might be converted to settlement areas or for other purposes. Therefore, the EWEC is a major factor driving land use changes in the region.
Since the northeast region of Thailand, including the EWEC, is important for Thai agricultural production, a major province in the region, the Kalasin province, was selected for this study. Agriculture is the major source of economic activity of the province. According to Land Development Department of Thailand in 2006 and 2015, more than 70 percent of the Kalasin province is in agriculture and agriculture accounts for the majority of the Gross Provincial Product (Office of the National Economic and Social Development Board, Thailand, 2015).
14
The Kalasin provincial development plan for the four year period from 2011 to 2014 had four main strategies, including the development of 1) agricultural production, 2) Wa silk, 3) tourism, and 4) social quality (National Statistical Office Thailand, 2014). The Kalasin province is an important source of agricultural products such as rice and fresh water fish. Moreover, there is a big reservoir (Lum Pao Dam), which provides water for three districts in Kalasin province including Muang Kalasin, Yang Talat, and Kamalasai. The ready supply of water gives these three districts an agricultural advantage in the province.
The main cash crops of the Kalasin province are rice, cassava, para rubber and sugarcane. Over the past decade, there has been an increasing shift from local (subsistence) farming to commercial farming. Furthermore, the expansion of urban area has also contributed to land use change and to land being used inappropriately, such as using prime agricultural to build houses or factories. This conversion of land to unsuitable uses is one cause of soil problems in the province. Land use changes in the absence of land use planning and spatially-explicit development plans can lead to detrimental effects for both farmers and the environment. Therefore, studying land use and land use change is necessary for sound land use planning and sustainable natural resource management. The objectives of this study are to understand and quantify the land use and land use change patterns of the Kalasin province over a period of 9 years, from 2006 to 2015 at fine spatial scales, in order to have the required information to assess impacts of land use change on soil degradation and GHG emissions.
15
MATERIAL AND METHODS
DESCRIPTION OF THE STUDY AREAS
The Kalasin province is located in the center of the Northeastern region of Thailand (16°25'57"N and 103°30'25"E) (Fig. 2.1), about 520 kilometers from the city of Bangkok. It has an area of about 6,947 km2, comprising 4.5% of the total area of Northeastern Thailand (Office of Commercial Affairs Kalasin, 2009) and is divided into 18 districts.
The Kalasin province falls into three topographical zones; 1) the northern part of the province is dominated by highlands and mountains, making up around 28% of the total area, 2) the central zone makes up 43% and is mostly hills and flatland, 3) the southern zone comprises 29% of the area with topography similar to the central zone, but including the Pao river with a large floodplain. Most of the area in the southern zone is low land that is suitable for agriculture.
16
Based on the Köppen-Geiger climate classification system, the Kalasin province is an Equatorial tropical savannah with a dry winter (Kottek et al., 2006). The Kalasin province has three seasons including a summer season (from March to May), a rainy season (from mid-May to October), and a winter dry season (from November to February) (Thai Meteorological Department, 2010), with the highest average temperature in April and the lowest December (Fig. 2.2). The average rainfall is 1,407 mm per year.
Figure 2.2: Monthly rainfall and temperature distribution for 30 years (1981-2010) in the Kalasin, Thailand. Data from Thai Meteorological Department (2010).
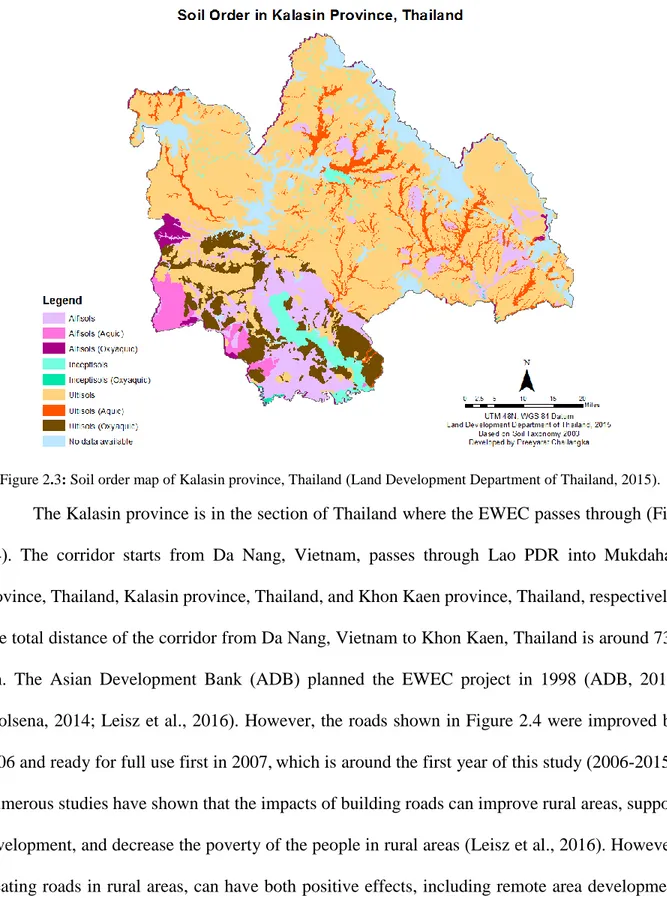
There are three dominant soil orders in the kalasin province (Fig. 2.3), including Ultisols, Alfisols, and Inceptisols (Land Development Department, 2015). Seventy percent of the soils in the study area are Ultisols, which are generally acid soils with low capacity to retain base cations from lime and fertilizers (USDA, 1999). Alfisols occupy the second-largest area in Kalasin, making up about 16% of the land area. They are formed primarily under forest or mixed vegetation and are suitable for many crops (USDA, 1999). Most of them are found in the southern zone, and some parts of the highlands in the northern zone of the province. Most Inceptisols are found in the southern zone of the province and making up around 3% of the province. Inceptisols usually occur in river valleys where relatively unweathered sediments are being deposited (USDA, 1999).
0 50 100 150 200 250 300 0 5 10 15 20 25 30 35 40
Jan Feb Mar Apr May Jun Jul Aug Sep Oct Nov Dec
Prec ip ita tio n (mm ) Te m p era tu re ( °C) Month
17
Figure 2.3: Soil order map of Kalasin province, Thailand (Land Development Department of Thailand, 2015).
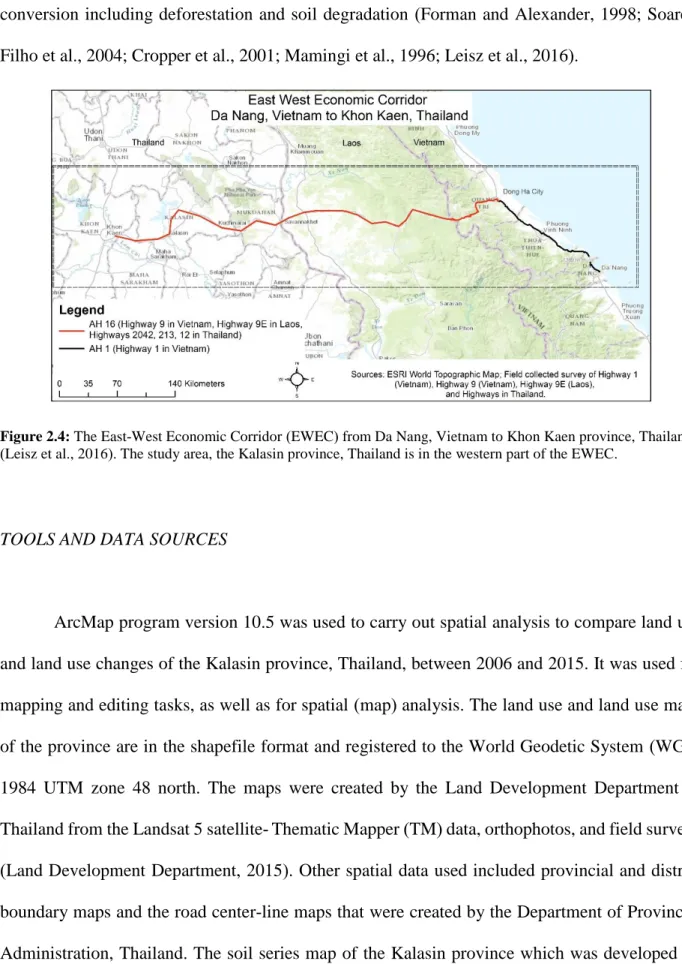
The Kalasin province is in the section of Thailand where the EWEC passes through (Fig. 2.4). The corridor starts from Da Nang, Vietnam, passes through Lao PDR into Mukdahan province, Thailand, Kalasin province, Thailand, and Khon Kaen province, Thailand, respectively. The total distance of the corridor from Da Nang, Vietnam to Khon Kaen, Thailand is around 730 km. The Asian Development Bank (ADB) planned the EWEC project in 1998 (ADB, 2010; Pholsena, 2014; Leisz et al., 2016). However, the roads shown in Figure 2.4 were improved by 2006 and ready for full use first in 2007, which is around the first year of this study (2006-2015). Numerous studies have shown that the impacts of building roads can improve rural areas, support development, and decrease the poverty of the people in rural areas (Leisz et al., 2016). However, creating roads in rural areas, can have both positive effects, including remote area development and increasing economic growth in the rural area, but also has some negative impacts from land
18
conversion including deforestation and soil degradation (Forman and Alexander, 1998; Soares-Filho et al., 2004; Cropper et al., 2001; Mamingi et al., 1996; Leisz et al., 2016).
Figure 2.4: The East-West Economic Corridor (EWEC) from Da Nang, Vietnam to Khon Kaen province, Thailand
(Leisz et al., 2016). The study area, the Kalasin province, Thailand is in the western part of the EWEC.
TOOLS AND DATA SOURCES
ArcMap program version 10.5 was used to carry out spatial analysis to compare land use and land use changes of the Kalasin province, Thailand, between 2006 and 2015. It was used for mapping and editing tasks, as well as for spatial (map) analysis. The land use and land use maps of the province are in the shapefile format and registered to the World Geodetic System (WGS) 1984 UTM zone 48 north. The maps were created by the Land Development Department of Thailand from the Landsat 5 satellite- Thematic Mapper (TM) data, orthophotos, and field surveys (Land Development Department, 2015). Other spatial data used included provincial and district boundary maps and the road center-line maps that were created by the Department of Provincial Administration, Thailand. The soil series map of the Kalasin province which was developed by
19
the Land Development Department of Thailand, was also used in this study for mapping soil properties.
Data on historical trends of forestland area in Thailand and the Kalasin province were produced by the office of the Forestland Management, Thailand, along with the land use data maps (for 2006 and 2015).
Statistical information regarding cash crop cultivation in the Kalasin province, including area under crop cultivation, crop yield, fertilizer input, and crop price, was provided by the office of Agricultural Economics, Thailand.
METHODS
Primary data sources used, information flow and analysis steps used to assess land use and land use changes are shown in Figure 2.5.
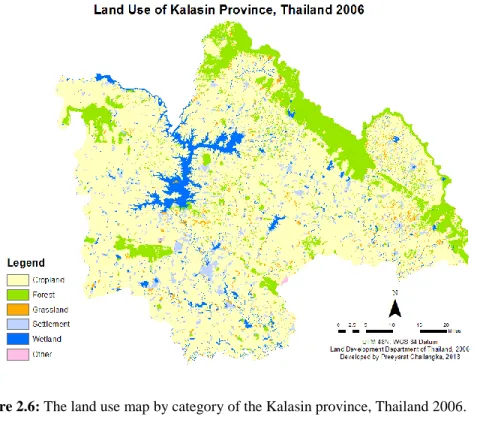
The land uses of the Kalasin province, Thailand from 2006, and 2015 were classified into six main categories including forestland, cropland, grassland, wetland, settlement, and other land (Fig. 2.6 and Fig. 2.7), which correspond to the land use categories defined by the IPCC for national greenhouse gas inventory (IPCC, 2006) and the same classification has been adopted by the United Nations Framework Convention on Climate Change (UNFCCC, 2014). Since the cropland category makes up the largest proportion of the province, it was subdivided into another seven groups including rice paddy, sugarcane, cassava, para rubber, eucalyptus, other annual crops, and other perennial crops, in order to examine in more detail the land conversions involving cropland (Fig. 2.8 and Fig. 2.9). Land use maps from two different years (2006 and 2015) were
20
overlaid to see the land use changes between those years, supplemented by longer term data on historical trends for forestland in Thailand and the Kalasin province.
Soil series maps based on the Characterization of Established Soil Series Reclassified According to Soil Taxonomy 2003 (Malairojsiri et al., 2004) were used to classify the soil into eight soil texture types; loamy sand, sandy loam, loam, sandy clay loam, clay loam, clay, silty clay loam, and sand, based on attributes given for each of the map units. Each soil texture type was further classified into two groups of soil fertility in the study area including low and moderate soil fertility, based on the criteria for the soil fertility classification of Land Development Department (1980) (Table 2.1).
Table 2.1: Soil fertility criteria (Land Development Department, 1980).
Soil fertility level OMa (%) BSb (%) CECc (me/100 g clay) Pd (ppm) Ke (ppm)
Low < 1.5 < 35 < 10 < 10 < 60
Moderate 1.5-3.5 35-75 10-20 10-25 60-90
High > 3.5 > 75 >20 > 25 > 90
a Organic Matter b Base Saturation
c Cation Exchange Capacity (me/100 g clay) d Phosphorus in parts per million
e Potassium in parts per million
The next step was to overlay the land use maps (2006 and 2015) and the soil texture map and analyze through the union function in ArcMap for the land use/cover maps, and land use changes, and the soil fertility map in order to analyze the relationship between land use changes, soil types, soil fertility and the level of soil organic matter in the Kalasin province.
To understand the dynamics of cash crop conversion in this study area, trends of crop prices for rice, cassava, and sugarcane were analyzed along with the cropland area changes between 2006 and 2015.
21
To assess impacts on land use change of the EWEC, we assumed that highways 12 and 2116, which pass through this study area, are the main transportation routes through this section of the EWEC. In order to study land use change around this route, road line and the land use change map between 2006 and 2015 were combined using the union function in ArcMap. A 5 km buffer zone from the route was created in order to study the conversion of land use/cover in this area versus the changes outside the buffer zone.
22
Figure 2.5: Flow chart showing the analysis steps and spatial data products from the assessment of land use and land use change in the Kalasin province, Thailand.
23
RESULTS AND DISCUSSION
LAND USE CONVERSION
Figure 2.6-2.7 show the land use map of the Kalasin province in 2006 and 2015,
24
Figure 2.7: The land use map by category of the Kalasin province, Thailand 2015.
Figure 2.8 and 2.9 show the cropland sub-categories map of the study area in 2006 and 2015, there are seven cropland sub-categories as well as the area outside the cropland, which includes forestland, grassland, wetland, settlement, and other land.
25
Figure 2.9: The cropland map by sub-category of the Kalasin province, Thailand 2015.
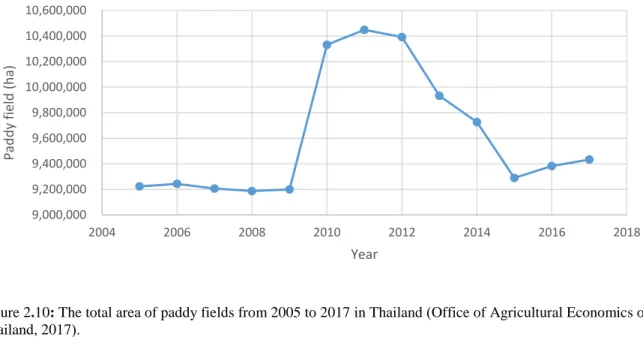
Table 2.2 shows land use in 2006 and 2015 by category and sub-category. The largest proportion in both years was cropland, followed by forestland, wetland, settlement, grassland and other land. In both years, the largest area of cropland was in paddy field (59% and 56% of cropland in 2006 and 2015, respectively). However, the area under rice in the Kalasin province in 2015 declined from 2006, which was similar to the trend for rice in the entire country (Fig. 2.10). Overall the rice area in Thailand was quite stable from 2005 to 2009 followed by a sharp increase (of 12%) in 2010 and continued growth in 2011 due to the rice subsidy program of the Thai government at that period (2010-2012). Therefore, the farmers in Thailand had a motivation to grow more rice. However, the total area of rice paddy in Thailand dropped off from 2012 to 2015 because the rice subsidy program was ended in 2013.
26
Figure 2.10: The total area of paddy fields from 2005 to 2017 in Thailand (Office of Agricultural Economics of Thailand, 2017). 9,000,000 9,200,000 9,400,000 9,600,000 9,800,000 10,000,000 10,200,000 10,400,000 10,600,000 2004 2006 2008 2010 2012 2014 2016 2018 Pa d d y fie ld (h a) Year
27
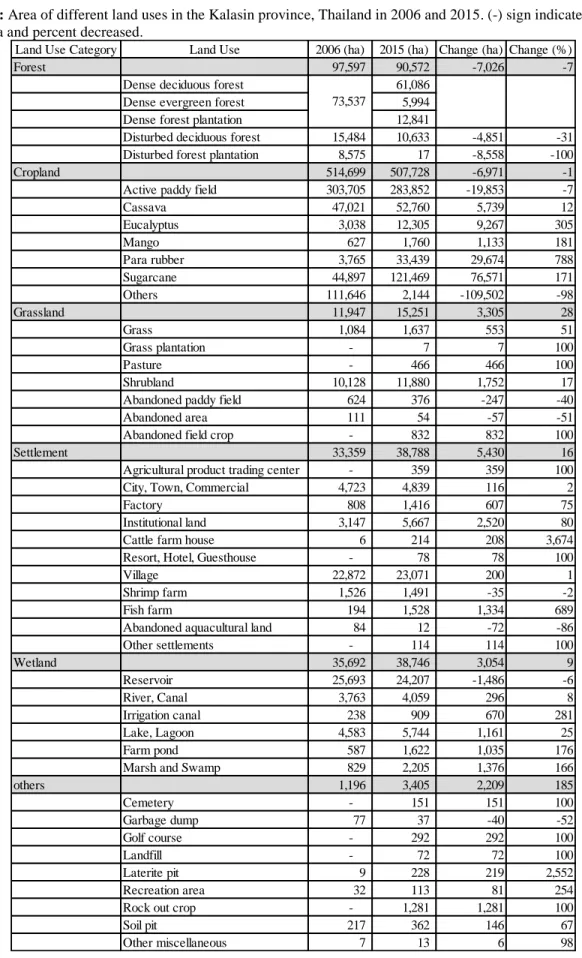
Table 2.2: Area of different land uses in the Kalasin province, Thailand in 2006 and 2015. (-) sign indicates that mean area and percent decreased.
Land Use Category Land Use 2006 (ha) 2015 (ha) Change (ha) Change (%)
Forest 97,597 90,572 -7,026 -7
Dense deciduous forest 61,086 Dense evergreen forest 5,994 Dense forest plantation 12,841
Disturbed deciduous forest 15,484 10,633 -4,851 -31 Disturbed forest plantation 8,575 17 -8,558 -100
Cropland 514,699 507,728 -6,971 -1
Active paddy field 303,705 283,852 -19,853 -7 Cassava 47,021 52,760 5,739 12 Eucalyptus 3,038 12,305 9,267 305 Mango 627 1,760 1,133 181 Para rubber 3,765 33,439 29,674 788 Sugarcane 44,897 121,469 76,571 171 Others 111,646 2,144 -109,502 -98 Grassland 11,947 15,251 3,305 28 Grass 1,084 1,637 553 51 Grass plantation - 7 7 100 Pasture - 466 466 100 Shrubland 10,128 11,880 1,752 17 Abandoned paddy field 624 376 -247 -40 Abandoned area 111 54 -57 -51 Abandoned field crop - 832 832 100 Settlement 33,359 38,788 5,430 16 Agricultural product trading center - 359 359 100 City, Town, Commercial 4,723 4,839 116 2 Factory 808 1,416 607 75 Institutional land 3,147 5,667 2,520 80 Cattle farm house 6 214 208 3,674 Resort, Hotel, Guesthouse - 78 78 100 Village 22,872 23,071 200 1 Shrimp farm 1,526 1,491 -35 -2 Fish farm 194 1,528 1,334 689 Abandoned aquacultural land 84 12 -72 -86 Other settlements - 114 114 100 Wetland 35,692 38,746 3,054 9 Reservoir 25,693 24,207 -1,486 -6 River, Canal 3,763 4,059 296 8 Irrigation canal 238 909 670 281 Lake, Lagoon 4,583 5,744 1,161 25 Farm pond 587 1,622 1,035 176 Marsh and Swamp 829 2,205 1,376 166
others 1,196 3,405 2,209 185 Cemetery - 151 151 100 Garbage dump 77 37 -40 -52 Golf course - 292 292 100 Landfill - 72 72 100 Laterite pit 9 228 219 2,552 Recreation area 32 113 81 254 Rock out crop - 1,281 1,281 100 Soil pit 217 362 146 67 Other miscellaneous 7 13 6 98
73,537
28
Results indicate that cropland and forestland decreased between 2006 and 2015, while wetlands, settlement, grasslands, and other land areas increased (Table 2.2). Fourteen percent of the Kalasin province was under forest in 2006. This decreased by 7,026 hectares, or 7.2% in 2015 and was largely converted to cropland, grassland, settlements, and other land uses, with most of the area going to cropland (Table 2.3). However, not only forest was converted to other land use, but some cropland and grassland were changed to forestland and thus, the total forest area of the Kalasin province in 2015 did not drop as much as the area of deforestation (Table 2.3). Of the forest converted to cropland (Table 2.4), most went to sugarcane (around 3,439 ha), followed by para rubber (2,205 ha) and cassava (1,795 ha). Although forest, grassland, and wetland areas were converted to cropland in the province, the total cropland area still declined by 6,971 ha due to cropland conversions into grassland, forest, and settlements (Table 2.2 and Table 2.3). Rice and other crops, including mixed field crops were the only two sub-categories that decreased from 2006 to 2015, while sugarcane, cassava, para rubber, eucalyptus, and mango increased during this time period (Table 2.2). Based on the limited data available, the classification of land use in 2006 has less detail than in 2015, thus there is the strong possibility that some polygons in more aggregate classes (in 2006), such as the mixed field crops category, were split into many crops such as sugarcane, cassava, and para rubber in 2015 (Table 2.4). As a result, the implied reduction in area of mixed field crops may not be real.
Table 2.3: Land use change from 2006 to 2015 by the six main categories (hectare)
2015
2006 forest cropland grassland settlement wetland other forest 82,702 9,301 1,992 1,182 - 1,023 cropland 5,697 488,180 6,682 4,324 - 641 grassland 1,279 4,347 5,701 366 127 58 settlement 322 1,456 101 29,494 105 13 wetland 45 1,967 678 786 41,007 34 other - 42 10 2 2 174
29
Table 2.4: Land use change from 2006 to 2015 by sub-category(hectare)
The historical forest trend in Thailand from 1961 to 2016 (Fig. 2.11) showed that the forest area for the entire country has declined since 1961. It went down from 27,362,850 ha in 1961 to 16,347,969 ha in 2016 (Office of the Forestland Management, Thailand, 2017; Charuppat, 1998; Lakanavichian, 2001). As can be seen in the Figure 2.11, forestland saw an apparent sharp increase in 2000. However, this apparent change may not be real due to inconsistencies in the land use/land cover interpretation based on the satellite images and the field survey information (Lakanavichian, 2006). Furthermore, Wongsaichue (2010) indicated that there was an increasing trend towards planting orchard and perennial trees between 1986 to 2006, while paddy fields and other cropland areas decreased. Therefore, it is possible that some perennial plantations were combined into the forestland during the interpretation of the satellite images. If this is the case, then it would explain the sharp increase noted between the late 1990s and early 2000s in forestland.
2015
2006 forest rice cassava eucalyptus para rubber sugarcane other crops grassland shrubland mixed field crop forest 83,189 1,365 1,795 493 2,205 3,439 46 213 1,737 -rice 551 272,242 2,240 1,464 2,106 15,759 329 291 1,264 - cassava 771 613 17,873 1,594 7,191 17,773 193 134 208 -eucalyptus 435 74 356 1,171 334 362 80 49 13 -para rubber 359 20 274 392 2,226 202 86 2 8 -sugarcane 252 784 6,582 1,188 6,428 28,703 258 43 149 - other crops 484 18 160 154 133 127 142 16 47 -grassland 143 172 42 26 18 224 0 282 124 -shrubland 1,131 816 705 474 383 1,151 36 70 4,820 -mixed field crop 2,874 5,552 22,145 5,127 12,123 52,976 944 881 2,708
-30
Figure 2.11: The historical forest area trend from 1961 to 2016 in Thailand (Office of the Forestland Management, Thailand, 2017).
Thailand has been one of the top three rice exporting countries (International Trade Centre, 2017) and rice cultivation still makes up the biggest proportion of cropland in the Kalasin province (Table 2.2). However, the area under rice fell by 3% between 2006 and 2015 whereas sugarcane and cassava increased by 15% and 1.3%, respectively. FAO (2018) reported that world prices for rice have decreased since 2012. In contrast, global sugar consumption has been increasing since 2009, due in part to increased use of sugarcane for ethanol production. As a result of the world sugar price increasing (United States Department of Agriculture, 2017) the prices in Thailand have increased since 2009 (Fig. 2.12). Thus, it is very probable that the changes in the price and demand for specific agricultural products has driven much of the observed land use conversion. Over the nine years considered here, paddy field converted to sugarcane amounted to 15,759 ha, with smaller areas converted to cassava and para rubber (Table 2.4). Similar to paddy field conversion, cassava and shrubland were also converted to sugarcane which accounts for the bulk of the land conversion from cassava and shrubland areas (Table 2.4).
5,000,000 10,000,000 15,000,000 20,000,000 25,000,000 30,000,000 1960 1963 1966 1969 1972 1975 1978 1981 1984 1987 1990 1993 1996 1999 2002 2005 2008 2011 2014 2017 Fores t Are a in T h aila n d (h a) Year
31
Figure 2.12: Average yearly price of sugarcane and cassava in Thailand from 1997 to 2017 (Office of Agricultural Economics of Thailand, 2017).
The area covered by grasslands in the Kalasin province, including hay fields, pasture, shrubland, abandoned paddy fields, abandoned field crop, and other abandoned areas occupied 15,252 ha in 2015, an increase of 3,305 ha since 2006 (Table 2.2). Over that period, about 37% of the grassland in 2006 (4,347 ha) was transformed into cropland, while 48% (5,701 ha) of grassland was unchanged. However, a large area (6,682 ha) of cropland, including mixed field crops and paddy fields, as well as some forest, were changed to grassland, resulting in the net overall increase in the area covered by grasslands.
As described in the previous section, the settlement area of the Kalasin province increased by 5,430 ha over the nine years considered, including increases in urban and commercial areas, factories, institution lands, barns, villages, and fish farms. The Department of Provincial Administration, Ministry of Interior, Thailand (2006-2015) reported that the population in the Kalasin province increased by 9,641 people (from 975,526 people in 2006 to 985,203 people in 2015), which helped to drive an increase in the settlement area. In addition, fish production in the Kalasin province has grown since 2001, which can be observed in the growth of land area classified
0 500 1000 1500 2000 2500 3000 1996 1998 2000 2002 2004 2006 2008 2010 2012 2014 2016 2018 Price (B ah t/t o n ) Year Sugarcane Cassava
32
as fish pond. Moreover, as described in the introduction, the Kalasin province had the strategy to improve production of agricultural products from 2011 to 2014. As a result, factory and agricultural product trading centers increased in support of increased marketing and trading of agricultural products, in line with the government policies. It should be noted that there are more land use details included on the land use map for 2015 than 2006. Categories included in 2015, but missing in 2006 are the sub-categories of pasture, grass plantation, bus station, railway station, harbor, resort, hotel and guesthouse. It is clear that there are more details in the 2015 than 2006 maps, most likely due to the higher resolution of the imagery, the air photos and orthophotos used in 2015 as compared to the data sources for 2006, which was Landsat 5 TM imagery.
The wetland land use of the Kalasin province, including reservoirs, rivers, canals, lakes, irrigation canals, farm ponds, marsh and swamp increased by 3,054 ha. The main increase was in area devoted to farm ponds, lakes, marsh and swamp. The Land Development Department of Thailand (2015) assisted with farm pond creation to help the farmers cope with drought problems. Additionally, The Geo-Informatics and Space Technology Development Agency of Thailand (2011) reported severe flooding in the Kalasin. Thus, there is a possibility that part of the increased area of marsh and swamp in 2015 may have been a consequence of the large floods in 2011.
For all cropland sub-categories conversions are significant and mentioned above. Maps are provided in the appendix section, including forestland, rice paddy, sugarcane, cassava, para rubber, and annual crops conversions
33 SOIL FERTILITY, SOIL TEXTURE AND LAND USE
Figure 2.13 shows the soil texture map of the Kalasin province, which was developed from the soil series and soil order maps obtained from Land Development Department (2015).
Figure 2.13: Soil texture map of the Kalasin province, Thailand (Land Development Department of Thailand, 2015).
Loamy sand occupies the largest percentage of different texture types (59% of the area) found in the Kalasin province, followed by sandy loam, loam, sandy clay loam, clay loam, clay, silty clay loam, and sand (Fig. 2.4). Around 11% of the land area has no reported soil texture, including rock out crop, cliff, slope complex areas, and water surfaces.
After considering land use in relation to the soil texture map, it was found that 40% of loamy sand texture was under rice paddy area in 2006, followed by 21% of other annual crops, such as mixed field crops, watermelon and corn being grown on loamy sand textured soil in 2006. In 2015 the largest area of land use on loamy sand texture was rice field (37%), followed by
34
sugarcane (25%). Moreover, most of cassava, sugarcane, rice, para rubber, and eucalyptus in the Kalasin province is grown on loamy sand texture.
Soil fertility in the Kalasin province is divided into three categories: low fertility, moderate fertility, and unknown fertility areas of which include rock out crops, cliffs, complex slope areas, and water areas (Fig. 2.14). The largest area of the province, about 80% of the total area, is classified as having low soil fertility. Ten percent of the Kalasin province is classified as having moderate soil fertility and another 10% is unknown. Figure 2.5 shows that most of the soil in the Kalasin province are classified as low fertility. However, 44% of the soil in the study area has moderate organic matter (1.5-3.5% OM), and 45% of the soil has low organic matter (< 1.5% OM).
Figure 2.14: Soil fertility map of the Kalasin province, Thailand (Land Development Department of Thailand, 2015).
When investigating land use in conjunction with soil fertility in the study area, it was found that the largest amount of low fertility area in the province was used for growing rice (44%), followed by mixed annual crops (20%), forest (9%), cassava (8%), sugarcane (8%), settlement (6%), and other lands; para rubber, other perennial crops, and grassland covered 5% of this area in
35
2006. The largest area of land use associated with low soil fertility areas in the province in 2015 was rice (41%), which is a decrease in area by 3% from the 2006 data. This land use was followed by sugarcane (22%), cassava (9%), forest (8%), settlement (7%), para rubber (6%), and other lands; eucalyptus, other perennial crops, and grassland (7%). Area planted in sugarcane increased the most on the low soil fertility area from 2006 when 8% of the low soil fertility area was around 8% to 22% in 2015.
Ninety percent of the area under moderate soil fertility was used for rice paddy in 2006. Interestingly, 4% of this land was covered by settlement area, and this increased to 6% when combined with other lands such as forest, mixed annual crops, sugarcane, cassava, para rubber, and eucalyptus. In 2015, the area of rice paddy on moderate soil fertility land decreased 4% from 2006 (86%), while the area of moderate soil fertility land used for settlement increased to 5%.
It is found that there are loam, clay loam, clay, silty clay loam, and sandy clay loam soils in the areas of moderate soil fertility, which is largely in the south of the study area. Generally, the soil texture types that are able to best store nutrients and water are the heavier textured loam, clay loam, clay, silty clay loam, and sandy clay loam. It is clear that the south zone of the Kalasin province is the most suitable area to grow many crops such as rice, sugarcane, and para rubber because it is covered by good soil quality. However, in the low soil fertility areas, there are areas of loamy sand, sandy loam, sandy clay loam, loam and sand texture soils, most of which are found in the northern, eastern, western, and central areas of the province.
Most of soils in the area in the north zone of the Kalasin province lack nutrients because the soil parent materials in the area are derived from sedimentary rocks which have a low concentration of plant essential elements. Hence, soils are predominately sandy texture, with low fertility, low organic matter content and poor water retention capacity. As shown in Figures 2.13
36
and 2.14, the southern part of the province has higher soil fertility than other parts due to the finer textured soils. Moreover, the forest and flood plain areas also have moderate soil fertility because of finer textured (clay) soils in the area. Saline soils are also a problem in this province, due in part to unfavorable soil parent material as well as unsuitable management practices. Arunin and Pongwichian (2015) report that there are inland salt-affected soils in the northeastern region of Thailand make up almost 2 million ha and 75% of the salt-affected soils in the region are used for rice paddy. Some soil series in the study area are shallow such that root growth is negatively impacted and some soils contain high amount of coarse fragments, with gravel and rock fragments making up 35% or more of the soil volume.
THE EAST-WEST ECONOMIC CORRIDOR AND LAND USE CONVERSION
The buffer zone of the EWEC described in the methods section comprises around 26% (178,234 ha) of the land area of the Kalasin province. About 8% (14,004 ha) of the total area in the buffer zone was converted from one land use to another between 2006 and 2015 (Fig. 1.25). The largest land use conversion was from cropland to settlement, making up around 2,295 ha. Interestingly, the percentage of total area converted from cropland converted to settlement in the buffer zone (1.3%) was higher than the percentage of the area converted from cropland to settlement over entire province (0.9%), suggesting that the EWEC stimulated more urban area demand around the economic routes than in other parts of the province.
37
Fig 2.15: Land use change map in the 5 km buffer zone of the Kalasin province, Thailand between 2006 to 2015 (Land Development Department of Thailand, 2015; Department of Provincial Adminictration of Thailand, 2013).
The second-largest land use change area in the buffer zone was the change from cropland to grassland, comprising around 1.2% of the buffer zone area. This also is larger than the change from, cropland to grassland in the entire province (1%). Since the roads and economic activities were developed, there are more commercial opportunities and more markets along the corridor. It is possible that the grassland, which increased from 2006 might be land prepared for urban area to support population growth and settlement area demand that is expected to increase in the future. According to Sithilert (2015), the economic stimulation associated with the EWEC has led to increase income distribution and poverty reduction. Sithilert (2015) also notes that the corridor not only increased investment between countries, but also infrastructure development along the routes. If this is the case, then the EWEC is likely a main factor driving the land use changes observed between 2006 and 2015 in the Kalasin province.
38
Other land use changes are in-line with changes found province wide. Over 2,600 ha of rice paddy was converted to sugarcane in the buffer zone, which was the largest of the land conversions between cropland types. Additionally, 1,520 ha of rice fields were converted to settlement. Although the rice land conversion in the EWEC buffer zone was only 0.9% of all the buffer area, it contains a significant transformation from rice paddy to settlement which was the largest area of land uses converted to settlement in the EWEC.
Similar to the area of rice converted to sugarcane, cassava area converted to sugarcane made up 2,222 ha, which was also a large area. Forestland in the buffer zone was converted to other land uses. A total of 2,011 ha of forestland was converted to sugarcane, para rubber, settlement, and grassland.
As described above, the transformation in the EWEC from 2006 to 2015 had generally similar land use changes as the overall the Kalasin province. Areas of cropland saw the most land use changes and these changes were largely to sugarcane areas. Therefore, it is not only the road building and improvement which connect between rural area and market could impact to land use of the people in the economic route area, but also the farmers and cultivation trends in the province as a whole.
CONCLUSION
The largest land use changes in the Kalasin province from 2006 to 2015 was the forestland converted to cropland, including to sugarcane, para rubber, cassava, rice field, eucalyptus, and other crops. However, based on the limited data available, the classification of land use in 2006 has less detail than in 2015, thus there is the strong possibility that some polygons in more
39
aggregate classes (in 2006), such as the mixed field crops category, were split into many crops such as sugarcane, cassava, and para rubber in 2015 (Table 2.4). As a result, the implied reduction in area of mixed field crops may not be real. According to Lakanavichian (2006), The historical forest trend in Thailand had a sharp increase in 2000 (Fig. 2.11), which might be unrealistic. Therefore, it is possible that the land use/land cover interpretation based on the satellite images and the field survey information might be inconsistent. Furthermore, Wongsaichue (2010) indicated that there was an increasing trend towards planting orchard and perennial trees between 1986 to 2006, while paddy fields and other cropland areas decreased. Therefore, it is possible that some perennial plantations were combined into the forestland during the interpretation of the satellite images. If this is the case, then it would explain the sharp increase noted between the late 1990s and early 2000s in forestland.
It should be noted that there are more land use details included on the land use map for 2015 than 2006. Categories included in 2015, but missing in 2006 are the sub-categories of pasture, grass plantation, bus station, railway station, harbor, resort, hotel and guesthouse. It is clear that there are more details in the 2015 than 2006 maps, most likely due to the higher resolution of the imagery, the air photos and orthophotos used in 2015 as compared to the data sources for 2006, which was Landsat 5 TM imagery.
In both years the largest sub-category of cropland was paddy field, followed by sugarcane. More than 33,000 ha of cassava and rice fields were planted in sugarcane, tracking increases in the world price of sugarcane, the domestic sugar price, and overall increasing demand. The trend of increased area under sugarcane also coincides with the construction of five new sugar factories in northeastern Thailand (Office of the Cane and Sugar board, Thailand, 2016) in order to support increased consumption in the future.
40
In general, there are several factors that affect land use conversion including physical factors and economic and social factors.
PHYSICAL FACTORS
In high land areas, there was considerable land use conversion from field crops to para rubber while in the lowland areas of the south zone, there was not much land use change. Since the Kalasin province has a huge reservoir in the north called the Lum Pao Dam, there are many plantation areas in the high land near the reservoir. Although the paddy field area declined between 2006 and 2015, there was an increase in aquaculture production including giant freshwater prawn production and many species of freshwater fish due to the plentiful water resources in the province. In addition, the location of factory and product trading centers is also an important factor for land use decision making. Transport routes connecting cultivation areas and markets have a significant impact on land conversion. Moreover, soil conditions for different land uses can aid in interpreting patterns of land use change and can aid in future sustainable land use planning by matching soil types with suitable land uses to get the most sustainable and most economical outcomes.
ECONOMIC AND SOCIAL FACTORS
The population of the Kalasin province has increased and the urban area has been expanded while the demand for agricultural land has also risen. Hence, predominately forest area and some miscellaneous areas provided the land for agriculture and settlement expansion. These activities
41
can lead to deforestation and unsuitable land use, leading to land degradation, soil organic matter depletion, and poor soil quality.
Government policies can lead directly to land use change. For example, the development and implementation of agricultural production policies, reservoir projects, and support of local business development are among the main factors influencing farmers’ decisions to grow cash crops.
Global and domestic markets are also factors that can influence land use change. For instance, sugarcane area increased during the same time period that Thailand increased sugar exports, beginning in 2008 (Office of Thai Agricultural Economics, 2010). Since there was more demand for sugar, the area planted in sugarcane increased. Furthermore, the success of some farmers, to change farming patterns. This leads to land use changes and may lead to deforestation due to the demand for more agricultural lands.