133 Bruno Grawitz Thomas Dubreuil3
Jacques Sau4 ABSTRACT
In Jordan, water requirements are growing sharply, due to population growths, associated to the industrialization and the development of the country. Moreover, water resources are limited and subject to competitive use with neighboring countries.
The King Abdullah Canal (KAC) takes mainly the water in the Yarmouk and Zarqa Rivers, supplies the irrigation of 30000 ha and transfers water to Amman for domestic and industrial needs.
The KAC main structures are monitored and remotely controlled from a General Control Center through a SCADA system which includes a regulation module providing automatic and permanent control of canal flows as well as safety systems.
In canal systems, discharge measurements are fundamental. However,
measurement network on hydraulic systems include many sensors spread over a large area, and subject to failure or deviation. In addition discharge and volume measurements in open channel are characterized by large uncertainties.
The KAC SCADA system is operational since 7 years, and a large database of measurements on the canal system is available. A review of flow measurements is made, with an analysis of the uncertainties coming from the use of gate laws. The analysis includes a comparison of the results given by different algorithms:
1 Société du Canal de Provence, Le Tholonet - CS 70064 13182 Aix-en-Provence, cedex 5, France, Tel : +33 4 42 66 70 00 – Fax : + 33 4 42 66 70 80 – e-mail : franck.sanfilippo@canal-de-provence.com
2 Société du Canal de Provence, Le Tholonet - CS 70064 13182
Aix-en-Provence, cedex 5, France, Tel : +33 4 42 66 70 00 – Fax : + 33 4 42 66 70 80 – e-mail : bruno.grawitz@canal-de-provence.com
3 Thomas Dubreuil, 8 rue Rivet 69001 Lyon, France. Tel : +33 6 75 47 74 09 e-mail: thomdub69@hotmail.fr
4 LMFA UMR 5509, Université Claude Bernard Lyon 1, F- 69622 Villeurbanne Cedex, Tel :+33 4 72 44 83 73 – Fax :+33 4 72 43 12 25– e-mail :
Cemagref algorithm implemented in SIC software, USBR gate law, classical free flow and submerged flow orifice law. In the analysis, one of the KAC check gate appears to behave abnormally, with a systematic overestimation of the discharge. Analysis of flow measurements on field have been undertaken, as well as flow estimation based on open channel simulations using SIC software. This complete analysis provides relevant conclusions on the coherence of flow measurements.
INTRODUCTION
Radial gates are widely used as water control structures. They also offer the ability to discharge measurements. However, it must be understood that these two functionalities have not exactly the same specifications and constraints. In
automatic control, one is mainly interested by the control of hydraulic variables (levels for example) and the feedback loop is expected to do the job. A gate equation is used for the design of the control, but a high accuracy is not really needed. On the other hand, if accurate water deliveries are needed, calibration of radial gates become a challenging task, since they offer the opportunity to perform discharge measurements. The equations for free flow mode are usually simple, accurate enough and easy to use. However this working mode is not always possible for radial gates. On KAC North Branch, which is the subject of this analysis, the cross structures are most of the time in submerged mode. The KAC SCADA system is operational for 7 years, and a large database of measurements on the canal system is available. A review of flow measurements can then be performed. The gate equation used is the Cemagref algorithm
implemented in SIC software (Baume 1997). The aim of this work is the analysis of discharge measurements given by gate equations on cross structures. This analysis will use also the discharge values given by flow meters on the KAC offtakes. In the analysis, one gate appears to behave abnormally, with a
systematic overestimation of the discharge. We shall then investigate the role of gate equation used in submerged mode;
This work concerns the North part of the KAC which will be briefly described in the next section. An analysis of the measured discharges, based on a volume balance method, will be undertaken in the third section. The fourth section will be devoted to examination of gate equations in the case of KAC hydraulic working conditions.
THE KAC NORTH BRANCH
The King Abdullah Canal is located in the East of Jordan. It mainly supplies water to 22,800 ha of farmland, and to the town of Amman. It is 110 km long, with a maximum head flow of 17 m3/s. It includes 37 gates not all motor-driven and remotely controlled. Most of the irrigation networks are pipe pressurized networks.
The KAC is divided in two distinct sections: the North section and the South section. The North section includes 24 gates, of which 17 controlled. The North section feeds the south section through a downstream gate (check gate 25) discharging into a siphon followed by the calibrated weir of Abu Zeghan The North branch is supplied mainly by the Yarmouk river, the Mukheibeh underground water and the KAC conveyor which can take water from Tiberiade Lake.
The Ammam offtake is located on the last reach of the North branch, downstream of check gate 24.
Most of the time, gate 25 is closed. The two branches really communicate from time to time when transfer of large amount of water from North to South is needed.
DISCHARGE MEASUREMENT ANALYSIS
Different type of measurements are performed by sensors all along the KAC. Level measurements are performed upstream and downstream levels on cross structures. Intermediate level measurements on interesting points are also performed. These measurements are used for flow calculation and reach volume estimation. They are stored in real time and archived on a quarter an hour period. Starting from the data recorded in the SCADA database, an analysis of discharge measurements has been undertaken. The aim of this study is to bring to the fore possible inconsistencies in discharge measurements. It will lead to review of gate laws for flow measurements and their ability to accurately measure discharge at water control structures. It will lead also to a better knowledge of the on-field operations and maintenance actions.
Analysis of Transiting Discharge
Volume balance method: In the selected periods, gate 25, downstream of the North Branch of the KAC, is most of time closed. On the other hand, the offtakes on this branch are equipped with electromagnetic flowmeters, which provide high
confidence on offtake flow measurements. In order to validate discharge
measurements by a given gate, daily volume balance can then be performed in the following way: For a given gate i , the branch part between this gate and gate 25,
downstream of the branch is selected. Let us then call: - V the total volume leaving this part during a day i
- V and B0 VBT , respectively the volumes of water at the beginning and at the end of the day. These volumes can be estimated by a now well established procedure in use at Societé de Canal de Provence for a long time (Rogier 1987, Viala 2003).
In fact these volumes could be neglected, since they are of an order of magnitude smaller than the transiting volume V , i
The average discharge transiting through gate i , is given by the relation:
T V V V Q i T Mi 0 − + =
This value can be compared to the corresponding one, Q , given by flow Gi
measurements from gate law.
Application on Normal period: We have performed this analysis on a normal period, corresponding to the usual working conditions of the Canal (95 % of the time). As typical illustrative example, we present here the analysis on April 2006 and for gates 18, 21 and 24. The average daily discharges Q , together with the Gi
deviation QGi −QMi are depicted figure 1. Table 1 gives quantitatively the average relative difference value for the period.
0 5 10 15 20 25 30 0 2 4 6 Di s c h a rg e Gate 18 Gate 21 Gate 24 0 5 10 15 20 25 30 -2 0 2 4 D e vi at io n day
Figure 1. Gate discharges and discharge deviations Table 1. Relative deviation
Gate Average Deviation %
18 11 21 13 24 31
The gates are working on submerged flow conditions. One can observe that the mean over all variation of the deviation follows the discharge variation. For gate 18 and 21, and it is also the case for gates 19 and 22, the deviation is consistent with the expected uncertainties of gate laws. However gate 24 shows a too large deviation and always positive QGi −QMi. This point will be investigated more particularly in the following section.
Application on a peak transiting discharge case: We select now a period with a transiting peak discharge. Figure 2 shows the average daily discharges Q and Mi
Gi
Q , and the deviation QMi −QGi on February 2006. Table 2 gives quantitatively the mean relative difference value for this period.
0 5 10 15 20 25 30 0 1 2 3 4 Di s c h a rg e Gate 18 Gate 21 Gate 24 0 5 10 15 20 25 30 -2 0 2 4 D e vi at io n day
Figure 2:Gate discharges and discharge deviations Table 2: Relative deviation
Same conclusion as in the previous paragraph arises: the gate 24 too large overestimation of discharge appears clearly. In order to examine more precisely the peak event, figure 3 shows more particularly what happens on February 9-11. One can observe on the graph the three hours transiting time between gate 18 and
Gate Average Deviation %
18 -2 %
21 17 %
gate 24. In the same graph is also drawn the sum of Amman offtake and Abou Zeghan weir values. Gate 24 discharge is then expected to be close to this value, which is not the case, although the variations are consistent.
0 10 20 30 40 50 60 70 80 0 2 4 6 8 10 Time (Hours) D isch ar g e ( m 3 /s ) Gate 18 Gate 24 Amman+Abou Zeg.
Figure 3. The peak discharge on February 9-11 2006
Dynamical Reconstruction of Gate 24 Discharge: The KAC has been modelled with SIC software. We have then at our disposal, the model of the last reach,
downstream gate 24. On the other hand, in the data base the history of the
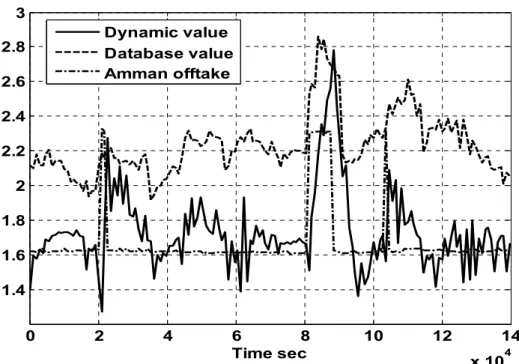
downstream level of the reach, and the offtake discharge values are recorded. We have then designed a tracking control of the known downstream level, with command variable the upstream discharge. This command has been implemented in SIC. The obtained discharge command represents then the needed discharge in order to get the downstream level history, in the physical conditions close to the real ones. The aim of this study in transient hydraulic conditions, is to confirm the daily volume balance analysis. Figure 4 shows a typical result, concerning a period with an important Amman water demand.
0 2 4 6 8 10 12 14 x 104 1.4 1.6 1.8 2 2.2 2.4 2.6 2.8 3 Time sec Dynamic value Database value Amman offtake
Figure 4. Comparison between database value and dynamically reconstructed discharge
This transient analysis confirms the daily volume balance study. The
overestimation of the discharge by gate 24 appears clearly. However the relative variations are well reproduced. A correct treatment of this problem would have been a design of a non linear observer. This work is currently in progress.
GATE LAWS ANALYSIS
The disagreement in discharge balance observed for gate 24, leads us to take interest in the gate equations. The gate equation implemented in the KAC SCADA system is the CEMAGREF gate equation (Baume 1997). This equation has the advantage to provide continuous transition between different flow regimes: open channel (upstream level lower than gate opening) - free flow - submerged flow-over flow conditions. The analysis we present in this work is the comparison between this equation and the simple usual orifice equation in the free flow and submerged flow regimes. We also have performed the comparison with the USBR proposition(Buyaski 1983) to these same hydraulic conditions.
Recently a so called E-M procedure has been proposed (Clemmens 2003) for submerged radial gate. It is our project to extend our study with these new algorithms and including other on field data.
Gate equations
The detailed Cemagref equation can be found in (Baume 1997). The basic
principle is to deduce the gate discharge from two weir discharge difference. The various coefficients which appear in the formulae are adjusted in order to provide continuity between the different flow regimes. Consequently the user can adjust only one global effective discharge coefficient, taken usually around 0.6.
The USBR gate equation can be found in (Buyaski 1983). The equation is obtained from a-dimensional analysis based on the geometrical characteristics of the radial gate. A series of 2647 tests conducted at the USBR Water Resources Laboratory with different geometries, seal type and gate opening permitted to fix the parameters of the algorithm. Although the KAC gates are not strictly in the specified validity domain, we use the sharp-edge equation since we are mainly interested in the general variation trend.
The classical (Lefebre 1986, Lencastre 1986) orifice formulae are written: gH
Lw C
Q= D 2
Where L is the gate width, w the gate opening, CD the discharge coefficient and
2 /
1 w
h H = −
In free flow mode and
2
1 h
h H = −
In submerged flow mode, h1 et h2 being respectively the upstream and downstream water levels.
Discharge calculations
The calculated discharge given by these three equations can be compared. We use here the gate 21 characteristics. In a typical free flow mode, see figure 5, the response discharges are almost identical.
0 0.1 0.2 0.3 0.4 0.5 0 1 2 3 4 5 6 7 8 Gate Opening (m) D isc h ar g e ( m 3 /s ) Cemagref USBR Orifice Figure 5.
In submerged flow mode, Figure 6, the responses agree but for the orifice law, the discharge coefficient must vary from 0.6 to 0.8 in order to give consistent results with the two other equations.
0 0.1 0.2 0.3 0.4 0.5 0 0.5 1 1.5 2 2.5 3 Gate Opening (m) D ischar ge ( m 3 /s ) Cemagref USBR Orifice Figure 6.
We have also proceeded to a scan of the modes, discharge versus opening for different (h1,h2) values. Figure 7 presents an illustrative case. Only Cemagref equation is able to propose continuity from free flow to submerged flow regime. It is also the only equation which is able to continuously make the transition to open channel mode, which also prevents the divergences at large gate openings which are seen on the other equations. Nevertheless a non physical decrease of the discharge appears near the open channel transition. However one may think that such extreme modes occur rather scarcely.
0 0.5 1 1.5 2 2.5 0 5 10 15 20 25 30 Gate Opening (m) D isc h a rg e ( m 3 /s ) Cemagref USBR Orifice Partially submerged mode Figure 7.
We have finally performed a statistical uncertainty analysis. The problem is stated as follows: let us assume that the gate equation is right, what is then the
uncertainty on the calculated discharge caused by the uncertainties of the sensors. Level and opening values are supposed to be random normal variables. Since the relation giving the discharge is non linear, this last variable is not normal, but Monte-Carlo method gives a numerical way to reach the uncertainty of the discharge. The results are shown table 3, for the gate 21 on same hydraulic conditions for all equations.
Table 3.
Cemagref USBR Orifice
Discharge (m3/s) 4,12 4,65 4,16 Free flow Uncertainty (+/-) 3,0 % (+/-) 2,7 % (+/-) 3,1 % Discharge (m3/s) 2,65 2,60 2,64 Submerged flow Uncertainty (+/-) 11,3 % (+/-) 15,0 % (+/-) 14,7 %
As expected, the three algorithms give almost the same good result at free flow mode. These results deteriorate at submerged flow, although the Cemagref equation behaves a little better.
The general conclusion of this analysis is that the gate equations give similar results for the usual working conditions of the North Branch of the KAC. The abnormal over estimation of the discharge for gate 24 cannot be explained by the equation.
The abnormal behavior of Cemagref equation at large gate opening has been noticed above. On some period, for example on flooding period, a large quantity of water is transferred from the North Branch to the South one. Downstream gate 24, there is a good calibrated weir between the North and South parts, and the flowmeter of the Amman offtake. Therefore the discharge transiting beneath gate 24 can be rebuilt and compared to the one given by the Cemagref gate equation. During this event, gate 24 works at large gate opening. The consequence of the abnormal behavior of Cemagref equation is that, at the time of this event, gate 24 underestimates strongly the discharge. Figure 8 shows the comparison of gate 24 and Amman offtake plus Abu Zeghan weir discharges during March 2005 when a flood event took place.
0 20 40 60 80 100 120 140 160 180 200 0 2 4 6 8 10 12 Time (Hours) D isc ha rg e ( m 3 /s ) Gate 24 Amman+Abou Zeg.
Figure 8. Flood event SUMMARY
A good knowledge of the canal geometry and physics represents one of the means to improve the efficiency of a canal system. In this spirit, a complete analysis of discharge measurements has been performed, starting from the data recorded in the SCADA of the KAC. This study is also important, because it leads to a better knowledge of the on-field operations and maintenance actions. Moreover, the concluding results can be confirmed by fore coming on field observations. On the whole, the results are correct, except for one gate. Investigations for the reason of this failure, which seems not to be due to the used gate law, are in progress, Since radial gates are widely used for flow measurements, gate law able to work continuously with reasonable accuracy on all the working modes of the gate are then needed. We think that the problem is still open. Our project is to continue this work, taking into account new gate equations and also new data sets. Besides, starting from the measurements recorded in the database, we are interested to perform a dynamical re-estimation of the discharges on the canal, in transient mode, with the design of a non linear observer.
REFERENCES
Baume J.P., Malaterre P.O.M. (1997), SIC software, Theoretical User Book Buyalski C.P.,Discharge (1983), algorithms for canal radial gates, REC-ERC-83-9
Clemmens A.J., Strelkoff T.S., Replogle J.A.,( 2003),Calibration of Submeged Radial Gates, J of Hydraulic Engineering, Vol 129
SCP-Gersar, (1997),Detailed Design of the King Abdullah Canal, December 1997 Lefebvre J., (1986),Mesures des debits et des vitesses des fluids, Masson, Paris Lencastre A., (1986),Hydraulique Générale, Eyrolles, Paris
D. Rogier, C. Coeuret, J. Brémond (1987), Dynamic Regulation on the Canal de Provence »- Planning operation, rehabilitation and automation of irrigation water delivery systems, Portland, Oregon ASCE
Viala Y., Deltour J-L., Sanfilippo F., Sau J., (2003)A Smith Predictor
Implementation for Volume Control on a Canal de Provence Branch, USCID Coference, Phoenix, May 2003