Faculty of Technology and Society Department of Computer Science and Media Technology
Computer Science thesis 15 ECTS, Bachelor's level
The optimization of Database queries by using a dynamic caching policy on the application side of a system.
Martin Granbohm Marcus Nordin
Degree: Bachelor's, 180 ECTS Supervisor: Jesper Larsson Main research area: Computer Science Examiner: Yuji Dong
Program: Computer Systems Developer Date of final seminar: 2019-05-31
Sammandrag
Det är viktigare än någonsin att optimera svarstiden för databasförfrågningar då internettrafiken ökar och storleken på data växer. IT-företag har också blivit mer medvetna om vikten av att snabbt leverera innehåll till slutanvändaren på grund av hur långsammare svarstider kan påverka kvalitetsuppfattningen på en produkt/ett system. Detta kan i sin tur leda till en negativ påverkan på ett företags intäkter.
I det här arbetet utvecklar och implementerar vi en ny dynamisk cachelösning på applikationssidan av systemet och testar den mot väletablerade cache-strategier. Vi undersökte kända cache-strategier och relaterad forskning som tar hänsyn till den aktuella databasbelastningen så som historisk frekvens för en specifik databasförfrågan och tillämpade detta i vår algoritm. Vi utvecklade från detta en dynamisk cachepolicy som använder en logaritmisk beräkning som involverar den historiska frekvensen tillsammans med en databasförfrågans svarstid och beräknade en vikt för en viss databasförfrågan. Vikten ger sedan prioritet i förhållande till andra databasförfrågningar som är cachade. Vi kan här påvisa en prestandahöjning på 11-12% mot LRU, en prestandahöjning på 15% mot FIFO och en väsentlig prestandahöjning mot att använda databasen direkt med både MySQL-cache aktiverad och inaktiverad.
Nyckelord: Cache, Cachestrategi, LRU, FIFO, Databasoptimering, Cacheoptimering, ORM.
Abstract
With IP traffic and data sets continuously growing together with IT companies becoming more and more dependent on large data sets, it is more important than ever to optimize the load time of queries. IT companies have also become more aware of the importance of delivering content quickly to the end user because of how slower response times can affect quality perception which in turn can have a negative impact on revenue.
In this paper, we develop and implement a new dynamic cache management system with the cache on the application side of the system and test it against well-established caching policies. By looking at known caching strategies and research that takes the current database load into account with attributes such as a queries frequency and incorporating this into our algorithm, we developed a dynamic caching policy that utilizes a logarithmic calculation involving historical query frequency together with query response time to calculate a weight for a specific query. The weight gives priority in relation to other queries residing within the cache, which shows a performance increase towards existing caching policies. The results show that we have a 11-12 % performance increase towards LRU, a 15 % performance increase towards FIFO and a substantial performance increase towards using the database directly with both MySQL caching enabled and disabled.
Keywords: Cache, Cache policy, Cache manager, LRU, FIFO, Database optimization, Cache optimization, ORM.
Acknowledgments
We would like to thank our supervisor Jesper Larsson for guiding us in the creation of our paper, giving us valuable insight into how to write and structure our work and also for giving us both the technical and academic guidance that we needed for in what direction our paper should take.
Contents
1. Introduction ... 1
1.1 Problem statement ... 1
1.2 Background and terminology ... 2
1.3 Research Question ... 3 1.4 Scope ... 3 2. Related Work ... 4 2.1 Cache significance ... 4 2.2 Cache implementations ... 4 2.3 Our research ... 6 3. Method ... 7
3.1 Design and creation... 7
3.2 Experiment ... 7 3.3 Alternative methods... 8 4. Implementation ... 9 4.1 Tools ... 9 4.2 System ... 11 5. Experiment... 15 5.1 Policies ... 15 5.2 Experiment description ... 17 5.3 Testing ... 19 5.4 Measurement ... 21 6 Results... 22
6.1 Average Database Response Time ... 22
7 Discussion and analysis ... 29
7.1 Result analysis... 29 7.2 Overhead ... 29 7.3 Considerations ... 31 8. Summary ... 33 8.1 Future Work ... 33 9. References ... 35
1
1. Introduction
The growing size of data sets and the increase of internet traffic [1] will further increase the load on systems that have been growing steadily in both complexity and size over the past years [2]. This has led to databases becoming larger and larger. The problem with this is that as databases grow in size, it becomes harder to effectively manage and query the larger data sets in a reasonable amount of time. Today, different caching techniques are implemented to mitigate database load. There are different forms of cache being utilized in systems today. One of the most common ones is lower level cache, this can be found in e.g. database servers. There is also cache that is designed to be configured by the developer when the application is being written. This is what usually is referred to as application cache, which as Chen et al. stated, results in unnecessary overhead for the system since the application cache is harder to maintain [3]. We want to minimize this overhead and optimize the response time for frequent queries and queries that are deemed costly to a system. To optimize caching there are numerous approaches, all created with the same intent; To minimize redundant calculations and/or fetching of data to optimize the load time of requests. This often results in having to manually configure the caching policy to the confines of a certain system's properties.
To diverge from the use of standardized caching policies such as LRU (Least Recently Used), LIFO (Last In First Out) and FIFO (First In First Out), and instead calculate an individual weight of a query, we could make use of a dynamic threshold for what was allowed to reside within the cache. By looking at the query response time together with the historical query frequency, we wanted to have an algorithm devote it a caching priority allowing an individual weight of a query determine its significance in relation to what was already in the cache. With this, we wanted to let a cache, residing on the application side of the system, minimize unnecessary communication between the application and the MySQL database.
1.1 Problem statement
With growing IP traffic and expanding data sets, together with an escalating number of IT companies relying on large data sets this indicates a need for optimizing the load time of queries in the application cache. This in turn creates a need for minimizing the overhead of which this otherwise results in. As we will show in our section regarding related work, there are several existing studies that have different approaches in regard to optimizing the overall load time and/or fetching of data from the database. Many of these are also referring to the modification of the caching policy as one of the most crucial factors for the optimization and handling of larger data sets and in that, the reduction of load times for costly queries [3][4][5].
Several authors have indicated the significance of query frequency in the optimization of a database caching policy [6][7]. By adapting to the current database load, there could be conceivable enhancements in regard to performance and the diminishment of present overhead. Because of this, there
2
was an interest by us to research the implications of a cache, implemented on the application side that was dynamically allocated by an algorithm that incorporates query frequency.
This paper addresses how to effectively create an autonomous cache that prioritizes what queries should be cached on the application side of the system. Inspired by Rekha Singhal et al. model for calculating query cost [8], our algorithm uses predefined attributes like query cost to calculate the total cost of the query which later decides whether or not it should be cached.
1.2 Background and terminology
The main purpose of cache is often to reduce load or improve performance in some way, this is usually related to cost. More requests equal higher cost which results in solutions being geared towards reducing the amount of requests and in the same time improving performance [9].
Cache can be utilized in a myriad of different ways depending on the use case. This means that there are a lot of different ways to implement cache.
Web Cache
Web cache is generally referred to caching that is done to improve the delivery of web content by the use of different caching solutions. This is generally accomplished by using different forms of proxy cache. A proxy cache is when a cache resides on a different server from the webserver. The main objective of web cache is to reduce disk reads and improve latency. To achieve faster delivery of web content e.g. html, images, JavaScript etc. [10]
Integrated Cache
Integrated caching solutions are usually defined as cache which is used on lower levels in a system, an example of this would be database cache which is used inside the database to improve query performance. [10]
General Cache
General cache is when the type of data is not set, this results in the caching solution being broader and at a much higher level in the system it is being utilized in. This could for example be using a cache to show users a table of data quicker or it could be speeding up loading times of a data intensive page. [10] An example of general cache is using a Redis database that i.e. is an in-memory database [11].
3
The solution that was built in this research uses a form of general cache that can also be referred to as application cache. This is because the system we built uses a Redis cache database and it runs in the application layer of a system. We were interested in optimizing database queries through a more general approach using application cache and a more dynamic caching policy.
1.3 Research Question
To what extent can a dynamic caching policy, implemented in the application cache of a web system, optimize the query response time compared to standard caching policies.
1.4 Scope
The scope of this study, as stated by the research question, is the viability of an application-side cache ruled by an algorithm that given certain attributes gives a query a priority and decides whether or not it should be cached. With this, we do not aim to establish any all-embracing rules regarding what caching policy is the most optimal or any SQL-specific cache approaches but rather test our caching solution against known solutions in a specific use case. This with the intent of limiting the overall scope of the research, by using relevant traits from established existing caching policies. To limit our scope, we will not be handling any cache invalidation. Since we only want to determine whether this approach is more optimal or not, cache invalidation could be a part of a feasible end-product if one was to be created but will not be within the scope of this study due to the time-consuming aspects, and therefore, lies outside of our budget. Thus, to determine if there is a performance increase, the baseline data i.e. the initial collection that will serve as a basis for comparison, and the subsequent data collections will all be without the use of any cache invalidation principles. Our focus will therefore only include GET-queries.
Since our code is written within the Laravel framework and with the use of existing middleware and the frameworks ORM (Object Relational Mapping), no code will be directly applicable to any general database solution. This study aims to determine a proof of concept rather than to create a finished product.
4
2. Related Work
The research field concerning cache management and cache implementations is very broad due to its many areas of implementation and the importance it has for a system. The importance of utilizing a cache has brought on a lot of research in the area of cache optimization.
2.1 Cache significance
The dedication of optimizing World Wide Web caching by both academic and corporate communities has led to advances in web caching solutions when it comes to bandwidth savings, server load balancing, higher content availability and the perceived network latency reduction. Greg Berish et. al. presented a taxonomy of different web caching architectures and techniques and evaluated the implementations in relation to the need and constraints of the developer. They compared e.g. proxy caching, which is the implementation of a proxy between the server and the client against a more adaptive distributed web caching technique where the cache was based more on content demand together with different deployment options where the cache was implemented as in the positioning of the cache in relation to the client. They draw the conclusion that the deployment and implementation options of the cache is related to the deployment needs for a specific system and that there is still a demand to quantify the performance of various caching systems. [12]
The importance of reducing latency and load times have been proven to be important both in terms of user experience which directly affects usage of digital services and this in turn, affects the revenue of businesses. Dennis Guse et al. showed that load times of web pages correlated with quality perception [25]. Using cache to solve this issue has been shown to be the most successful solution [13].
A big problem with optimizing cache is accurately measuring different solutions, this in turn effects validity which is an important aspect for any research. Curtis Ray Welborn et al. created a testing protocol to try to solve this, by focusing on removing artifacts that could affect the results they created data that showed what types of standard caching solutions are better and in what aspects [5]. This relates to our research because we have, as Curtis Ray Welborn et al. focused on testing caching solutions against each other, this in turn results in problems with accurately measuring performance.
2.2 Cache implementations
There have been numerous studies done regarding optimizing the cache of a web system to yield a shorter response time [14][15][16]. Tolja et al. developed
5
a program called Ganesh that detects similarities in previous queries and upon detection of similarities and therefore redundancy, reconstructs the result by looking through a hash lookup cache of previous results [4]. Their approach had more focus on alleviating the system with a front-end solution as the browser had to have a Ganesh application installed. Our approach is more focused on a completely isolated backend solution. Using this approach, they had to have an application installed on the browser to alleviate the system with the hash lookup and a proxy on the server side communicating with this. As they concluded, this led to some overhead and was not always worth it in regard to the time programmers had to afford it and the fact that users had to have this application installed on their browser.
Even though we did not incorporate any machine learning (henceforth referred to as ML) in our system, we chose to look at it since it gave us an insight into different approaches in categorizing queries.
We chose to look at machine learning (henceforth referred to as ML) because we discovered similarities in what attributes ML analyzes upon calculating a queries importance. However, we did not incorporate any ML in our system, the reason being indications showing that ML in cache could be detrimental in regard to performance. Using different ML techniques Waleed Ali et al. showed that it is possible to create a proxy caching solution that has improved performance compared to a traditional proxy cache solution. They also showed that using good decision trees were a good ML method for this task. By using ML they effectively “guessed” what HTML object where a good fit to being cached. [13] Because we also focus on trying to “guess” what should be in the cache Waleed Ali et al. paper is a good resource to figuring out what attributes are important when creating a caching algorithm. With a greater time budget than is afforded to us at this time, it could yield interesting results to research the implications of ML further.
Pinqian Wang et. al. created a dynamic cache management solution that proposed an object-based buffer pool replacement algorithm. The algorithm used query frequency together with other metrics to assess what should be cached. They compared other known caching strategies like LRU, LFU (Least Frequently Used) and MRU (Most Recently Used) in an experiment that subsequently showed that a performance gain could be achieved. [6]
Tse-Hsun Chen et al. created a tool that identifies places in the code that access the database and where the access can be optimized it then uses its own algorithms to configure optimized code that it replaces the old code with. By doing this they were able to show that the tool increased database performance and efficiency compared to if a software developer would optimize it with a standard caching solution. [3] Our solution is similar to what Tse-Hsun Chen et al. caching optimizer does, the major difference is that our solution automates the cache optimizing and it utilizes a custom caching policy instead of using common policies.
H K Mehta et al. created a centralized caching solution using a database, this was done to address the issue in multi-tier applications having ineffective
6
database caches. The system according to them in their test would perform 38% better than using a standard SQL cache. [2] The test conducted by H K Mehta et al. is similar to ours because we both utilize a caching server to improve performance by utilizing the cache server before a database query is run. Wen-Syan Li et al. compares different popular caching architectures and identifies factors that affect different performance metrics, by doing this they were able to pinpoint what factors affect what, this is helpful in any cases where someone needs to performance gains of caching solutions. [9] In relation to our research this paper is a good way of identifying common caching techniques that could be used in comparison to our own solution.
2.3 Our research
To alleviate the load on the SQL server without affording the programmer to have to do any additional configurations, we wanted to implement a dynamic cache management solution that looked at the actual running database just as Pinqian Wang et. al. did [6]. However, we instead wanted to incorporate the historical frequency as a more substantially decisive factor together with the actual execution time for the query at that point of time. From looking into what Greg Berish et. al. concluded, that the implementation options of the caching solution in relation to the client is specific to the needs and constraints of the developer and address the issue in multi-tier applications having ineffective database caches [2], we wanted to utilize a centralized caching solution. Where the research done by Tse-Hsun Chun et. al. developed software that identified places in the code that could be optimized, we wanted to develop a caching solution that also accounted for the factor that pertains to a specific query under a certain database load. Therefore, this research focuses on the development of an adaptive/dynamic caching policy that accounts for the historical query frequency for a specific query and the correlated execution time that reflects the current database load, implemented on the application side of a system.
7
3. Method
Because of the nature of our research question there was a need to generate quantitative data in terms of performance gain. The research questions asked to determine any performance increase with the use of an application-side cache with an autonomous governing algorithm. We wanted to build upon existing strategies in a new environment thus creating a new artifact in the form of a prototype to determine a proof of concept. This in turn resulted in us deciding that using design and creation together with experiment would be an optimal approach as the two research methods often accompany each other [17] for such purposes. We decided to implement our solution using the framework Laravel for our design and creation. In our experiment, the aim was to generate sufficient quantitative data to answer our research questions.
3.1 Design and creation
Design and creation is a popular research method within the field of computer science. Design and creation focus on creating an IT “artifact” through an iterative process where a product or piece of software is developed [17]. We find that the method allows for a greater margin regarding innovation and exploration within the IT domain that other methods simply do not. The output of the method can be both practical in the form of a product/system, or theoretical in the form of a concept, or both [17].
One way of using design and creation is by using an IT application in a domain that has not been explored or automated [17]. Our research question focuses on implementing existing ideas in unexplored areas and trying to improve those ideas by creating a smarter caching policy. By comparing our solution with pre-existing caching strategies, we can get a good indicator to if our new system improves the current problem.
3.2 Experiment
Experiments can be used together with Design and Creation to evaluate the resulting artifact from the design and creation process. An experiment is used to evaluate a set of attributes, usually in a controlled environment.
Experiments measure and observe independent and dependent variables. The difference between these is that an independent variable when changed, affect the dependent variable though this is not true for the opposite, a dependent variable when it changes does not affect the independent variable. This is what is called cause and effect, where the cause is the independent variable and effect is the dependent variable [17]. In our research, we will conduct an experiment to measure and evaluate our IT artifact in a controlled environment. The output of the system will be theoretical since we will not be creating any finished
8
product or system but will rather determine proof of concept with the accompanying experimental phase. When combining these research methods, we were able to be in control of most of the aspects of the system and isolate both independent and dependent variables and exclude the impact these would have had on the result.
3.3 Alternative methods
There was no framework to our knowledge where we could build and test our custom caching policy with the use of application cache, in the application side of the system. For this, we had to develop a system that could accomplish this. Furthermore, we could think of no other method that would allow us to isolate affecting variables and generate sufficient quantitative data to establish a proof of concept other than Design and creation accompanied by an Experiment. Case study and Action research all require there to be a system already in place even to begin the study and even if so, it would not be applicable to answer our research questions. As to ethnography, there are no cultural or social aspects within the scope of what this research wants to answer. This made our choice of method apparent as there were no strong arguments to be made for any methods other than Design and Creation for the development of the system, accompanied by an Experiment to generate data.
9
4. Implementation
The system was implemented in the Laravel framework that is a framework for web development. The reasoning behind this was due to Laravel’s rich feature set that could be utilized to implement our solution efficiently within the Laravel framework.
4.1 Tools
Framework
Laravel is a popular web-development framework based on PHP and is widely used in the open source community. The framework that was selected for the purpose of developing the system and testing the concept was Laravel. Laravel was chosen because it is a popular framework for building web-based applications. The language used in Laravel is PHP, together with JavaScript. One of the reasons why we choose to use this framework was because it supports a wide variety of caching solutions through pre-existing drivers, this means that we were able to implement and test different caching solutions against each other in an effective way. It also supports an advanced faker system that can generate real-world data automatically, by using this we could create millions of rows of real data. This meant that the data set we got was as close to a real-world application as possible.
Oracle VM
VM (virtual machine) is used when a system needs to be exactly the same across different host computers, this is especially important when testing because each test needs to be reproducible. The system was set up on an Oracle VM using 8GB RAM and 4 cores with the application code residing in a Vagrant box called Homestead. This results in us being more confident that by testing on different testing setups we do not get differing results due to the environment setup as they are identical, which in turn improves the reproducibility of our experiment.
Vagrant
Vagrant boxes are preconfigured VM boxes that utilize the VM system to create a reproducible environment that is exactly the same regardless of what system it is run on [18].
10
Laravel Homestead
Laravel Homestead is the vagrant box that was used to run the system and its accompanying tests. The vagrant box includes all the parts that the system needs [19]. The parts that our system uses are:
• Ubuntu 18.04 • Git • PHP 7.1 • Nginx • MySQL • Composer • Redis
Queue workers
Laravel comes standard with a queue system that can utilize Redis as a queue driver. A queue driver in Laravel is code that abstracts the usage of a cache system and allows the programmer to not worry about the underlying cache system, this means that changing a config variable will change what cache system is being used by the framework e.g. Redis, Memcached without any code needing to be replaced. Using this queue driver, the system can push jobs that are solved asynchronously using queue workers running in the vagrant machine. All tests that were conducted in the experiment were run with two queue workers running as a daemon in the machine, the number of which can be altered to allow for more or less processing capabilities.
Redis
Redis is an in-memory data store that can be utilized in different ways like database, cache and/or message broker. Redis stands for remote dictionary server and keeps the entire data volume in memory which results in very fast read speeds. Redis can handle different kinds of data e.g. lists, maps, sets. Redis licenses its software with an open source license called BSD.[11] In our case, Redis is utilized as a key-value store for the cache, this can be replaced for another caching system like Memcached. Memcached is an in-memory data store that is similar to Redis. The key difference is that Redis is more feature rich. Both Redis and Memcached have sub-millisecond latency.[20][21]
11
Testing Hardware
The automated tests ran on two computers that shared similar specifications using the above mentioned VMs. Two hardware setups were used to increase the test capacity and it contributed to improving the external validity.
System 1 hardware specifications: • Intel core i7-8750H
• 16 GB, 2 × 8 GB, DDR4, 2 666 MHz • NVMe PCIe SSD
System 1 hardware specifications: • Intel core i7-6700HQ
• 16 GB, 2 × 8 GB, DDR4, 2 133MHz • SATA SSD
4.2 System
The system that was built contains two major parts. The first part is the ORM extension and the second is the query calculator. ORM or object-relational mapping is a term used to describe a system that abstracts database communication from specific query language like SQL into a specific coding language like PHP [22]. The ORM extension runs synchronously inline with the standard ORM which in this case means that when a query is handled it runs through each part. This results in a very small performance penalty in our ORM extension because it is doing extra checks in the form of cache controls. The performance penalty is only felt when running queries through our caching solution, though this is much smaller than the performance gain of the cache, it was therefore harder to measure.
The second part of the system is the query calculator, this part does not run synchronously with the query and therefore does not affect the runtime of the system, however it does affect their overall performance of the server it is running on because it does different calculations and operations. The penalty is only felt by the queue worker that handles the query calculation job which means that it can be “moved” to a different system and scaled according to the database load of the system. However, if the queue worker does not work quickly enough the performance of the custom cache solution would not be less than a standard LRU solution in the same environment.
12
ORM
When using an ORM the database tables are abstracted into logical objects that contain all the data from one row in the specified table by doing this a programmer does not need to deal with data formatting, it also improves readability because all queries are in a uniform coding language. The ORM is also responsible for handling the relations between tables, this means that accessing database relations become a relatively easy task. [22] In the case of Laravel, the ORM is an integral part of the system that handles all database communication and database relation mapping which further adds to as to why we chose this framework to implement our solution.
Implementation
The system that we built was integrated directly into the framework’s existing object-relational mapping. When queries are made against the system our solution becomes a layer between the database models and the actual database, this allows our solution to both receive data that the ORM already extracts from the query and it also allows the solution to access lower level data i.e. raw SQL. Using this data, we create an asynchronous job in the “get” part of the ORM, the job task is to use the data it gathered including the returned data from the database to make a decision if the query should be cached.
We also do a check to see if we already store that “get” in the cache and If the item is found in the cache the object is returned from the cache and JSON decoded and returned back into the ORM. By doing this the system “tricks” the ORM into thinking that is communicating with the database regardless if the data was retrieved from the cache or the database. This allows the solution to be added to any Laravel project in seconds. An added benefit to this is that because we have injected our solution into the frameworks ORM, whether or not the queried item is found in the cache or retrieved from the database, we can measure the query execution time and simply return it with the queried data. This data is then later sent into the job that decides whether or not it should be cached. See figure 4.1.
13
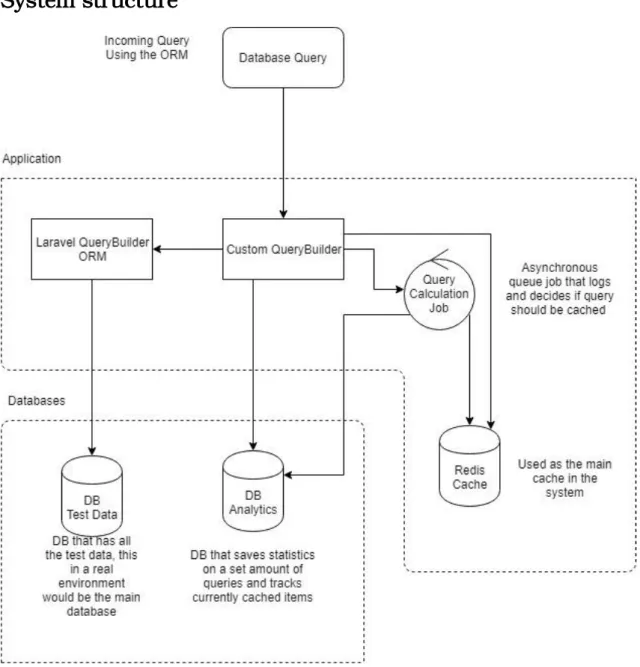
System structure
Figure 4.1: system diagram. The figure is an overview of the system solution that shows an abstract view of how all the parts communicate.
DB Test Data is used by the system as the main data store, this is what would be used in a real environment to store user data and other system related data. DB Analytics database is used by our solution to save a set amount of historical queries and also keep track of calculations that were made against a specific query in the cache. Redis Cache is used by the system as the main in-memory cache database. The cache is used by both the query calculation job and the query builder. The query calculation job decides what should be in the Redis cache whereas the query builder simply checks if the incoming query already exists in the cache. To do this the query calculation job uses the DB Analytics database to check what items exist in the cache and it also uses the same
14
database to get historical data on queries. The custom QueryBuilder is an extension of the frameworks query builder, its job is to extract the data needed by the query calculation job and to check if the query already exists in the cache, it is built on and therefore uses the standard Laravel query builder as a base.
15
5. Experiment
The experiment that was conducted included testing randomized queries that as close as possible resemble queries done in a real-world application. We did this by having a data set resembling that of a real-world application and a set of realistic test queries for that specific data set that were run in a randomized fashion. The caching policies we tested with were LRU (Least Recently Used), FIFO (First In First Out) and our custom caching policy. We also ran tests with the MySQL standard caching policy both enabled and disabled. The decision to include a “no cache” option was to give a fair and distinguishable comparison against the caching policies. The way a typical web system works is the queries are executed against the MySQL database which has a predefined caching policy in place. However, we tested both against the option of no cache in this database, and with the standard MySQL caching policy in place. The caching that is done within the system is as described earlier held on the application-side, in the application cache. With this we can thoroughly examine the query response time gain afforded by using caching on the application-side against standard MySQL caching both enabled and disabled, as well as fairly and distinctly compare how LRU and FIFO compares against our custom policy.
5.1 Policies
First In First Out
Just like a simple FIFO queue the algorithm keeps track of when the item was inserted and simply deletes the oldest item from the cache. This is how we implemented our FIFO algorithm and by keeping track of when an item was inserted, we delete the oldest one.
Least Recently Used
The LRU algorithm simply discards the least recently used item from the cache when the upper limit, i.e. the size of the cache is met. In contrast to FIFO, when an item is used, i.e. accessed through a GET request in our system, this accounts for a “usage” and the time for this is updated. This is also how our LRU algorithm is implemented. We keep track of when an item in the cache was inserted, or if accessed afterwards update this time. When the cache size limit is met, we delete the least recently used item from the cache.
Custom cache policy
Throughout the iterations of testing, we looked at how the different variables that affect the cache’s size and overall performance could have an impact on the dynamic mathematical function we wanted to have calculate the significance of a query. We looked at query frequency, i.e. the frequency of a specific query made to the database. The size, both the actual byte size of the database and table sizes, which is more connected to the number of cells, rows times columns
16
and the data type stored. We looked at something we called query complexity, which was an integer value of how many tables the query span over. If a query joined together two tables or used a many-to-many relation through a pivot table, this would then have added to the complexity number of that query. We concluded that to further complicate the policy and give it unnecessary overhead did not yield more positive results than a stronger focus on the more established variables that we know affect the cache performance and are already incorporated in other known caching policies [5]. Since we also wanted a dynamic value to determine the significance of a certain query and whether or not it should be cached, we decided to incorporate dependent variables that resulted from a query together with independent variables we asserted through testing. These together would then make up a comprehensible “weight” for a particular query.
The custom cache policy we developed was created to look at the collective significance of the query by evaluating certain parameters and by this determining the weight. This weight will later determine what will be inserted or removed from the cache:
• qf = The frequency of a certain query
We look at a significant range of the recent queries made to the database, and with a hash function generate a key from the raw SQL syntax and store it within our analytics portion of the database. From this we can identify how many times within this range, this particular query was executed.
• t = The query response time
For each query we calculate the response time, i.e. the time it takes from that of the query being made, to it returning with the queried item in seconds. For heavier queries this variable could grow quite large. Since caching is done for the main purpose of speeding something up, we did not want to diminish the importance of this property in the same way as with the frequency. In contrast this variable was sometimes very small and returned times as fast as 0.001 seconds. To not trivialize the frequency of a query, we decided to add the value of 1 to this variable so that even if the query is very quick, the frequency would still show significance, e.g. a frequent query of say f = 15 * t = 0.002, will prove insignificant as a result. • k = The constant factor to use with logarithmic function
To keep the weight variable from fluctuating up to abstruse numbers if its frequency was abnormal, we decided to use a logarithmic function to decide the weight of the query. The function; logk(qf) * (t + 1) or k * log2(qf) * (t + 1),
k for some constant, could be used for calculating the weight of a query. It would then do this without the consequence of, even if the frequency of a certain query was abnormally large, generate a weight so big that it could not be a lesser priority further down the road, for a more time-consuming query.
17
To determine the value of k to use as the factor (multiplier) as in “k * log2(x)”,
we tested the variable dynamically throughout our testing suite. We began with an initial large number for k, decreasing towards 0 and stored the values of when the average query response time was no longer improving towards LRU and/or FIFO. We then also started with an initial small number of 0 for k and increased it and also here stored the values of when it was no longer improving. This gave us an interval to test between. Further testing within this interval concluded that the number 0.53, approximate to using the base 3.7, was the most beneficial towards LRU and FIFO.
This concluded in the following mathematical calculation for deciding the weight of a query:
weight = 0,53 • log
2
(qf) * ( t + 1 )
5.2 Experiment description
To test our hypothesis and as a result our caching policy an experiment was as discussed earlier, a valid method. As Briony J Oates describes experiment: “an experiment is a strategy that investigates cause and effect relationships, seeking to prove or disprove a causal link between a factor and an observed outcome” [17]. We wanted to research whether or not a dynamic caching policy and a cache contained within the application cache could optimize the query response time for a system. Due to the artificial results that may be introduced by the controlled environment of an experiment, we constructed our testing with a reasonable amount of randomization to minimize this, as is described later on. For this thesis we wanted to collect data in a controlled environment rather than test it in any form of real-world application so that we could freeze the independent variables and give a fair and distinct interpretation of the data.
Validity
During the part of our experimental phase where we wanted to achieve a dynamic and representative weight for a certain query, we tested the independent variables with automated testing to ensure the internal validity of these parameters. As mentioned earlier we let the logarithmic base fluctuate from high-to-low and low-to-high to give us an interval to test. We continuously measured the average execution time for the different base values and concluded an optimal base.
Something to consider since we are in a controlled environment and we have a fixed data set, is that we can not ensure that this base is not an artificial result
18
as a consequence of our particular data set. Even though we used different data quantities and randomized queries, there is still a chance of the acquired base value proving to be different for other data sets. There is also a chance that the base we acquired was a local optima [23]. However, we identified a larger improvement of the query response time using our acquired base than we did when testing with larger base numbers. This is something that will be further discussed in future work.
Another parameter affecting the weight of any given query was the execution time. To ensure that any query was not trivialized due to its quick execution time we added a 1 to all execution time parameters upon its weight calculation. This gave the weight a more substantial overall validity.
When we had our base value and our function calculating the weight in its place, we also wanted to ensure the external validity through randomized testing upon different sizes of our data set.
Data sets
Figure 5.1: test database structure.
We wanted to create a data set with a comprehensible relational modularity and one that is often used in a real-world application. What came naturally was a sort of social platform for posting in different categories and commenting on said posts. All of this by users of different hierarchies or belonging do different
19
“groups”. For this we worked out the data set as seen in figure 5.1. We also wanted to be able to run tests on different quantities and on different hardware setups to contribute to the external validity. The different sized data sets are as follow: Data set 1: • 10373 Users • 311190 Posts • 1555950 Comments • 25 Groups • 25 Forums Data set 2: • 20000 Users • 600 000 Posts • 3 000 000 Comments • 25 Groups • 25 Forums
The second data set is approximately double the size of the first which is reflected in the query execution time later on.
5.3 Testing
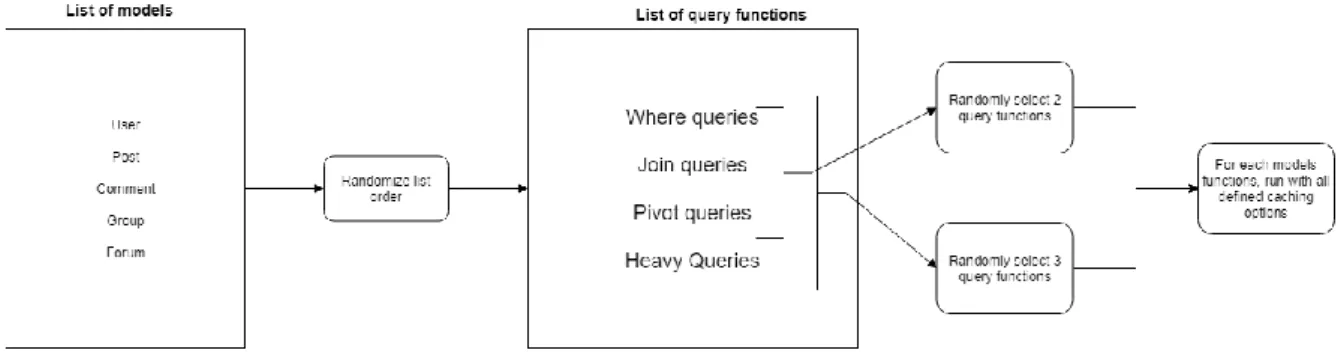
With our data sets established, we also had to ensure that the testing had to be as randomized and as true to a real-life server communication as possible. For each of the models Users, Posts, Comments, Forums and Groups we created a class running four types of queries. Here we describe them and give raw SQL query examples of their implementation. The ID for a certain model was randomly generated between 0 and the number of rows for that table.
Where queries: simple where queries for the table getting a single model given certain condition(s).
• select * from `posts` where `user_id` = '4040' • select * from `comments` where `id` = '1040742'
Join queries: join queries which uses the relation of another table to get joined models given certain condition(s).
• select `users`.*, `group_user`.`group_id` as `pivot_group_id`, `group_user`.`user_id` as `pivot_user_id` from `users` inner join
20
`group_user` on `users`.`id` = `group_user`.`user_id` where `group_user`.`group_id` = '10' limit 25
• select `users`.*, `group_user`.`group_id` as `pivot_group_id`, `group_user`.`user_id` as `pivot_user_id` from `users` inner join `group_user` on `users`.`id` = `group_user`.`user_id` where `group_user`.`group_id` = '13' limit 25
Pivot queries: queries which uses its many-to-many relation that through a pivot table gets a certain model given certain condition(s).
• select * from `posts` where exists (select * from `forums` inner join `forum_post` on `forums`.`id` = `forum_post`.`forum_id` where `posts`.`id` = `forum_post`.`post_id` and `forums`.`id` = '7') limit 1 • select * from `forums` where exists (select * from `posts` inner join
`forum_post` on `posts`.`id` = `forum_post`.`post_id` where `forums`.`id` = `forum_post`.`forum_id` and `posts`.`id` = '104242') limit 1
Heavy queries: the heavier queries used a less constrained limit on the number of models to fetch and combined either where, join and pivot queries where the relation allowed, to suit the model in question.
• select * from `posts` where exists (select * from `forums` inner join `forum_post` on `forums`.`id` = `forum_post`.`forum_id` where `posts`.`id` = `forum_post`.`post_id` and `forums`.`id` = '10') limit 25 • select * from `users` where exists (select * from `groups` inner join
`group_user` on `groups`.`id` = `group_user`.`group_id` where
`users`.`id` = `group_user`.`user_id` and `groups`.`id` = '24') limit 30
To achieve a representative experiment, all of the different queries above were constructed for the purpose of as close as possible resembling real-life queries [17][24]. Our tests were divided into two different subcategories, light queries and heavy queries. Each subcategory of query ran a randomized number of each model’s class tests. Upon running the light query testing, the where, join and pivot queries were randomized, and two out of three query-categories were selected. For the heavy query subcategory, the where, join, pivot and heavy queries were randomized, and three out of four query-categories were selected. The different model tests were then later put in a list and ran in randomized order. For each model, the exact queries were run with the different cache or no-cache policy that was selected, e.g. the exact same join query that was randomly produced was ran with standard MySQL cache, no-cache, LRU and Custom, to give a fair comparison in query execution time(see figure 5.2). We also tested different cache sizes. For the larger data set we increased the cache size by 50%, giving it a total size of 600 items. We did this to achieve better representative test results, i.e. to ensure that our caching policy not only performed as it did when a certain cache size was predefined. Because we were running our environment on a Virtual Machine on the testing systems, we had no outstanding variables such as connections, network availability, upload or download speeds that could alter the results from the tests.
21
Figure 5.1: test database structure.
For every query that was run within the system, its raw SQL statement is stored together with some meta data belonging to said query within our Analytics Database. This database has a size limit of 15 000 queries, that is, the most recent 15 000 queries. In this we store a variable called ‘hash_unique’, that is the raw SQL query hashed to give it a key unique to that certain query. If the same query is ran multiple times within the last 15 000 queries, there will be more than one entry of said query. This allows for us to check the frequency of a certain query. We also store the execution time of this query together with the weight calculated and the raw SQL statement. When an item is cached, we use something called a CacheTracker. The CacheTracker corresponds to another table in the Analytics Database which keeps track of what items are in the cache and their corresponding weight. When a query is run, the database_logs object is created which holds all the parameters belonging to that specific query and is sent to an asynchronous job. The asynchronous job checks the frequency, the execution time and calculates the weight of the query. It then checks the weight with the values held by the CacheTracker by looking at the item with the lowest weight, and if the weight of the current item is higher than the item with the lowest weight it will replace it.
5.4 Measurement
For every test, we also logged the execution time, weight and caching policy used in another table called test_logs. Since our database_logs table was set to contain the 15 000 recent queries, if the number of queries within a test suite was to exceed this number, data would be overwritten and if our results were based on this table, our results could be misleading. With this data we were able to determine the average execution time and average weight calculated for any given cache policy and test suite. We did this by simply gathering the average of what was stored under execution time for a certain caching policy. By comparing the average execution times for the different caching policies, we were able to determine a percentage performance disparity between them, as shown in the result section of this paper.
22
6 Results
The data that was extrapolated from the experiment resulted in average database response times, these indicate how well the caching policy worked compared to the baseline which in this case was a normal call to our (DB test data with MySQL cache enabled and disabled) database using the same ORM in all tests, that bypassed our system. Using these values like in table 6.1 we can show the average performance gain for each method.
6.1 Average Database Response Time
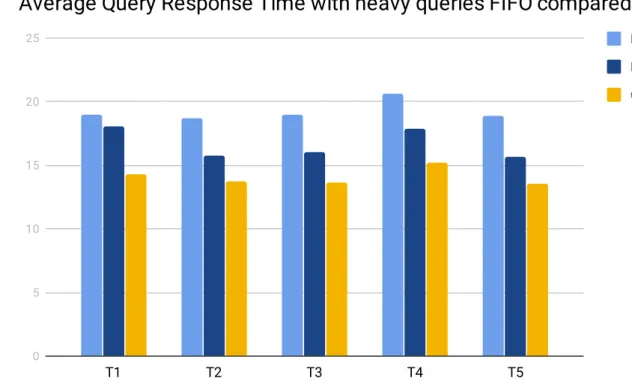
Diagram clarifications:
• Default: The standard database call bypassing our system completely. Caching disabled or enabled shown in the graph.
• LRU (Least Recently Used): A popular caching policy which in this case is used to compare the performance gain when using a standard caching policy.
• FIFO (First In First Out): A popular caching policy which in this case is used to compare the performance gain when using a standard caching policy.
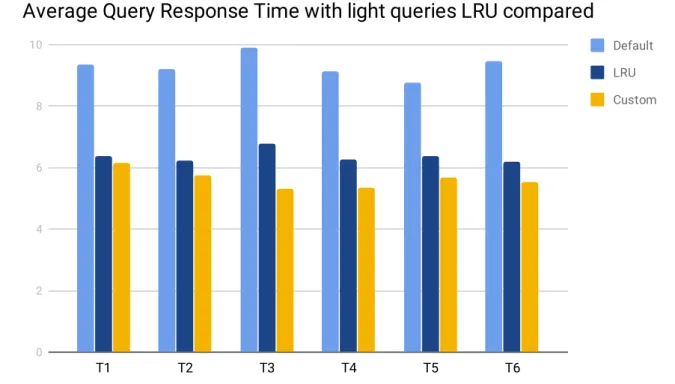
• Light query subcategory: This subcategory of query tests utilized the where, join and pivot queries as shown in figure 5.1.
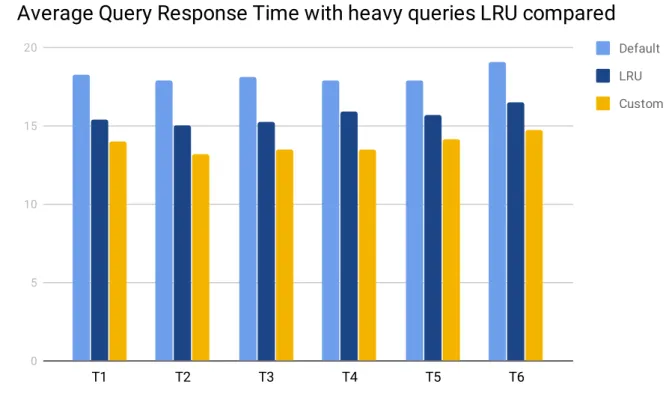
• Heavy query subcategory: This subcategory of queries utilized the where, join, pivot and heavy queries as shown in figure 5.1.
• Result diagrams shows the test cases on the X-axis and seconds on the Y-axis.
23
Table 6.1: Summary of all tests run using 400 tests per (Tx) using a data set 1. Using a 400 item cache limit (3.3% of total queries run) Using system 2. MySQL cache was
turned off.
The first series of tests (see figure 6.1) used the light query subcategory and was run six times, which was about six hours of total test time. The result of this test showed that our custom caching solution had an average decrease on all tests of 11.59% on the average response time compared to the standard caching solution LRU. The test also showed using our custom policy had an average decrease on all tests of 39.52% on the average response time compared to using the database directly.
24
Table 6.2: Summary of all tests run using 400 tests per (Tx)using a data set 1. Using a 400 item cache limit (3.3% of total queries run) Using system 2. MySQL cache was
turned off.
The second series of tests (see figure 6.2) used the heavy query subcategory and was run six times, which was about eighteen hours of total test time. The result of this test showed that our custom caching solution had an average decrease on all tests of 11.52% on the average response time compared to the standard caching solution LRU. The test also showed using our custom policy had an average decrease on all tests of 23.96% on the average response time compared to using the database directly.
25
Table 6.3: Summary of all tests run using 400 tests per (Tx) using a data set 1. Using a 400 item cache limit (3.3% of total queries run) Using system 2. MySQL cache was
turned off.
The third series of tests (see figure 6.3) used the heavy query subcategory and was run five times, which was about eighteen hours of total test time. The result of this test showed that our custom caching solution had an average decrease on all tests of 15.54% on the average response time compared to the standard caching solution FIFO. The test also showed using our custom policy had an average decrease on all tests of 26.77% on the average response time compared to using the database directly.
26
Table 6.4: Summary of all tests run using 400 tests per (Tx) using a data set 1. Using a 400 item cache limit (3.3% of total queries run) Using system 1. MySQL cache was
turned on.
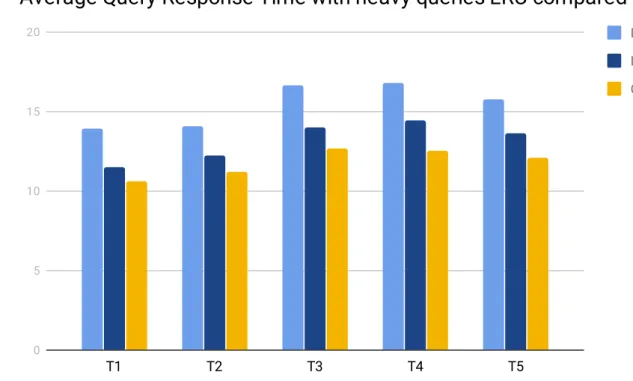
The fourth series of tests (see figure 6.4) used the heavy query subcategory and was run five times, which was about eighteen hours of total test time. The result of this test showed that our custom caching solution had an average decrease on all tests of 10.13% on the average response time compared to the standard caching solution LRU. The test also showed using our custom policy had an average decrease on all tests of 23.32% on the average response time compared to using the database directly.
27
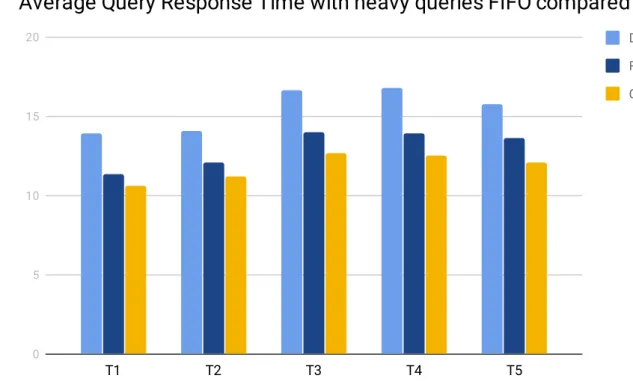
Table 6.5: Summary of all tests run using 400 tests per (Tx) using a data set 1. Using a 400 item cache limit (3.3% of total queries run) Using system 1. MySQL cache was
turned on.
The fifth series of tests (see figure 6.5) used the heavy query subcategory and was run five times, which was about eighteen hours of total test time. The result of this test showed that our custom caching solution had an average decrease on all tests of 8.86% on the average response time compared to the standard caching solution FIFO. The test also showed using our custom policy had an average decrease on all tests of 23.32% on the average response time compared to using the database directly.
28
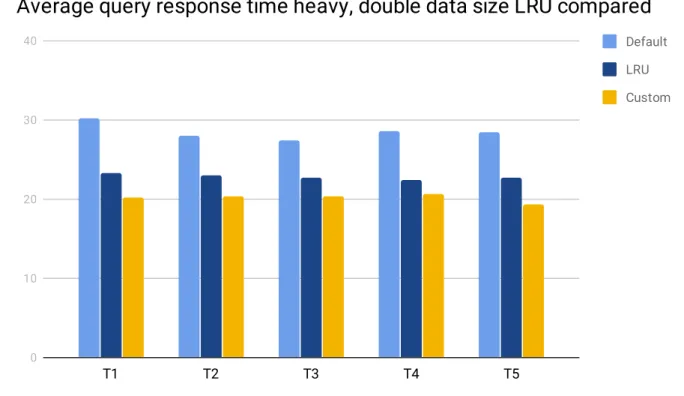
Table 6.6: Summary of all tests run using 400 tests per (Tx) using a data set 2. Using a 600 item cache limit (4,9 % of total queries run) Using system 1. MySQL cache was
turned off.
The sixth series of tests (see figure 6.6) used the heavy query subcategory and was run five times, which was about forty-five hours of total test time. The result of this test showed that our custom caching solution had an average decrease on all tests of 11.9% on the average response time compared to the standard caching solution LRU. The test also showed using our custom policy had an average decrease on all tests of 29.38% on the average response time compared to using the database directly.
The standard deviation of all tests run on Data set 1 and with the heavy query subcategory showed;
• Looking at Default, a standard deviation of 10.57364671 with an average of 12.5369835
• Looking at Custom, a standard deviation of 7.927572926 with an average of 16.77776918
• Looking at FIFO, a standard deviation of 8.710944789 with an average of 13.92417548
29
7 Discussion and analysis
In our experiment we performed extensive testing on two different existing caching policies; LRU and FIFO, together with our own custom caching policy all residing on the application side of the system. We also tested these against the performance of the MySQL standard caching solution both enabled and disabled.
7.1 Result analysis
For the custom caching policy we developed, we had a substantial performance increase against LIFO and LRU, we can see that with the accounting of historical query frequency together with the execution time and calculating a weight, i.e. a queries priority, affords a performance enhancement without adding the need for manual configuration for the developer. We can also see that by letting a cache reside on the application side of the system, it alleviates the load on the MySQL database server which could be seen by the frequent turn-over in regard to the cached items.
With the high intensity of which our tests were run, it put a heavy load on the relatively small MySQL server. We believe that this is what could be reflected in the difference in the testing on light queries and heavy queries. Where the testing with light queries the performance increase was substantially larger than with the heavy queries, we believe that since the MySQL server had fewer requests to serve for a certain time interval the lesser intensity allowed the MySQL server to recover, in relation to a server load perspective.
With NoSQL database implementations such as Redis which we incorporated, being geared towards serving a higher intensity of requests, with this implementation as the cache on the application side of the server, we believe is another reason as to why there was such a substantial difference between the light and the heavy query testing. Where the heavier queries certainly were afforded a sufficient weight to be a priority to cache, the gain afforded from high intensity reads by using Redis, was not as apparent. For systems that are very query-intensive and handle a relatively large amount of data, the incorporation of our solution would then afford that system an alleviation for the database server as well as an overall improvement for the average query response time.
7.2 Overhead
In our research we developed a solution that handles caching built upon an existing web framework called Laravel, this would naturally create some form of system overhead. Overhead is when a combination of indirect computation time or excessive use of memory, bandwidth or resources is added to a system. In relation to our work we assumed that we would create some form of overhead
30
when developing the system, this became apparent after the system was completed, by trading processing power to get better caching results in our solution.
Performance
The main addition that we saw created the most system overhead in our solution was the queue workers that calculate a weight and decides if a query should be cached. The reason for this is that we wanted to run the calculations asynchronously, thus not degrading the performance of each query. This in turn lead to a separate process that needed to run so the cache manager could calculate a query weight and decide if a query should be cached.
Traditional relational databases are limited in how much they can scale, this means that any reduction in database load could drastically improve a system in regard to performance. This is why our solution alleviates requests to the database but trades that gain for a higher application server load. The tradeoff is subsequently more favorable because of the potential to cluster the queue workers resulting in higher levels of scalability compared to using a traditional database. In relation to heavy queries our solution significantly improves performance because of how our solution prioritizes them when it deems them more costly than other queries.
Analytics database
In our solution we use a separate relational database to handle the storing of historical data and the subsequent results that our algorithms calculate. This adds overhead to the system but is of lesser importance because of limitations put in place resulting in the database being limited in how large it can become.
Redis Database
The Redis database is used for handling the cache in our solution, this adds significant overhead in terms of performance and maintenance, by adding an additional server that has both storage and processing requirements. Using a form of NoSQL to handle cache is common in systems today, for this reason we do not see this as a significant issue in regard to the overall overhead our solution adds.
Developer
Reducing the complexity for the developer in terms of handling cache optimization is an important issue that was shown by Tse-Hsun Chen et al. [12]. In terms of our solution we reduce the potential complexity in handling cache
31
optimization because of how our solution dynamically caches an item depending on what is being queried, thus minimizing the need for a developer to manually configure the cache for each query.
7.3 Considerations
Confidentiality
Taking into consideration the data confidentiality, because of how each query is hashed based on the raw SQL of the query, this means that if two queries are the same or the hashing algorithm creates the same hash, one of the queries will overwrite the other which results in the wrong data being cached. This results in a small risk of a that query result being shown to a wrongful user.
Validity/integrity
During the development process of our system we began with turning off the MySQL server caching solution. We did this so that when we measured the execution time of a query made to the database it would not be that of an item residing within the MySQL cache. We wanted to determine the significance of a queries execution time without the futile task of accounting for an items cache status. For the testing suite that incorporates the MySQL cache turned on we then interpreted these metrics, taking into account the fact that the execution time, and with that the calculated weight of a query, could be that of an item residing in the MySQL cache. This was most relevant for our testing and development of the set of components that make up the solution and the variables that was to be incorporated in deciding a queries weight. For our experiment we wanted to test the implementations of both the MySQL cache turned on and off so that we could equally measure the impact of a cache residing on the application side as well as analyzing the performance of the different caching policies.
Test suite
The test suite was developed with the intention of reducing external factors that could affect our result. The test suite ran all tests in a fair and transparent manner, by this we mean that all policies were tested in the same way with the same queries. Considerations to take into account are that because there is a large number of queries that run under a considerable amount of time there is the possibility of the queries overloading the database server. We however did not observe this in our tests. Another consideration regarding our test suite is that it ran in the same virtual machine as the rest of our solution, this was a practical limitation in our experiment which could affect the results because of how each server in the virtual machine share the same system resources. We
32
took precautionary measures to ensure that the virtual machine was not overutilized when running the tests by making sure that the virtual machine had enough memory and processing power that the test suite would not over utilize it.
Test length
Some of the test we ran in our test suite lasted for up to 45 hours, this was a result of some tests running very heavy queries. We assumed that running the tests for longer periods of time could only improve the accuracy of the results, with this said we could have run the tests for a much shorter time, and we would potentially still receive the same result. All the data that we gathered showed consistency, this indicated that we would receive the same result if we ran the tests in shorter times.
Standard deviation
The standard deviation or, the amount of variation of our data values, we wanted to include to show the dispersion for our test sets in the amount of time it took for each test to execute. For a high standard deviation, it would create a need for analyzing what brought this on and if this was classified as an issue, resolve this. In the standard deviation as presented in our Results, we saw no inconsistencies in relation to the different cache implementations, and the deviation that was calculated was to be expected in relation to randomization of queries that resulted in the using of both light and heavy queries with understandably different query execution times.
33
8. Summary
Our research question was “To what extent can a dynamic caching policy, implemented in the application cache of a web system, optimize the query response time compared to standard caching policies.”
To test this, we implemented our own custom caching policy and compared it to known caching policies. We built our custom policy and configured our experiment environment in a web framework called Laravel with the intent of creating a solution that we could use to analyze and test our theory to generate sufficient quantitative data to answer our research question. We combined previous research within the field to formulate a solution. Our solution used historical query frequency together with the query execution time that by utilizing a logarithmic function to assign the queries a weight, i.e. a priority, that decided whether or not a query should be cached.
We created an extensive test suite within our system that ran simulated randomized queries of different kinds and on differently sized data sets under a long period of time. The results from these tests showed that our solution performed better than the well-established caching policies LRU and FIFO which we tested against. There is usually a tradeoff when an optimization is done, as was also true in our case. This tradeoff was since we needed a separate process that run our calculations on each query, this took system resources, thus we traded CPU performance for a better average query response time and an alleviation of the database server.
8.1 Future Work
The research done afforded many interesting aspects regarding how a cache policy can have different levels of complexity in the form of what parameters it takes in regard and the longevity of a cached item. We did not implement a time to expire for cached items in the cache, this was a deliberate choice because of the limited time we had for our research and that the potential gain of having such a system in place was considered to be small for the tests we implemented. However, for an even more life-like query testing implementation, the longevity could prove to have a greater impact on the overall performance.
We did not have time, nor saw the need for implementing cache invalidation principles for our caching policy for the scope of this research. There was no need since we did not alter the data in between queries and to implement testing that did this and further implement our caching policy to support this functionality was not deemed to be within our time budget. This is however a very important part of a cache policy and cache management system and is quite possibly where we will start when continuing our future research.
During our research for deciding the mathematical calculation to determine a queries weight, we also looked at a queries complexity. A query that spans over
34
more than one table we decided to denote as a more complex query. Since it must access more than one table the larger the size of the given tables the more this complexity will reflect in the execution time. If a given query then has a join parameter or looks through a pivot table, they will be assigned a category of pivot- or join query, and later sorted as such. With this categorization an opportunity to sort the queries weights depending on their complexity would allow for e.g. simpler where queries to not be prioritized away by more time-consuming queries for not being as time time-consuming but instead having a higher query frequency. However, we saw no obvious improvement with this and decided that further investigating within the scope and time budget of our research, this would not be a priority. We believe that further investigating and testing in this regard could have the possibility of categorizing the queries and allow for a more individual configuration regarding what should be prioritized for a certain system and is something that could be further researched in future work.
When we tested what constant to multiply the logarithmic calculation of the historical query frequency, we did so with the determined data set and size. We were always aware that this could be a local optima for our given test data, size and set of test queries but even here, with the time afforded for us, to further test with different data sets was deemed not possible and was also considered to not be directly related to the scope of this study. The implementation of an automated test that adjusts the multiplying constant could allow for a constant that adapts to the given data set and size. The probability and impact this would make could also be a possible research question for our future work.