Explaining Party Support in the 2016 State Duma Election
30
0
0
Full text
(2) Keywords Russia – elections – party support – electoral behavior.. 2.
(3) Introduction Many recent studies of Russian elections have paid relatively little attention to the election results themselves, and instead focused more attention on the integrity of the electoral process. A perception has grown among international observers, as well as many Russian citizens, that elections are subject to manipulation by the authorities. In this reading, election results simply reflect the success with which the regime can mobilize voters and execute its pre-determined plans. Such a perspective suggests that there is little point in analyzing the patterns of voting behavior as such, since the choices of voters themselves play only a minimal role in the electoral outcome and do not necessarily reflect their actual views. Whilst it is true that the electoral procedures may be open to criticism in some respects (as Bader and White discuss elsewhere in this volume), 1 we should not simply dismiss the voters as irrelevant to the process. Ultimately, it is the summation of their individual ballot papers that yields the final result. Even in the relatively lowturnout State Duma election of September 2016, 52.7 million Russians still took the trouble to go to the polls. What motivated them to do so, and who voted for which parties, is still as much of interest in Russia as in any other state. The article begins by briefly outlining the context of the 2016 election, before looking in more detail at the factors that may have contributed to Russians’ voting decisions. Utilizing a post-election survey that continues a series of similar studies carried out after every election since the turn of the century, 2 it outlines and contextualizes Russian voters’ attitudes on factors that have traditionally been shown in other countries to influence people’s voting patterns. These include sociodemographic factors, evaluations of the economy and political leadership, perceptions. 1. Max Bader, “The Role of Precinct Commissions in Electoral Manipulation in Russia: Does Party. Affiliation Matter?”, Russian Politics 2, no. 4 (2017): 434-453; David White, “Modifying Electoral Authoritarianism: What the 2016 Parliamentary Elections Tell Us About the Nature and Resilience of the Putin Regime”, Russian Politics 2, no. 4 (2017): 482-XXX. 2. The 2016 Russian Election Study was conducted by Ian McAllister and Stephen White and funded by. The Australian National University. A national representative sample of N=2,003 was selected. The survey fieldwork was conducted by R-Research between 23 September-18 October 2016. See appendix for further details of previous surveys.. 3.
(4) about the integrity of politics, and media usage. Finally, it goes on to conduct a multivariate analysis of the influence of each on Russians’ voting behavior in 2016.. The election context Russian parliamentary elections in the 1990s featured a bewildering array of parties that changed from election to election – dubbed a “floating” party system by one group of analysts. 3 By contrast, since 2007 the same four parties have won representation, with roughly similar vote shares, in every election. In this phase of its evolution, Russia’s party system appears to have moved from its 1990s flux into an era of “hegemonic” or “dominant” party politics. 4 Classically, such a system is one in which one party dominates and in which the existence of “licensed, second class parties...may afford the appearance but surely does not afford the substance of competitive politics”. 5 A particular feature of the Russian party system is that it has at its core a dominant “party of power” – United Russia (UR). 6 Initially established to extend the Kremlin’s control over the legislative agenda of the country, UR has won a plurality or absolute majority of the vote in every State Duma election since 2003, and dominates the regional assemblies of the country. As figure 1 shows, alongside it as mainstays of the party system over the last decade have been three much smaller organizations that have generally won between 5 and 20 percent of the vote – the Communist Party of the Russian Federation (CPRF), the Liberal Democratic Party of. 3. Richard Rose, Neil Munro and Stephen White, “Voting in a Floating Party System: The 1999 Duma. Election”, Europe-Asia Studies, 53, no.3 (2001): 419-43. 4. Regina Smyth, Anna Lowry and Brandon Wilkening, “Engineering Victory: Institutional Reform,. Informal Institutions, and the Formation of a Hegemonic Regime in the Russian Federation”, PostSoviet Affairs 23, no. 2 (2007): 118-37; Ora John Reuter, “The Politics of Dominant Party Formation: United Russia and Russia’s Governors”, Europe-Asia Studies 62, no. 2 (2010): 293-327. 5. Giovanni Sartori, Parties and Party Systems (Essex: ECPR Press. 2005, 2nd edn): 205.. 6. This terminology derives from the dual meaning of the Russian word for power (vlast’). The clearest. distinguishing feature of the various ‘parties of power’ is that they have been formed by the structures of ‘power’ – i.e., the state authorities. As Golosov points out, UR is not a ‘ruling party’ as the executive is largely non-partisan – but UR provides the main vehicle through which it controls the legislative process at different levels [Grigorii V. Golosov, “Authoritarian Electoral Engineering and its Limits: A Curious Case of the Imperiali Highest Averages Method in Russia”, Europe-Asia Studies 66, no. 10 (2014): 1611-28 (1614)]. 4.
(5) Russian (LDPR), and A Just Russia (AJR). The first two have been represented in every State Duma convocation since 1993. AJR is of a vaguely social-democratic persuasion and originated as a second – somewhat half-hearted – “party of power” for the 2007 election. These three are nominally competitors to UR, but the LDPR and AJR in particular are noted for their regular alignment with UR in the State Duma, the occasional rebel aside. 7 The CPRF, the largest party of opposition in the 1990s, has had its independence dramatically curtailed since the early 2000s.. Figure 1 Election results (major parties) 2003-2016. Source: Central Electoral Commission 8. 7. During the VI State Duma convocation, two of its deputies – Dmitrii Gudkov and Il’ya Ponomarev –. led the protests against the regime in 2012 and were frequent critics. Ponomarev was the only deputy to vote against the annexation of Crimea in the State Duma, but was later accused of embezzlement and fled to the United States. 8. Source: Central Electoral Commission, Vybory deputatov Gosudarstvennoi Dumy Federal’nogo. Sobraniya Rossiiskoi Federatsii sedmogo sozyva. 2016. Elektoral’naya statistika (Moscow: CEC, 2017): 341, http://vestnik.cikrf.ru/upload/publications/analytics/statistic_21_04_2017.pdf (accessed 1 September 2017).. 5.
(6) Given these four parties’ symbiotic relationship, there has been debate about the extent to which the party system is genuinely “hegemonic”, or whether it would be more appropriate to think of the main parties as a stable parliamentary “cartel” in which UR plays the leading role. 9 The other three parties often disagree with UR on matters of day-to-day policy, but they have often voted together on several questions of principle, such as approval of the annexation of Crimea and reforms of electoral and party legislation. Moreover, all four represent within-system parties that have colluded to ensure that they retain or enhance certain institutional privileges over the splintered non-parliamentary opposition. As noted elsewhere in this issue, 10 UR emerged from the 2016 State Duma election with its biggest ever supermajority – 343 out of 450 seats. This was based on 54.2 percent of the party list vote and victory in the overwhelming majority of singlemember district seats. The CPRF and LDPR were far behind, with almost the same representation as each other – 13.3 percent and 13.1 percent of the vote and 42 and 39 seats, respectively. AJR lagged in fourth place, with 6.2 percent of the vote and 23 seats. Although there were more parties on the ballot than at the previous election – the first increase since 1995 – the higher plurality of options made very little difference to the final outcome. No other party came close to clearing the 5 percent electoral threshold in the proportional part of the election, and only three candidates that did not directly represent the four-party cartel were elected in the constituency contests. UR’s success was based on three factors. First, it obtained the traditional firstpast-the-post “winner’s bonus” in the single-member district seats, losing to opposition candidates only in three of the constituencies it contested, and obtaining 203 out of 225 seats available. 11 Despite a fall in the absolute number of votes cast for UR in the party list part of the election, from 32.4 million in 2011 to 28.7 million. 9. Derek S. Hutcheson, “Party Cartels beyond Western Europe: Evidence from Russia”, Party Politics. 19, no. 6 (2013): 907-924. 10. Derek S. Hutcheson, “Contextualizing the 2016 Russian State Duma Election”, Russian Politics 2,. no. 4 (2017): 383-411. 11. UR did not nominate candidates in 18 seats as part of a pact with the parliamentary opposition. parties. One candidate (Tat’yana Barsukova in Moscow seat 200) resigned during the campaign and was not replaced.. 6.
(7) in 2016, it increased its relative share of the vote to 54.2 percent. This ensured it won the majority (140 of 225) of the proportionally-allocated seats as well. In terms of vote share, it was ahead of every other party in all 225 electoral districts, but it is important not to overstate its dominance. Only in 99 of the 225 constituencies did it win more votes than the other parties combined, and in 52 constituencies its support level was below 40 percent – which would be considered a respectable but not landslide result in most West European elections. That it could convert this into such a substantial majority nationwide was down to a third factor: a splintered and ineffective opposition. Whereas UR’s support was consistent and widely-spread, its opponents’ strongholds were scattered and mainly located in areas with low turnout, ensuring that UR gained more votes from high-turnout regions than it lost in low-turnout ones. 12 Moreover, the non-UR vote was split over three other parliamentary parties and ten non-parliamentary contenders, meaning that none formed a realistic threat to it by itself. Each of the other parliamentary parties’ best results (by electoral district) was lower than UR’s worst. 13 The main opposition parties tended to be strong in different places – the CPRF generally did better than the LDPR in the regions south of Moscow and in some parts of Siberia, while the LDPR did better than the CPRF in the far eastern regions and the north-west of Russia – coming to roughly the same share of the vote overall across the country. Meanwhile, the ten parties that were not previously represented in the Duma took a collective 11.2 percent of the vote (and as much as a quarter to a third of the vote collectively in some of the Moscow and St Petersburg constituencies) but none managed to concentrate their votes sufficiently to cross the 5 percent electoral threshold. These votes were effectively discounted when the distribution of seats was made, further benefiting the parliamentary parties – and particularly UR, as the largest of them.. 12. Ian McAllister and Stephen White, “Demobilizing Voters: Election Turnout in the 2016 Russian. Election”, Russian Politics 2, no. 4 (2017): 411-433. 13. The best results for the other parliamentary parties were 29.8 percent for the CPRF (Bashkortostan. constituency 8); 29.0 percent for the LDPR (Amur Province constituency 71); and 21.8 percent for AJR (Chelyabinsk constituency 191). UR’s worst result was 31.7 percent in Omsk seat 139, but even there it won the plurality of the vote, as opposition support was split.. 7.
(8) Explaining party support Traditionally, electoral behavior in the established democracies is seen as a function of three things: a cognitive attachment to a political party; socialization into a particular pattern of voting; and attitudes towards current political and economic issues. 14 In this section, the application of these three models to Russia is discussed, prior to a more detailed investigation of their relative importance later in the article.. Party Identification Despite evidence of partisan dealignment, habitual voting patterns from one election to the next remain common among many voters in the established democracies. The “Michigan model” of voting behavior suggests that voters acquire a partisan identification through childhood and adolescent socialization, and view the world through a partisan filter. Thus voting is an act of affirmation, rather than choice, and tends to repeat itself habitually from election to election. 15 This model is difficult to transfer unmodified to the Russian context, given the short time that the party system has been stable and the fact that most people’s socialization came before the party system was established. 16 The lack of party identification was particularly pronounced in the early post-Soviet years, when the ever-changing kaleidoscope of party options meant that there was little opportunity for long-term loyalty to build between voters and parties. When asked directly, the proportion of voters who claim to identify with a particular party has never been particularly high. Figure 2 shows that just 27 percent said that they were a supporter of a party in the 2016 survey. This figure is higher than in several recent surveys – notably 2010 and 2014 when just one in five said they were party supporters – but it represents a substantial decline since 1999, when just under half identified with a particular party, even though the system was more fluid back then. Moreover, even among those who volunteer an identification, relatively 14. Patrick Fournier, André Blais, Richard Nadeau, Elisabeth Gidengil and Neil Nevitte, “Issue. Importance and Performance Voting”, Political Behavior, 25 no. 1 (2003): 51-67. 15. Angus Campbell, Philip E. Converse, Warren E. Miller and Donald E. Stokes, The American Voter. (New York: Wiley and Sons. 1960). 16. Ted Brader and Joshua A. Tucker, “Pathways to Partisanship: Evidence from Russia”, Post-Soviet. Affairs, 24, no. 3 (2008): 263-300; Arthur H. Miller and Thomas F. Klobucar, “The Development of Party Identification in Post-Soviet Societies,” American Journal of Political Science 44, no. 4 (2000): 667–686.. 8.
(9) few regard themselves as strong party supporters. These are levels of identification which are weak by international standards, even taking into account the decline of partisanship that began in the 1970s. 17. Figure 2. Supports a Political Party, 1999-2016. 60 50. Percent. 40 30 20 10 0 1999. 2003. 2005. 2008. 2010. 2011. 2014. 2016. ‘Do you consider yourself a supporter of any political party?’ Sources: Russian Election Surveys, 1999-2016 (see appendix).. Despite these low levels of identification, there is evidence that voter preferences may be becoming more habitual. The number of people who had decided how to vote before the start of the campaign increased in every election from 1995 to 2011. Whereas only 31 percent had made their decision three months before the 1995 State Duma election, this had increased to 44 percent by 2003; 50 percent by 2007, and 60 percent by 2011. 18 This does not necessarily point to increasing party. 17. Soren Holmberg, “Partisanship Reconsidered”, in Russell Dalton and Hans-Dieter Klingemann eds,. The Oxford Handbook of Political Behavior (Oxford: Oxford University Press. 2007): 557-570. 18. VTsIOM survey, Post-Election National Representative Survey dataset, fieldwork conducted on. behalf of University of Glasgow, 20-26 December 1995, N=1,568, q.17; Russian Election Surveys 2004-2012 (see appendix).. 9.
(10) identification, but it does indicate the decreased salience of short-term election campaigning. By contrast with the flux of the 1990s, the party system since the mid2000s has essentially ossified, with the same parties and leaders dominating legislative politics at regional and federal level. This suggests that voters are increasingly developing de facto habitual voting identifications with particular parties from election to election, and increases the importance of whether voters see themselves as party supporters or not.. Social correlates of the vote As noted above, in established democracies there has been extensive research on the role of social factors in determining voter affiliations. The Columbia School’s observation that “a person thinks, politically, as he is, socially” 19 paved the way for myriad studies that drew attention to the role of social structures in predicting the political behavior of voters. The most notable was Lipset and Rokkan’s seminal study in the late 1960s, which argued that historical cleavages were still the dominant factor behind voter alignments. 20 Notwithstanding frequent assertions since then that sociological explanations for voting behavior are redundant as social structures change and partisan alignment declines, 21 there are still significant long-term cleavage-based differences in people’s voting behavior in the established democracies, based on their class, religion and gender. 22 Once again, we should be wary of transferring this model to Russia directly. Contemporary class structures in Russia are different from the traditional upper-, middle and working-class structures found in West European democracies, largely because of the communist legacy. The cleavage over religion is also difficult to apply to Russia. Religious cleavages in Western states are legacies of 16th-century Reformation politics, and were politicized by the emerging political parties in the late 19. Paul F. Lazarsfeld, Bernard Berelson, and Hazel Gaudet, The People’s Choice: How the Voter Makes. Up His Mind in a Presidential Campaign (New York: Columbia University Press.,1948): 27. 20. Seymour M. Lipset and Stein Rokkan, Party Systems and Voter Alignments: Cross-National. Perspectives (New York: The Free Press, 1967). 21. Mark Franklin, “The Decline of Cleavage Politics” in Mark Franklin, Tom Mackie, Helen Valen. eds., Electoral Change (Cambridge University Press, New York, 1992): 383-405. 22. Clem Brooks, Paul Nieuwbeerta and Jeff Manza, “Cleavage-Based Voting Behavior in Cross-. National Perspective: Evidence from Six Postwar Democracies”, Social Science Research 35, no. 1 (2006): 88-128.. 10.
(11) nineteenth century. By contrast, Russia is a post-Soviet state that has re-embraced the Russian Orthodox Church after nearly a century of official atheism, and where minorities of other religions are indigenous peoples rather than immigrants. Nonetheless, the party system plays a role in structuring patterns of political support along social lines in Russia. Early post-Soviet cleavage studies argued that there were lines of continuity to the pre-1917 attitudes on authoritarianism and centreperiphery relations. 23 More recent research suggests that voting patterns rotate around attitudes toward the authorities and a division between “pro-market modernists versus antimarket traditionalists”. 24 The parties’ own platforms for the 2016 election also referenced social class, mirroring previous such documents and rhetoric. 25 UR, previously an advocate of creating a strong Russian middle class, took a catch-all approach in 2016 in its blandly-titled program: “The Success of Everybody is the Success of Russia”. 26 By contrast, the CPRF explicitly divided the population into the “people” (narod), whom the economy should serve, and “oligarchs”, whom it currently did. It also sought to appeal to the elderly by advocating special social rights for veterans of the Great Patriotic (Second World) War. 27 The other parties targeted particular demographic groups: the LDPR aimed at families and young people through its advocacy of increased provision of childcare places and financial incentives to procreate in sparsely-populated regions; 28 while AJR’s platform was a. 23. Alexander S. Perepechko, Vladimir A. Kolossov, and Craig ZumBrunnen, “Remeasuring and. Rethinking Social Cleavages in Russia: Continuity and Changes in Electoral Geography 1917–1995”, Political Geography 26 (2007): 179-208. 24. Yury Korgunyuk, “Cleavage Theory and Elections in Post-Soviet Russia”, Perspectives on European. Politics & Society 15, no. 4 (2014): 401-415. 25. Sirke Mäkinen, “Political Parties and the Construction of Social Class in Russia” in S. Salmenniemi. ed., Rethinking Class in Russia (Farnham: Ashgate, 2012): 107-25. 26. United Russia (UR), “Uspekh kazhdogo – uspekh Rossii. Predvybornaya programma Vserossiiskoi. politicheskoi partii ‘Edinaya Rossiya’ na vyborakh deputatov Gosudarstvennoi Dumy FS RF VII sozyva”, 2016, http://er.ru/party/program/ (accessed 8 August 2017). 27. Communist Party of the Russian Federation (CPRF), “Desyat’ shagov k dostoiinoi zhizni.. Predvybornaya programma KPRF”, 2016, https://CPRF.ru/party-live/cknews/157005.html (accessed 8 August 2017). 28. Liberal Democratic Party of Russia (LDPR), “Predvybornaya programma LDPR”, 2016,. http://ldpr.ru/party/Program_LDPR/?is_print=1 (accessed 8 August 2017).. 11.
(12) pastiche of all its counterparts’, with sections on improving the lots of workers, families and war veterans, and an underlying theme of fair redistribution. 29. Table 1 Socioeconomic Status and Party Support, 2016. Gender (percent male) Age (mean years) Tertiary education (percent) Labour force participation (percent) Pensioner (percent) Good family standard of living (percent) (N). UR. LDPR. CPRF. AJR. 37 46.0 32 58 29 13 (680). 53** 43.3* 28 62 22 6** (183). 52** 55.3** 25 41** 52** 6** (167). 38 49.3 39 51 41* 7 (61). ** significantly different from United Russia at p<.01, * p<.05. Source: 2016 Russian Duma Election Survey.. When we examine the social correlates of each party’s vote, several patterns are evident. First, there are significant gender differences between the parties’ electorates, reflecting a tendency that has been evident since the 1990s. As can be seen from table 1, UR’s support is disproportionately female, while the CPRF and LDPR derive more than half their support from men, who are in a minority among the electorate. 30 The gender distribution in support for AJR more closely resembles that of UR, with a greater proportion of female than male voters. It is not difficult to imagine that the nationalistic, chauvinistic rhetoric of Vladimir Zhirinovsky may appeal more to a male audience than a female one, but the reasons for UR’s appeal to women are less clear. As will be discussed below, approval ratings for Putin are also 29. A Just Russia (AJR), “Programma Partii SPRAVEDLIVAYA ROSSIYA”, 2016,. http://www.spravedlivo.ru/5_76349.html (accessed 8 August 2017). 30. Based on official demographic information from 2015, 55 percent of the population aged 20 and. above (63.3 million people) are women, and just 45 percent (51.8 million), men. The gap widens with increased age. Only amongst under-30s do men slightly outnumber women. The enfranchised population of 18-19-year-olds is excluded from this calculation as they are bracketed together with non-enfranchised 15-17-year-olds in the statistics. Even with this exclusion, it is worth noting that the combined total of 115 million people aged over 20 already exceeds the officially-registered electorate in the 2016 election by approximately 5 million people [M.A. Dianov ed., “Raspredelenie chislennosti naseleniya po polu i vozrastu”, in Demograficheskii ezhegodnik Rossii 2015 (Moscow: Rosstat, 2015): Table 1.5, 20-21].. 12.
(13) slightly higher amongst women than men (37 percent compared with 32 percent in 2016 approved “completely” of his work as president) and it may be that the reflected glory of the presidential endorsement contributes towards UR’s greater female appeal – but this explanation remains speculative at this stage. Another distinctive feature of the parties’ electorates is their age profiles. The CPRF’s electorate in 2016 was considerably older than those of the other main parties. This is not new: as the self-styled official successor party to the Communist Party of the Soviet Union (CPSU), with a program explicitly based on Marxism-Leninism, it has long since sought to appeal to those nostalgic for life in the USSR. As such, it was for a long time considered almost an “iron law” of Russian politics that the party would eventually die out due to demographic change. Its brief upturn in 2011 came about because it managed to cultivate a position as a within-system repository for protest votes, which widened its appeal to the under-40s for the first time in many years. Unfortunately for the party, it did not retain this niche in 2016. More than half its voters in 2016 were again pensioners, and the average age of its electorate – 55.3 years – was by far the highest of the main parties’. There is a degree of multicollinearity between the other demographic factors: the lower labor force participation and education levels of CPRF voters, for instance, are related to the higher age of its voters. What is notable is that the share of voters claiming to have a “good” family standard of living – whilst very low overall – was twice as high for the pro-government UR voters than amongst the other three parties’ electorates – something that we will discuss later in the article.. Economic voting The third main influence on voting patterns is so-called “pocket-book” issue voting. There has been considerable international research on the role played by voters’ evaluations of economic performance in determining their votes. Voters may use parties’ past actions in managing the economy as a guide to future prospects – socalled “retrospective voting”. 31 A review of the extensive literature shows that 31. Morris P. Fiorina, Retrospective Voting in American National Elections (New Haven: Yale. University Press. 1981); Andrew Healy and Neil Malhotra, “Retrospective Voting Reconsidered”, Annual Review of Political Science 16 (2013): 285-306; Carolina Plescia and Sylvia Kritzinger, “Retrospective Voting and Party Support at Elections: Credit and Blame for Government and Opposition”, Journal of Elections, Public Opinion and Parties 27, no. 2 (2017): 156-171.. 13.
(14) subjective perceptions of one’s own economic situation, objective evaluations of the macro-economic picture, and confidence in each party’s competence all play a role, as well as other contingent factors. 32 Finally, there is extensive research on the effect that voters’ evaluations of party leaders plays in their decision to vote or not to vote for a party. 33 Economic Performance Support for governments around the world is based very much on delivering economic performance to increase the standard of living of their citizens. Russia is no exception to the general pattern. Support for Putin has long been based on three pillars – the stabilization of Russia after the chaos of the 1990s; support for his foreign policy aims of restoring Russia’s place in the world; and last – but not least – the delivery of strong economic growth. 34 After eight years of strong economic growth, a significant correlation was found in the 2007 election between people’s evaluation of the economic situation and their support for both Putin and UR, whose list he headed in that election. 35 The last two elections have taken place in less benign economic conditions. Following an 8 percent fall in GDP in 2009, moderate growth had returned by the time of the 2011 election and continued through 2012-14, before a renewed recession from 2015 onwards. By contrast with the tremendous growth of Putin’s first eight years in power, the second decade has seen relative stagnation. Research in the past has shown that macro-economic indicators (sociotropic perceptions) explain only part of voters’ economic evaluations. Of equal significance are their subjective (egocentric) experiences about their own welfare. The economic crisis of 2014-16 had a direct effect on people’s incomes. Taking account of inflation, the average per capita monthly ruble income fell by an annual 1 percent, 3 percent 32. Christopher J. Anderson, “The End of Economic Voting? Contingency Dilemmas and the Limits of. Democratic”, Annual Review of Political Science 10 (2007): 271-296. 33. Marina Costa Lobo and John Curtice, Personality Politics? The Role of Leader Evaluations in. Democratic Elections (Oxford: Oxford University Press, 2015). 34. Derek S. Hutcheson and Bo Petersson, “Shortcut to Legitimacy: Popularity in Putin’s Russia”,. Europe-Asia Studies 68, no. 7 (2016): 1107-1126. 35. Ian McAllister and Stephen White, “‘It's the Economy, Comrade!’ Parties and Voters in the 2007. Russian Duma Election”, Europe-Asia Studies 60, no. 6 (2008): 931-957.. 14.
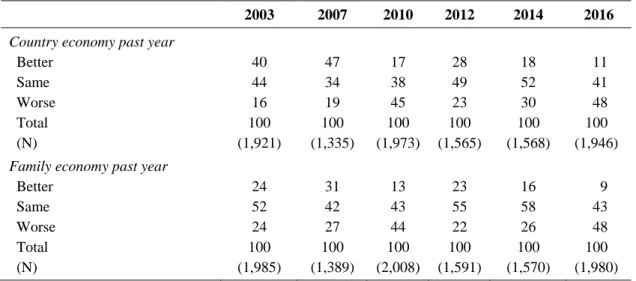
(15) and 6 percent in 2014, 2015 and 2016 respectively. As the currency devalued from September 2014 onwards, incomes also had less exchange value and purchasing power abroad, declining from an average monthly income of US$786 in August 2014 to just US$470 by the time of the 2016 election. 36 Pensions also fell by about 4 percent in real terms in 2015 and 2016. 37 Prime minister Dmitrii Medvedev was mocked for telling a group of angry Crimean pensioners in spring 2016 to “hang in there” after he had explained breezily to them that “there [was] simply no money” to index-link their pensions. 38 However, it was the fact and not just the manner of this confrontation that was most significant: it pointed to the changed economic circumstances of Russia in 2016 compared with previous elections. Table 2 shows that Russians’ assessment of the economic situation generally, and of their own family’s economy, are closely related. As the recession bit in 200910, there was a notable jump in the number of people who felt that both the national economy and their own family income had taken a hit. To some extent this stabilized in 2012 and 2014, before a similar phenomenon was observed in the 2016 survey.. 36. Average per capita income in August 2014 was 29,015 roubles, and in September 2016, 30,577. roubles. [Rosstat, ‘Srednedushevye denzehnye dokhody naseleniya po Rossiiskoi Federatsii’, updated to 22 May 2017, http://www.gks.ru/wps/wcm/connect/rosstat_main/rosstat/ru/statistics/population/level/#, accessed 10 August 2017]. The official exchange rate of the Central Bank of Russia on 30 August 2014 was US$1=36.93 rubles, and on 17 September 2016, US$1=64.99 rubles [https://www.cbr.ru/eng/currency_base/daily.aspx, accessed 10 August 2017]. 37. Rosstat, Rossiya v tsifrakh. 2017. Kratkyi statisticheskii sbornik (Moscow: Rosstat. 2017): Table 7.1,. 117-120. 38. Aleksei Obukhov, “‘Deneg net, khoroshego vam nastroeniya’: Medvedev ‘uteshil’ krymskuyu. pensionerku”, Moskovskii Komsomolets, 24 May 2016, http://www.mk.ru/politics/2016/05/24/denegnet-khoroshego-vam-nastroeniya-medvedev-uteshil-krymskuyu-pensionerku.html (accessed 9 August 2017).. 15.
(16) Table 2 Perceptions of Economic Performance, 2003-2016 2003. 2007. 2010. 2012. 2014. 2016. Country economy past year Better Same Worse Total (N). 40 44 16 100 (1,921). 47 34 19 100 (1,335). 17 38 45 100 (1,973). 28 49 23 100 (1,565). 18 52 30 100 (1,568). 11 41 48 100 (1,946). Family economy past year Better Same Worse Total (N). 24 52 24 100 (1,985). 31 42 27 100 (1,389). 13 43 44 100 (2,008). 23 55 22 100 (1,591). 16 58 26 100 (1,570). 9 43 48 100 (1,980). The questions were: “Would you say that over the past 12 months the economic situation in Russia has improved, remained the same or worsened?” and “Would you please say whether over the past 12 months the economic position of your family has improved, remained the same or worsened?” Sources:. 2001-2016 Russian Election Surveys (see appendix).. In such circumstances, it would be expected that those responsible would receive the disapproval of the electorate. Yet UR’s support, whilst down in absolute terms, still remained relatively solid. Whereas the majority of voters for the other three parliamentary parties believed that the economy as a whole had deteriorated over the previous year, most UR voters perceived it as having stayed the same, as table 3 shows. The same applied to people’s egocentric perceptions of their own situations: even though two-fifths of UR voters noted a downturn in their family’s fortunes, the other parties’ electorates claimed to have been worse hit. In fact, the plurality of UR voters noted stagnation rather than deterioration. There are three possible explanations for the lack of an impact for economic performance on the UR vote. First, the “cognitive filter” of the Michigan model may be at work: those who are regular UR voters may simply not perceive the economic news as negatively as non-UR voters. Second, it may be that the effects of the recession hit certain people harder than others, and that those worst affected were less likely to lend their support to UR in the first place. Third, since the election campaign was not particularly focused on alternative economic solutions, it may be that people preferred to opt for the status quo in times of economic uncertainty. The other main parties went into the election with the same leadership and more or less the same 16.
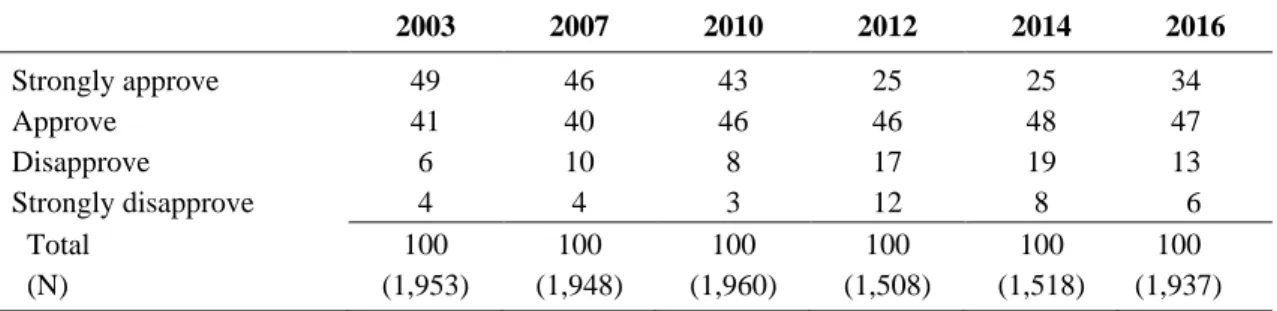
(17) policies as had been rejected by the majority of voters in the previous few elections. By contrast, UR highlighted its specific day-to-day achievements (such as opening new kindergartens and sports centers) and depicted itself as the best force for “stability” in the face of uncertainty.. Table 3 Economic Performance and Party Support, 2016 UR Country economy past year Better Same Worse Total (N) Family economy past year Better Same Worse (N). LDPR. CPRF. AJR. 14 50 37 100 (661). 7 35 58 100 (178). 9 37 54 100 (163). 10 27 63 100 (59). 12 47 41 (672). 5 38 57 (180). 7 42 51 (167). 8 30 62 (61). Source: 2016 Russian Duma Election Survey.. Leadership Evaluations: The Role of Putin By the time of the 2016 parliamentary election, Vladimir Putin had been the main personality in Russian politics – either as president or prime minister – for around 17 years. This is a remarkably long period for a single leader to remain so dominant whilst also retaining authority and popularity. As table 4 shows, his approval ratings have remained high and stable throughout that period. Between 80 and 89 percent of Russians approved of his performance until 2010. Whilst that number declined somewhat from 2012 to 2014, even then most Russians approved of his actions as prime minister and president. And, despite the continuing economic downturn, his ratings rebounded between 2014 and 2016, apparently bolstered by his belligerent stance on Crimea and other foreign policy actions. 39 UR was initially set up with Kremlin backing to create a loyal “party of power” in the legislative bodies of Russia, a fact that Putin was happy to acknowledge publicly when he agreed to head its list in 2007. In recent years, the party has 39. Derek S. Hutcheson and Bo Petersson, “Shortcut to Legitimacy: Popularity in Putin’s Russia”,. Europe-Asia Studies 68, no. 7 (2016): 1107-1126.. 17.
(18) formally been led by the prime minister Dmitrii Medvedev, rather than by Putin, but its raison d’être is to support the Kremlin’s and government’s agenda. Putin once again made favorable statements in its support in 2016. Even though he was not standing for election, it is not unreasonable to suppose that his supporters would be inclined to vote for the party he explicitly endorsed.. Table 4 Approval of Putin, 2003-2016 Strongly approve Approve Disapprove Strongly disapprove Total (N). 2003. 2007. 2010. 2012. 2014. 49 41 6 4 100 (1,953). 46 40 10 4 100 (1,948). 43 46 8 3 100 (1,960). 25 46 17 12 100 (1,508). 25 48 19 8 100 (1,518). 2016 34 47 13 6 100 (1,937). The question was: “On the whole you approve or disapprove of Vladimir Putin’s performance as President/Prime Minister of Russia?” Sources: 2001-2016 Russian Election Surveys (see appendix).. Not unexpectedly, table 5 shows that such a connection seems to exist. Amongst UR voters, 86 percent approved of Putin’s actions as president. However, there are two other pertinent findings. First, the proportion of AJR voters approving of Putin is just as high as amongst UR voters – perhaps a reflection of the fact that it originated as a back-up (if somewhat redundant) “party of power” and has struggled to find an independent role. 40 Second, even though support for Putin was significantly lower amongst LDPR and CPRF voters, the vast majority of them still approved of his actions as president, despite their vote for parties that are nominally in opposition to him. The table also includes figures for the respondent’s likelihood of voting for Putin in the 2018 election; in this scenario, not surprisingly, support for Putin the candidate is much lower than for Putin the incumbent president. This emphasizes that there is very little substantive difference between the four parliamentary parties in practice;. 40. Its leader, Sergei Mironov, was at the time of its formation the Speaker of the Federation Council.. He had effectively served as Putin’s running mate in the previous presidential election in 2004 when he stood for election despite announcing public support for Putin. It was presumed that this was to ensure that there would still be a valid multi-candidate election in the hypothetical event of all the other candidates pulling out in protest. Mironov came last, attracting fewer votes than there were spoiled ballot papers.. 18.
(19) and that non-UR voters can make a differentiation between supporting Putin as an individual, and supporting UR as an organization.. Table 5 The Influence of Putin on Party Support, 2016 UR LDPR Approve of Putin’s performance (percent) 86 76* Will vote for Putin in 2018 election (percent) 81 19** (N) (680) (183) ** significantly different from United Russia at p<.01, * p<.05. Source: 2016 Russian Election Survey.. CPRF 62** 23** (167). AJR 87 41** (61). Corruption The prevalence of corruption and informal practices has long been a feature of Russian politics and business. 41 The campaign agenda of the 2011 election – and the subsequent protests about its falsification – centered around Aleksei Navalny’s characterization of UR as the party of “crooks and thieves”. 42 Navalny and others have continued to make allegations against UR and senior government ministers about their close links with big business. It is not only the opposition that is concerned about sleaze, however. President Putin himself devoted a substantial section of his 2012 address to the Federal Assembly to the dangers posed by endemic corruption, which he deemed “a threat to national development prospects”. 43 High-profile corruption cases were opened in 2015-16 against several regional governors as well as a government minister. With this background, it is unsurprising that corruption amongst public officials is a matter of major concern to Russian voters. Bribery and corruption were perceived to be one of worst aspects of the Soviet system prior to its collapse; it is therefore highly significant that around three-quarters of Russians have consistently. 41. Alena V. Ledenova, How Russia Really Works: The Informal Practices that Shaped Post-Soviet. Politics and Business (Ithaca and London: Cornell University Press. 2006); Georgii Satarov ed., Rossiiskaya korruptsiya: uroven’, struktura, dinamika. Opyt sotsiologicheskogo analiza (Moscow: Fond “Liberal’aya Missiya”, 2013). 42. Aleksei Navalny, “Pil, RosPil, osvoenie. Intervyu s Naval’nym”, Finam 99.6am Radio. Video. recording of interview, 2 February 2011, https://www.youtube.com/watch?v=leHWbcmd74E (accessed 4 September 2017). 43. Vladimir Putin, “Address to the Federal Assembly”, 12 December 2012,. http://en.kremlin.ru/events/president/transcripts/messages/17118 (accessed 10 August 2017).. 19.
(20) seen post-Soviet Russia as even worse in this respect, as table 6 shows. 44 Although the figure fell slightly in 2016, this probably reflects more distant memories of the USSR than an improvement in public perceptions of corruption. Four out of five respondents held the view that all or most officials in local and national government were corrupt – the highest figure since 2003.. Table 6 Perceptions of Corruption, 2003-2016 Corruption among public officials Almost all Majority Some Hardly any Total (N) Bribery since Soviet times Increased Remained the same Declined Total (N). 2003. 2007. 2010. 2012. 2014. 2016. 43 40 15 2. 34 39 25 2. 34 40 24 2. 38 38 21 3. 32 44 22 2. 37 43 19 1. 100 (1,892). 100 (1,918). 100 (1,936). 100 (1,532). 100 (1,553). 100 (1,893). 77 20 3. 71 22 7. 77 18 5. 81 14 5. 73 20 7. 65 22 13. 100 (1,836). 100 (1,838). 100 (1,892). 100 (1,451). 100 (1,483). 100 (1,817). The questions were: “How widespread, in your opinion, is bribery and corruption in central and local government in Russia?” and “Compared with Soviet times, would you say that the level of bribery and corruption in our country… has increased significantly … has increased a little? remained the same … has declined a little … has declined significantly?” Sources: 2001-2016 Russian Election Surveys (see appendix).. The significance of this for the election lies in the voters’ perceptions of who is corrupt, and where. Given that UR controls every regional assembly, the vast majority of gubernatorial offices and the State Duma, it is the most likely organization to be blamed vicariously by voters for corruption in governance structures. As table 7 shows, a significantly higher proportion of voters for the three opposition parliamentary parties perceived widespread corruption as a problem than did UR voters. Having said this, the fact that a quarter of UR’s voters cast their ballots despite. 44. Vladimir N. Brovkin, “Corruption in the 20th Century Russia”, Crime, Law & Social Change 40, no.. 2/3 (2003),: 195-230; Anastassia Obydenkova & Alexander Libman, “Understanding the Survival of Post-Communist Corruption in Contemporary Russia: The Influence of Historical Legacies”, PostSoviet Affairs 31, no.4 (2015): 304-338.. 20.
(21) the perception that all or most officials were corrupt highlights that it is not only individuals that are seen as corrupt, but the system more generally.. Table 7 Corruption and Party Support, 2016. Almost all public officials corrupt (percent) Bribery increased significantly (percent) (N). UR. LDPR. CPRF. AJR. 27 29 (680). 43** 49** (183). 39** 49** (167). 36** 47** (61). ** significantly different from United Russia at p<.01, * p<.05. Source: 2016 Russian Duma Election Survey. The Election and the Mass Media Insofar as voters can take rational decisions on how to vote, their ability to do so is constrained by how much information they have about the menu of options before them, and how accurate that is. Whilst some campaigning takes place in direct interaction with voters, the picture that voters receive of parties and politicians is largely gained through the prism of the mass media. Many scholars depict the contemporary Russian media landscape in “neo-Soviet” terms, pointing to the concentration of ownership, the dominance of the statecontrolled media, and the lack of balance, self-censorship, and threats against journalists that are frequently highlighted by human rights organizations. 45 Although there are nearly 2,500 television channels in Russia, there is a strong concentration of ownership in three major holdings, all of which have indirect connections with each other and with the inner circle of the Kremlin. 46 But we should not ignore the fact that there are still print, internet and radio outlets that are less monolithic in their outlook. Edenborg describes the Russian media landscape as a symbiosis of a dominant mainstream state-aligned narrative and a “polyvocal, cacophonic, unequal and highly. 45. Sarah Oates, “The Neo-Soviet Model of the Media”, Europe-Asia Studies, 59, no. 8 (2007): 1279-97.. 46. Ilya Kiriya, “The Impact of International Sanctions on Russia’s Media Economy”, Russian Politics 2,. no. 1 (2017): 80-97; Derek S. Hutcheson, Parliamentary Elections in Russia: A Quarter-Century of Multiparty Politics (Oxford: British Academy/Oxford University Press. 2018 forthcoming), chapter 5.. 21.
(22) diverse” alternative media space that co-exists alongside it, but which is largely separate from and subordinate to it. 47 Despite the diversity of media sources, table 8 shows that television was still the dominant media used by most voters to inform themselves about the 2016 election. The extent to which they relied on it varied by party. CPRF voters used television most and social media least, but this may also be an artefact of their higher average age (older people are the least likely to use the internet). In any event, their CPRF vote presumably did not derive from seeing much of the party’s politicians on the airwaves. As in most recent elections, the editorial coverage of the parties in the main television channels was highly unbalanced. Aside from the debate time, which was evenly distributed, 48 UR obtained more news coverage than all the other 13 parties combined on the mainstream channels. 49 Overwhelmingly, however, television news coverage focused on the government and president, further increasing the amount of coverage given to the establishment but also indicating the relatively low profile of the election itself in the news agenda in 2016. Compared with the past, radio diminished in importance as a source of news, but the internet overtook it for the first time in 2016. The survey did not ask exactly what people did with their internet news interaction, but it is worth noting that parties’ direct footprint on social media was miniscule. Whilst there may have been some wider resonance from reposting, even the largest party presences – UR’s and the LDPR’s – were very limited. The LDPR’s VKontakte page attracted approximately 75,000 followers, and UR’s Odnoklassniki page, 61,000 – equivalent to less than 0.1. 47. Emil Edenborg, Nothing More to See: Contestations of Belonging and Visibility in Russian Media. (Malmö/Lund: Malmö University, 2016): 70. 48. There were debates on five federal state television and three federal state radio channels. Probably. the ones most accessible to viewers were the ones on the highest audience Rossiya 1 and Pervyi Kanal channels, respectively broadcast from 1750-1830 hours and 1900-1946 hours on weekdays for a month before the election. Each debate consisted of a mixture of four to seven of the 14 parties standing for election, chosen by lot – so there was no guarantee that the main parties would end up debating directly with each other in the same show. [Central Electoral Commission, Vybory deputatov 2016. Elektoral’naya statistika: 231-236]. 49. OSCE/ODHIR, Russian Federation. State Duma Elections. 18 September 2016. OSCE/ODIHR. Elections Observation Mission. Final Report (Warsaw: ODIHR. 2016): 17, http://www.osce.org/odihr/elections/russia/290861?download=true, accessed 28 June 2017.. 22.
(23) percent of voters. UR used its Twitter feed extensively, but mainly as newswire alert. It posted links to articles about underwhelming local events such as visits of UR candidates to local hospitals and markets, but rarely posted original comments directly on the social medium. Table 8 Use of the Media for Political News, 2016 Vote in 2016 Percent uses daily Television Radio Newspapers Internet (N). All. URa. LDPR. CPRF. AJR. 48 11 6 26 (1,950). 50 10 6 21 (662). 42* 12 7 29* (180). 64** 18* 9 18 (159). 57 9 7 30 (61). The question was: “How often do you take an interest in political news?” ** significantly different from United Russia at p<.01, * p<.05. Source: 2016 Russian Duma Election Survey.. Evaluating the explanations Having outlined the various factors that may be expected to influence voting patterns, and set them into context, this penultimate section tests the various explanations in the form of a multinomial logit model, with UR as the excluded category. This allows us to identify which of the factors outlined above were most significant in shaping people’s voting decisions, and how these factors varied by party. Because of the strong correlation (mean r =0.72) between partisanship and the vote, this is excluded from the model. The results in table 9 show that voters’ views of President Putin were the strongest predictor of voting behavior. Even though Putin was not directly involved in UR’s campaign as a candidate, its role as the primary legislative support for the Kremlin, and Putin’s explicit endorsement of it, would have led to a close association between him and the party in voters’ minds. The less they approved of Putin’s actions as president, the more likely they were to vote for a party other than UR. The effect was greatest amongst CPRF voters and least amongst AJR voters – which does not come as a surprise, given their respective origins and levels of legislative opposition to UR over the previous few years. In terms of magnitude, the second strongest factor predicting voting behavior was the voters’ perception of corruption in local and national government – but here 23.
(24) an important qualification must be made. Voters of all three parties believed that corruption had got worse since Soviet times, compared to UR voters. However, their views of the extent of contemporary corruption per se were not significant predictors of their voting behavior. When it came to economic perceptions, it was the egocentric rather than sociotropic evaluations of the economy that proved the better predictor of voting behavior. The perception of general economic deterioration was a significant predictor only of a vote for the LDPR. By contrast, voters’ perception that they had a poor standard of living (an egocentric evaluation) was a significant predictor of a vote for all three of the parliamentary opposition parties, particularly the CPRF. There are other, smaller effects for each party. As expected, male voters were more likely to vote for the CPRF and LDPR, while there was a positive association between age and a vote for the CPRF (in other words, older voters were more likely to vote for the CPRF than younger ones). The varying patterns of media usage made very little difference to people’s voting behavior, other than in the case of LDPR voters, whose use of social media tracked with their propensity to vote for the party. To some extent this is a significant finding, as the LDPR’s election advertising strategy – as well as Zhirinovsky’s prolific use of Twitter – made a more focused attempt to connect over the internet than most of the others.. 24.
(25) Table 9 Evaluating the Explanations for Party Support, 2016 LDPR. Social background Gender (male) Age (decades) Tertiary education Pensioner Good standard of living Economic performance Country economy past year Family economy past year Approve of Putin Corruption and Bribery Corruption of public officials Corruption better Use of mass media Television Radio Newspapers Internet Constant Pseudo R-squared Log likelihood. CPRF. Est. (SE). Est. .622** .010 -.094 -.164 -.542**. (.205) (.100) (.216) (.466) (.193). .603** .220* .001 .484 -.801**. -.366** -.168 -.659**. (.138) (.141) (.133). -.035 -.290**. (.142) (.095). -.061 -.052 -.148 .209**. (.094) (.085) (.099) (.076). 4.304**. AJR Est. (SE). (.224) (.100) (.245) (.545) (.205). .354 .002 .349 .713 -.619*. (.331) (.016) (.334) (.788) (.302). -.225 .081 -1.216**. (.144) (.150) (.145). -.344 -.151 -.461*. (.222) (.236) (.222). .016 -.475**. (.151) (.108). -.028 -.508**. (.222) (.171). (.114) (.087) (.099) (.084). .092 -.064 -.061 .144. (.163) (.123) (.144) (.116). .111 .014 .140 .035. (SE). 3.499** .288 1880.865 (904). (N). 1.961. ** significant at p<.01, * p<.05, both two-tailed. Estimates are parameter estimates and standard errors from a multinomial logistic regression predicting vote. United Russia is the excluded category. See text and Appendix for details of variables and coding. Source: 2016 Russian Duma Election Survey.. Conclusion This article has examined the voting behavior of Russian voters in the 2016 election, using a large, national survey conducted immediately after the election. As noted at the outset, whilst recent Russian elections are generally predictable in their outcomes, we should not discount the fact that real voters cast real votes, and that the tools of comparative electoral studies can be used to examine the motivations for these voting patterns. Individual surveys provide a unique opportunity to examine and codify these motivations, and to compare them to patterns that have been observed in other countries. 25.
(26) Three main models of voting behavior were examined. First, the question of party identification was discussed. Although most Russian voters do not explicitly identify with a party, there has been evidence in recent years of a stabilization in their voting patterns that suggests that some form of habitual voting is beginning to take shape. Second, the social correlates of the vote were examined. This showed that UR and AJR derived most of their support from women; the LDPR and CPRF from men; and that older voters, all other things being equal, were more likely to vote for the CPRF than younger ones. Third, various aspects of issue voting were discussed. Notwithstanding Russia’s more difficult economic situation, the 54.2 percent of the voters who cast a ballot for UR were more likely to take a benevolent view of the depth of the crisis and the extent to which it had affected them than were voters for the other three parties. There are a number of caveats to these results. First, as noted at the outset, the four parliamentary parties do not represent a full spectrum of policy options. They form a “cartel” that has very few real policy differences, and the Kremlin is happy to ensure the survival of the three nominal opposition parties for the sake of maintaining plurality and avoiding having to fight with more stringent opposition. As such, voters casting their vote for one of these four parties were effectively choosing between four within-system options with different emphases – like choosing between shades of grey, rather than between black and white. We should also not forget that there were 10 other parties in on the party list ballot – even if they did not appeal to many people beyond a narrow niche. The article has focused on the four parliamentary parties because they were the choice of all but 11.2 percent of the voters, and thus represented the party menu from which all but a small minority of people chose. 50 Second, we should remember that Russian parliamentary elections do not choose governments. The separation of power means that the legislature provides the forum through which the executive can implement policy, but it does not actively govern. Apart from the requirement that the Duma vest confidence in the president’s choice of prime minister (not an issue in this case, given that he was appointed to lead 50. The second, methodological reason for omitting the other 10 parties from the study is that the range. of their individual vote shares – between 0.14 percent and 2.27 percent – is too small to yield a statistically representative sample in any case; and it makes no sense to examine their voters as a collective sample, as they ranged across the ideological spectrum.. 26.
(27) the majority party’s list in its election campaign), the actual composition of the government and cabinet is determined outside the parliamentary or party political framework. As such, whilst certain concepts do appear to transfer from the comparative literature, we should be wary of making a direct connection between party voting in State Duma elections, and attitudes toward government policy as a whole. UR is the Kremlin’s and government’s de facto legislative vehicle, but the party follows, rather than leads, the government. Third, we have largely left the single-member district contests out of the scope of this article, but it should not be forgotten that they contributed half the members of the State Duma. In the 1993-2003 period, such contests were essentially local affairs, and it was difficult to generalize from them. The overwhelming constituency success of UR this time round meant that they played a substantial role giving UR its supermajority. Nonetheless, there were often still regional specificities relating to candidates’ local profiles and connections to their constituencies and, indeed, to the party. As such, it is possible to make more generalizable conclusions about Russians’ voting decisions (as well as to make comparisons with previous elections) by restricting our focus to the party list part of the election. The results of the multivariate analysis showed that economic evaluations, together with attitudes towards Putin, and perceptions of corruption, were amongst the most salient predictors of people’s propensity to cast a vote for the status quo (in this case, the UR party) or to vote for one of the parliamentary opposition parties. These results confirm the continuing burden of corruption for the lives of ordinary Russians, and the enduring inability of the major parties to deal with it. Leadership remains important in structuring the vote, but reflected solely in the personality on Vladimir Putin. In many ways, Putin acts as a surrogate for party identification. Given that he was not a candidate in the election, it is surprising to find that his presence was so powerful. When he finally leaves the political stage, and in the absence of a leader with a similar profile, we might speculate that partisanship would rise in importance – or that the party system will realign significantly as Putin and the generation of current party leaders move on. But the 2016 election was about ensuring that that scenario – if and when it comes – is prepared for as smoothly as possible. Returning to our starting point, the article has also shown that there are clear differences in the profiles of those who vote for United Russia and the other three 27.
(28) parties. As such, UR’s victory in the election was not just the result of a pre-planned mobilization of voters on the part of the authorities, but also its appeal (or lack of same) to particular segments of the electorate. As stated at the outset, we should therefore see elections – and the need to channel the electoral behavior of voters – as an integral part of the mechanism by which the Russian government and the Kremlin continue to maintain consent among the public. As David White explains in the next article of this volume, those who see the Putin regime as being in danger of imminent collapse may be underestimating its resilience and capacity to continue attracting public support and adapting to changing political circumstances. 51. Appendix Data. The data come from a representative public opinion survey conducted nationally in Russia in 2016. Fieldwork took place between 23 September 2016 and 18 October 2016 and used a personal interview method based on a stratified random sample of households. A total of 2,003 interviews were completed, representing a response rate of 51 percent. Measurement. For the multivariate analyses reported in table 9, the dependent variable is vote measured by vote for the four major parties, with UR representing the excluded category. The scoring and means for the independent variables are listed in Appendix table A1; question wordings appear as a note to each table in the article.. 51. David White, “Modifying Electoral Authoritarianism: What the 2016 Parliamentary Elections Tell. Us About the Nature and Resilience of the Putin Regime”, Russian Politics 2, no. 4 (2017): XXX-XXX.. 28.
(29) Appendix Table A1. Variables, Scoring and Means. Variable Vote UR LDPR CPRF AJR Social background Gender Age Tertiary education Pensioner Good standard of living Economic performance Country economy past year Family economy past year Approve of Putin Corruption and bribery Corruption of public officials Corruption better. Use of mass media Television. Radio Newsapers Internet. Scoring 1=yes, 0=no —as above— —as above— —as above—. Mean .568 .153 .139 .051. 1=male, 0=female Decades 1=yes, 0=no 1=yes, 0=no. .444 4.479 .280 .264. 1=very poor, 2=poor, 3=average, 4=good, 5=very good. 2.845. 1=much worse, 2=somewhat worse, 3=same, 4=somewhat better, 5=better —as above— 1=strongly disapprove, 2=disapprove, 3=approve, 4=strongly approve. 2.513. 1=almost all corrupt, 2=majority, 3=some, 4=hardly any 1=significantly increased, 2=increased a little, 3=same, 4=reduced a little 5=significantly reduced. 1.852. 5=never, 2=rarely, 3=once twice a week, 4=several times week, 5=everyday —as above— —as above— —as above—. 3.951. 2.483 3.097. 2.089. 2.384 2.227 2.820. Source: Russian Duma Election Survey, 2016.. Trends are derived from a combination of the 2016 survey with previous surveys conducted by the same authors and collaborators (with similar questionnaires and methodologies): . Centre for the Study of Public Policy, University of Strathclyde, New Russian Barometer 8 survey (2000), New Russia Barometer VIII, fieldwork conducted by VTsIOM, 13-29 January 2000, N=1,940 (see also Richard Rose, Russian. 29.
(30) Between Elections: New Russian Barometer VIII (Glasgow: CSPP Publications, 2000)). . Stephen White, Margot Light and Roy Allison, Inclusion without Membership? Bringing Russia, Ukraine and Belarus closer to “Europe” dataset, funded by ESRC grant RES-000-23-0146, fieldwork conducted by Russian Research Ltd, 21 December 2003-16 January 2004, N=2,000.. . Derek S. Hutcheson, Stephen White and Ian McAllister, Russian Election Survey dataset, co-funded by British Academy Small Research Grant BA40918 and ESRC grant RES-000-22-2532, fieldwork conducted by Russian Research Ltd., 30 January-27 February 2008, N=2,000. . Stephen White and Ian McAllister, National representative survey dataset funded by UK ESRC grant RES/062-26-1378, fieldwork conducted by Russian. Research Ltd., 12 February-1 March 2010, N=2,017. . Stephen White and Ian McAllister, Russian Election Survey dataset, fieldwork conducted by Russian Research Ltd., 3-23 January 2012, N=1,600.. . Stephen White, Jane Duckett, Ian McAllister and Neil Munro, National representative survey dataset co-funded by UK ESRC grants ES/J012688/1 and ES/J004731/1, fieldwork conducted by Russian Research Ltd., 25 January-. 17 February 2014, N=1,601. . Ian McAllister and Stephen White, 2016 Russian Duma Election Study, funded by the Australian National University, fieldwork by R-Research, 23 September-18 October 2016, N=2,003.. 30.
(31)
Figure


+7


Related documents
On the one hand, Choice gave the patient a voice, enhanced the patient’s strengths and prepared both nurses and the patient for communication and promoted an engagement in shared
Conducted empirical analysis proves that the shadow economy has mainly negative effect on social development and this effect is dependent on the level of
The aim of this study is to, through a historical perspective on rural livelihoods and policy regimes, uncover the political and economic processes, with their discursive
In the essay, it is demonstrated that a didactic world composed of Mrs March‟s unique way of education does indeed offer the implied reader valuable moral lessons about life in
The high volumetric capacitances, long lifetime, and high transmittance make the organic ionogel electrolyte based Ti 3 C 2 T x exible supercapacitor the best choice for the
Therefore, low emphasis was put on other sectors than the mining and today copper constitutes close to 80% of Zambia’s total export and 12% of the country's GDP (Observatory
credit risk means that counterparties fail to meet their obligations and the risk that pledged collateral does not cover the debt. Hakon invest’s financial and investment
Historical perspectives on modernisation, rural policy regimes and smallholder poverty - a case from Eastern Zambia.
