An IoT Software Architecture for an Evacuable Building Architecture
Henry Muccini University of L’Aquila, Italy
henry.muccini@univaq.it
Claudio Arbib University of L’Aquila, Italy
Claudio.arbib@univaq.it
Paul Davidsson Malmo University, Sweden
paul.davidsson@mau.se
Mahyar T. Moghaddam University of L’Aquula, Italy
mahtou@univaq.it
Abstract
This paper presents a computational component designed to improve and evaluate emergency handling plans. In real-time, the component operates as the core of an Internet of Things (IoT) infrastructure aimed at crowd monitoring and optimum evacuation paths planning. In this case, a software architecture facilitates achieving the minimum time necessary to evacuate people from a building. In design-time, the component helps discovering the optimal building dimensions for a safe emergency evacuation, even before (re-) construction of a building. The space and time dimension are discretized according to metrics and models in literature. The component formulates and solves a linearized, time-indexed flow problem on a network that represents feasible movements of people at a suitable frequency. The CPU time to solve the model is compliant with real-time use. The application of the model to a real location with real data testifies the model capability to optimize the safety standards by small changes in the building dimensions, and guarantees an optimal emergency evacuation performance.
1.
Introduction
Constructing large buildings is subject to various human safety considerations, specially when it deals with dynamic and unpredictable environmental incidents such as fire and earthquake. Designing a building architecture that minimizes all safety risks is complex, since there is no precise and standard mechanism to assess the building quality properness when the building does not yet exist.
In order to design and use a safety oriented building that facilitates emergency evacuation in case of a disaster, a number of issues should be addressed: what are the building restrictions that may make trouble for people and prevent them to save their lives (bottlenecks and obstacles)? Instead, what building characteristics may improve their safety and quickness towards a safe
place? Up to what capacity a building can facilitate a smooth flow of people? In post-construction phase, how crowd evacuation can be facilitated by showing the best paths towards safe areas? Overall, how a proper building architecture can save lives in emergency situations? This is the point in which software supports the building architects. A precise software architecture, with a strong mathematical algorithm in behind, can show the architects and emergency managers what the future may look like.
By modeling a building as a network of nodes (corresponding to the building’s space, organized into a suitable grid) and arcs (representing passages between adjacent cells), we propose a network flow algorithm that is capable to support a precise simulation at design-time and an optimal evacuation handling at real-time. Run-time (or design-time) data are used to create an acyclic digraph that models all the feasible transitions between adjacent cells at any given time slot, given the current occupancy status of each cell. Minimizing the total evacuation time corresponds then to solve a mathematical program that, in the final refinement, has the form of a linear optimization problem.
In the present context, an optimal solution does not have — of course — a big prescriptive validity: in other words, optimal flows through the building might in general be difficult to implement in practice (i.e., in case of risk, people tend to move quite unpredictably). The interest of an optimal solution mainly lies in its numerical value, that is the minimum amount of time necessary, in ideal conditions, to let a given distribution of people out of the place. This number can be used to monitor safety conditions from time to time.
The paper is organized as follows. Literature is briefly discussed in Section 2. Section 3 defines the concept of evacuability and different emergency handling challenges in real-time and design-time. The self-adaptive architectures for IoT infrastructures are presented in Section 4. Section 5 presents the flow model whilst Section 6 discusses the static and dynamic
risks that may happen during a disaster. Section 7 refers on how model parameters should be set up to deal with real cases. The application of the model to a real exhibition venue is presented in Section 8 and conclusions are finally drawn in Section 9.
2.
Literature Review
2.1.
Software Architecture for Emergency
Handling
Despite that a large body of knowledge has been proposed for surveillance software architectures, the research gap towards emergency evacuation architectural design is undeniable. However, the few related works deal with a small subset of disaster management architecture. Lujak et al [1] propose a distributed architecture for situational aware evacuation guidance in smart buildings. They use WiFi, RFiD and Beacon for identification and sensing purposes. The users smart-phones act as reader of the beacon signals to localize and track the users. However, their architecture remains in an abstract level and a proper evaluation is not provided.
In order to support coordinated emergency management in smart cities based on the localization of first responders during crisis events, Palmieri et al [2] present a hybrid cloud architecture to manage computing and storage resources needed by command and control activities in emergency scenarios. Their first responder localization service relies on a novel positioning approach which combines the strength of signals received from landmarks placed by first responders on the crisis site with information obtained from motion sensors. Despite the level of distribution and its impacts on system non-functional requirements are not clear, their research can be considered as a proper complementary work to our architectural model, by adapting the geolocation of first responders to track people during an evacuation.
2.2.
Optimization Algorithms for Evacuation
Routing Problems
In literature, the Evacuation routing problems (ERP) are addressed by either static or dynamic algorithms. Indeed, a static network cannot properly model time related constraints, and a dynamic view can then be obtained by a sort of time expanded network that models flows over time. Choi et al [3] model building evacuation by dynamic flow maximization, considering variable capacities on some arcs as a function of flows in incident arcs. Chen et al. [4] propose a flow control algorithm that calculates evacuation
First aid kit Fire extinguisher Emergency exit
Fire hose reel
Alarm button Main switchboard W.C. Room W.C. Room Room Room Room Room Room Room Room Room Room Room Room Room Room Technical Room Room Room Room Room Room Room Conference Hall Room Hall Hall Room Evacuation Path
Figure 1. Static emergency plan related to our case study (see Section 8)
paths depending on building plan and total number of evacuees. Computation in this case aims at minimizing total evacuation time and assigning an optimal number of evacuees to each evacuation path. However, as network size increases, the flow model can no longer be solved in reasonable time.
However, one of the most crucial issues addressed in the recent literature is the ability of finding good feasible solutions in short time, which makes them capable be used as the computational core of a real-time (or design-time) software architecture. Nowadays solvers, in fact, get easily rid of very large problems in fractions of seconds: dealing with more variables helps on one hand obtain enough resolution to model the necessary details (in terms of both discretization and non-linearities); on the other hand, quick re-computation allows to cope with data that dynamically change over time.
3.
Building Evacuability: envisioned
solution
Emergency evacuation handling for large scale roads and buildings is complex. Nowadays, evacuation plans appear as static maps, designed by civil protection operators, that provide some pre-selected routes through which pedestrians should move in case of emergency. The static models may work in low congested spacious areas. However, the situation may barely be imagined static in case of a disaster.
The static emergency map of the physical space for which our model is run (see Section 8) is shown in Figure 1. These kind of maps expose several limitations such as: i) ignoring abrupt congestion, obstacles or dangerous routes and areas; ii) leading all pedestrians to the same route and making that area highly crowded; iii)ignoring the individual movement behavior of people and special categories (e.g. elderly, children, disabled); iv) lack of providing proper trainings for security
operators in various scenarios; v) lack of providing a comprehensive understanding for evacuation manager and operators by a real-time situational awareness. The advent of IoT architectures may support a quicker and safer evacuation. By simply tracking people in an indoor area, possible congestions can be detected and best evacuation paths can be periodically recalculated, or minimum evacuation time under ever-changing emergency conditions can be evaluated.
We foresee design-time and run-time solutions. At design-time, a building architecture can be subject to safety evaluations even before its (re-) construction. We advocate the use of simulations as a feasible solution to assess the evacuability of buildings and feasibility of evacuation plans. However, a strong mathematical model should support the simulation tool. At design-time, an IoT-based evacuation system provides: i) Safety considerations for building architecture in early (re-) construction phase; ii) Finding out the building dimensions that lead to an optimum evacuation performance; iii) Bottleneck discovery that is tied with the building characteristics; iv) Comparing various routing optimization models to pick the best match one as a base of real-time evacuation system; v) Problem solutions for different time horizon provide a Pareto frontier that relates available time to the best possible people outflow in the given conditions; vi) Visualizing dynamic evacuation executions to demonstrate a variety of scenarios to security operators and train them.
At real-time, the IoT architecture we propose supports the gathering of data that will be used for dynamic monitoring and evacuation planning. At real-time, an IoT-based evacuation system provides: i) Optimal solutions that can be continuously updated, so evacuation guidelines can be adjusted according to visitors position that evolve over time; ii) Paths that become suddenly unfeasible can automatically be discarded by the system; iii) The model can be incorporated into a mobile app supporting emergency units to evacuate closed or open spaces.
4.
Self-adaptive IoT Architectures for
Emergency Handling
An IoT-based emergency evacuation architecture is defined as a safety critical IoT infrastructure to be used to collect and analyze data to perform proper actuation. In order to engineer such a high quality IoT application, a proper architecture should be designed with the ability to adapt itself to environment transformation, and in a proper level of elements distribution.
In our previous work [5], we classified IoT distribution patterns as: centralized, collaborative,
Figure 2. Selected self-adaptation architectural patterns
connected intranets, and distributed based on a layered architectural style that consists of Perception, Processing and Storage, and Application layers.
Furthermore, Muccini et al [6] analyze a set of IoT distribution and self-adaptation patterns to identify their suitable architectural combinations. Here self-adaptation is based on a control loop such as MAPE (Monitoring, Analysis, Planning, Execution), that is a model objected on imposing automatic control on dynamic behavior of a system and has been used in various fields such as software engineering. However, we realized that most of adaptation patterns are unmatched with IoT distribution patterns, so that making a combination of them can be infeasible or weak. Furthermore, among feasible combined patterns, only two of them satisfy non functional requirements for IoT based emergency evacuation systems, that are fault-tolerance, performance, interoperability, scalability and energy efficiency. Therefore, in this work, we make a concrete use of those two suitable architectural patterns: collaborative regional planning and centralized master/slave.
Figure 2 shows the aforementioned self-adaptation control patterns. In the figure, managed subsystems (MS) comprise the application logic that provides the systems domain functionality. The managing subsystems instead manage the managed subsystems and comprise the adaptation logic. In the collaborative regional planningpattern, the local planners coordinate to find the best adaptation solution for a local or global problem. This pattern is suitable for our case study because of its high coordination of planners and low coordination of other local adaptation components (M, A, E) to provide fast and energy efficient decisions. The centralized master/slave pattern facilitates centralized decision making, and local monitoring and adaptation execution. This pattern is chosen as well since it simplifies achieving global objectives through central implementation of analysis and planning algorithms.
For both aforementioned patterns, the computational component adopted, will thus become the central element that, while inputting situational awareness information, will provide evacuation recommendations. This central computational component has a
mathematical logic in behind that is proposed as an algorithm in the following section.
5.
A Flow Model to Minimize Total
Evacuation Time
5.1.
Building Topology and Crowd Flows
The topology of the building to be evacuated is described by a graph G = (V, A) with nodes corresponding to the unit cells i obtained by embedding the building into a suitable grid [3] [7]. Grid geometry and size lead to different levels of accuracy. We observed that, in general, cells may have different shapes or sizes: for the purpose of our work what is important is that every cell can approximately be traversed, in any direction, in a single time slot. Cell 0 conventionally represents the outside of the building, or in general a safe place. Safe places can even be disconnected areas, but as their capacity is assumed large enough to guarantee safety, we will represent them all by a single cell (therefore what we assume about cells traversing time does not apply to cell 0). Arcs of G correspond to passages between adjacent cells: the passage has full capacity if cells share a boundary not interrupted by walls, and a reduced capacity otherwise. With no loss of generality, arcs are supposed directed.
Let us denote:
T = {0, 1, . . . , τ }, set of unit time slots;
yit= state of cell i ∈ V at time t ∈ T , that is, the number of persons that occupy i at t: this number is a known model parameter for t = 0 (in particular, y00 = 0) and a decision variable for
t > 0;
ni= capacity of cell i: it measures the maximum
nominal amount of people that i can host at any time (in particular, n0 ≥ Piy
0
i); this amount
depends on cell shape and size; if cells can be assumed uniform one can set ni = n for all
i ∈ V, i 6= 0. xt
ij= how many persons move from cell i to an adjacent
cell j in (t, t + 1]: this gives the average speed at which the flow proceeds from i to j;
cij= capacity of the passage between cell i and cell
j: this is the maximum amount of people that, independently on how many persons are in cell j, can traverse the passage in the time unit (independence on cell occupancy means neglecting system congestion: we will consider this issue later).
The flow model uses an acyclic digraph D with node set V × T and arc set
E = {(i, t) → (j, t + 1) : ij ∈ A, t ∈ T } In other words, D models all the feasible transitions (moves between adjacent rooms) that can occur in the building in the time horizon T .
Transitions are associated with the x-variables defined above, whereas y-variables define the occupancy of each room (and of the building) from time to time. The x- and y-variables are declared integer and subject to the following constraints:
ytj− yt−1 j − X i:ij∈A xt−1ij + X i:ji∈A xt−1ji = 0 (1) j ∈ V, t ∈ T, t > 0 0 ≤ xtij+ xtji≤ cij t ∈ T, ij ∈ A (2) 0 ≤ yti ≤ ni t ∈ T, i ∈ V (3)
Equation (1) is just a flow conservation law: it expresses the occupancy of cell j at time t as the number yt−1j of persons present at time t−1, augmented of those that during interval (t − 1, t] move to j from another cell i 6= j, minus those that in the same interval leave cell j for another room i 6= j. Box constraints (2), (3) reflect the limited hosting capability of the elements of G.
5.2.
Maximizing Outflow in a Given Time
To model the relation between time and people outflow, one can try to maximize the number of persons evacuated from the building within τ :
max y0τ (4)
To find the minimum total evacuation time, one can solve this model for different τ , looking for the least value that yields a zero-valued optimal solution. To reduce computation time, this optimal τ can be computed by logarithmic search. The method can thus provide the decision maker with the Pareto-frontier of the conflicting objectives min{τ }, max{yτ0}.
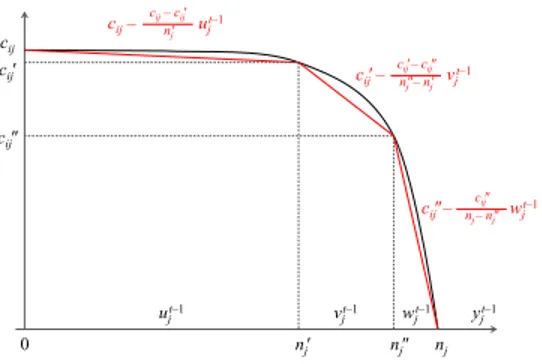
The linear structure of the model allows its solution with a large number of variables. Adding variables can help improve model granularity by reducing space and time units (e.g., counting people every 5 seconds instead of every minute). More importantly, it can also help approximate the non-linearities of arc capacities. In fact,
yjt–1 nj cij nj' nj" ujt–1 vjt–1 0 wjt–1 cij' cij" cij– ujt–1 cij– cij' nj' cij' – vjt–1 cij' – cij" nj" – nj' cij" – wjt–1 cij" nj– nj"
Figure 3. Congestion curve and a linearization
cij constant in (2) fails to model congestion, that is a
situation in which the speed at which the system empties is a decreasing function of room occupancy. A more accurate model of congestion requires arc capacity to be a concave decreasing function of room occupancy, see Figure 3. Linearizing concavity one can rewrite yit−1= ut−1i +vt−1i +wt−1i xtij = φtij+χtij+ψijt
(5) with ut−1i , vt−1i , wt−1i non-negative and subject to upper bounds ut−1i ≤ n0i v t−1 i ≤ n 00 i−n0i w t−1 i ≤ ni−n0i (6) Arc capacity constraints (2) are then replaced by
0 ≤ φtij ≤ cij− cij− c0ij n0 v ut−1j (7) 0 ≤ χtij ≤ c0ij−c 0 ij− c00ij n00j− n0 j vt−1j 0 ≤ ψijt ≤ c00ij− c 00 ij nj− n00j wjt−1
Consistency of the φ, χ and ψ variables with the x flow variables requires χ = 0 (ψ = 0) if φ (if χ) does not saturate its capacity. This is ensured, at optimality, by the properties of basic solutions. After rephrasing (7): 0 ≤ φtij φtij+ aijut−1j ≤ cij (8) 0 ≤ χtij χtij+ a0ijv t−1 j ≤ c 0 ij 0 ≤ ψtij ψijt + a00ijwjt−1 ≤ c00ij where aij = cij− c0ij n0 j a0ij =c 0 ij− c00ij n00 j − n0j a00ij = c 00 ij nj− n00j
and aij < a0ij < a00ij, we observe the following
fact (that can be generalized to any piecewise linear approximation of the congestion curve).
Proposition 1. Suppose that, in a feasible solution, ¯
ut
i< n0iand¯vit> 0. Let
δ = min{n0i− ¯uti, ¯vit}
Then a solution with ut
i = ¯uti + δ, vti = ¯vit− δ and
the other components unchanged is also feasible and no worse than the given one.
Proof. In fact, by definition of δ, ut
i ≤ n0i and vit ≥
0. Moreover, by the first of (5) the occupancy of i at t remains unchanged. As far as the implication on φ, χ is concerned, the sum of the relevant arc capacities is increased by δ(a0ij − aij) > 0. Thus it is possible to
compensate a decrease of ¯φtij with an identical increase of ¯χt
ij, resulting by the second of (5) in an equivalent
flow xtij.
6.
Risk Consideration
Despite that final objective of emergency handling plans are to minimize the evacuation time, safety risks have a critically important role. In the model discussed in Section 5, cells adjacency is modeled via a graph, to be able to model real-time changes in which the risky or infeasible paths are automatically discarded by deletion in the graph. However, due to low predictability essence of a disaster, considering risk aspects in design-time is complex.
Some disasters (such as earthquake) have a momentary impact on buildings, in which the risk appears as ruined areas or unavailable paths, so that it can be modeled via static changes in the graph in a specific time step. For the other category of disasters (such as fire), the risk can be propagated over time. In this case, different cells may be influenced by their neighbor during evacuation time steps. In our algorithm, dynamic propagation means that graph G changes (with a form of arc removals) over time, that is, set A is progressively reduced and has the form At. This has an effect on digraph D and set E, that becomes in turn Et. Consequently, all the constraints that depend on A
or E will then be rewritten for At and Et. It is worth
mentioning that, decision variables are reduced as well: xt
ijis in fact defined for all ij in At(which are generally
In both aforementioned categories of risk: i) the risky cells should be evacuated as quick as possible; ii) no one should be entered inside them; iii) disaster suppression equipment should be brought to the risky cells. In our example of application, we simulate a situation of static risk, however, due to the page limits of a conference paper, we address the dynamic risk concept in our future work.
7.
Setting Model Parameters
To get a reliable model, parameters must be set to numbers that reflect reality. Those numbers depend on several considerations, the most relevant being: model granularity, walking velocity in various conditions, door entrance capacities, cell capacities.
7.1.
Model granularity
The issue of model granularity touches both spatial and temporal units, and affects the shape and size of the unit cells in which the building is decomposed, as well as the slots that form the evacuation time horizon.
As described in the previous sections we embed the building plan into a grid, whose cells are assumed isometric: that is, can be crossed in any direction in the same amount of time. That amount will define the time slot duration, and cells will be regarded as virtual unit rooms that communicate one another via physical or virtual (i.e., open space) doors. Grid geometry can vary. Ideal isometric cells are circles, but circles are not embeddable into a grid with adjacent cell sides. Hexagon cells are a good compromise between isometry and plan embedding. However, in our study case we found room sizes and shapes well compatible with a square grid where each room is split into an integer number of cells.
7.2.
Walking velocity
The cornerstone on which the length of each unit time slot in T — and consequently its reciprocal, the monitoring frequency — is established, is the free flow walking velocity, i.e. the speed at which humans prefer to walk in non-congested and non-hampered conditions. Clearly, its value varies for different categories of people, such as child, adult, elderly, disable etc. This parameter is important to perceive the distance that an individual can possibly walk during a specific period of time. Through its evaluation one can define the cells in which an area is to be divided for best approximation of traveling time. Table 1 reports different evaluations of pedestrian free flow velocity found in literature.
For optimization purposes in which a global velocity
Table 1. Pedestrian free flow velocity
Flat (m/s) Reference under 65 over 65 1.36 Fruin 1971 [8] 1.36 Weidmann 1993 [9] 1.25 0.97 Knoblauch et al. 1996 [10] 1.042 - 1.508 0.889 - 1.083 TranSafety Inc. 1997 [11] 1.20 Ye et al. 2008 [12]
value is needed, we stay at Ye’s estimate considering the average free flow walking speed for a flat surface equal to 1.2 m/s. However, this is an assumption and a more realistic model that supports different individual speeds for various categories (via defining different reaction times) is further explained as our future work.
7.3.
Door capacity
The capacity of a door depends on such various aspects as user composition, door type (always open, open when used, turnstile), crowdedness and, last but not least, door width. A study by Daamen et al. [13] focuses on the relationship between door capacity, user composition and stress level, arguing an average 2.8 persons per second for a 1-meter width door (p/m/s). They argue a door capacity range between 1.03 P/m/s and 3.23 P/m/s, resulted from a literature review. Taking advantage of the aforementioned review, we carry out our case study simulations considering the pessimistic (1.03 p/m/s) and optimistic (3.23 p/m/s) values in order to assess this parameter impact on the evacuation time. Therefore, a maximum number of 5 persons in pessimistic and a maximum number of 16 persons in optimistic situation can pass through a 1-meter width door per time slot (5 seconds), whilst the capacity is proportional to door width.
7.4.
Cell capacity
The pedestrian density is the number of persons per square meter monitored at any time. This information is crucial for crowd safety and evacuation performance, as movements are dramatically reduced in highly dense areas. As density increases, pedestrian movements become constrained and flow rate consequently decreases. According to UK fire safety regulations, the maximum allowed density corresponds to 0.3 square meters per standing person, a value that increases to 0.5 for public houses, to 0.8 for exhibition spaces, to 1.0 for dining places, to 2.0 for sport areas and to 6 for office areas. Therefore, in our case study — gallery indoor space — the maximum capacity of each cell shall be calculated by assuming 0.8 square meters per visitor, that is 1.25 persons per square meter.
0
4.5 6 6 6 9 6 6 6 6 3 15 9 3 4.5 6 3 30
0
0
4.5 4.5 4.5 4.5 4.5 4.5 4.5 4.5 4.5 6 1 2 3 4 5 6 7 8 9 10 11 12 13 14 15 16 17 24 18 19 20 21 22 23 25 26 27 28 29 30 31 32 33 34 35 36 37 38 39 40 41 42 43 44 45 46 47 48 49 50 51 52 53 54 55 56 57 58 59 60 61 62 63 64 65 66 67 68 69 70 71 72 73 91 75 76 77 78 79 80 81 82 83 84 85 86 87 88 89 90 74 92 93 94 95 96 97 98 99 100 101 102 103 104 105 106 107 108 109 110 111 112 1 m 1 m E 1 meter E’ 1 meter E’’ 1 meter E’’’ 1 meter 1 m 1 m 1 m 1 m 1 m 1 m 1 m 1 m 1 m 1 m 1 m 1 m 1 m 1 m 1 m 1 m 1 m 1 m 1 m 1 m 1 m 1 m 1 m 1 m 1 m 1 m 1 mFigure 4. Embedding of Alan Turing building architecture into a square grid
8.
Example of Application
Using the measures discussed in the previous section, we next describe an application of the model of Section 5 to evacuability assessment of Alan Turing, a building at l’Aquila University (Italy) normally used for exhibitions. By setting optimistic and pessimistic parameters (see Section 7), in this section, we run various simulations to assess the application of our model on: i) discovering the optimal evacuation time that results from crowd routing via ideal evacuation paths and compare it with the evacuation time that derives from static shortest path; ii) evaluating the evacuation time in a static risk situation (see Section 6); iii) providing guidelines in order to adapt the building architecture with a better safety condition.
The building consists of 29 rooms and 4 main corridors. Rooms sizes vary in a large range, and so the average time of a person to cross them from door to door is required. As explained in §5, we split each room in unit cells, each behaving as a (virtual) quasi-square room that can be traversed in a unit time slot. In practice, we embedded the building plan into a quasi-square grid as shown in Figure 4. The embedding results in a graph with 112 nodes (Figure 5) corresponding to the cells of Figure 4 and including node 0 as safe place. Adjacent cells are linked by 264 arcs which allow people to flow inside the building. All arcs are assumed bidirectional except the four towards the safe place. A time slot corresponds to the time required for crossing one cell: using average free flow speeds from §7 and considering cell size, we obtained time slots of 5 seconds each, and therefore the monitoring frequency. All doors have 1-meter width, so with a similar pessimistic / optimistic capacity. As a rule of thumb, no more than 5 persons in pessimistic and no more than 16 persons in optimistic
3 2 1 4 5 6 9 8 7 10 11 12 15 14 13 16 17 18 21 20 19 22 23 24 27 26 25 28 29 30 33 32 31 34 35 36 39 38 37 40 41 42 45 44 43 46 47 48 49 50 68 69 70 73 72 71 74 75 76 79 78 77 80 81 82 85 84 83 86 87 88 91 90 89 92 93 94 96 95 51 0 52 55 54 53 56 57 58 61 60 59 62 63 64 67 66 65 100 97 99 98 101 102 103 104 105 106 107 108 109 110 111 112
Figure 5. Network associated with the plan of Figure 4
situation can pass through a 1-meter width door (or free space) per monitoring frequency. In all simulation scenarios, we computed the minimum time required to N persons, randomly distributed in the building rooms, for reaching a safe place. The code for simulation was written on OPL language and solved on CPLEX version 12.8.0. We ran all the experiments on a Core i7 2.7GHz computer with 16Gb of RAM memory under Windows 10 pro 64-bits.
Ideal evacuation paths V.S. static shortest paths In the first simulation, we suppose an initial occupancy of N = 1008 (based on real data), which relatively represents the area as highly crowded. We solved problem (1)-(8) for τ = 1, 2, . . . until a solution of value N is found.
Pessimistic. Table 2 reports the number of evacuees (column 2 and 5) at each τ and the computation time of each resolution step (column 3 and 6) for pessimistic path capacity scenario. In terms of evacuation time, everyone has reached the safe place in 4 minute and 15”. As shown in the table, computations require 6.47 seconds (presolve included) in the worst case and are therefore totally compliant with real-time applications. This first simulation depicts an ideal situation in which flows autonomously choose the best among all the available routes in the building. Of course, managing such an ideal evacuation is not easy and perhaps unpractical. As a general practice, in fact, evacuation is conducted through pre-determined routes. Therefore, in a second instance, we consider the static emergency plan (see Figure 1) in which the prescribed evacuation routes are the shortest paths from any cell to the safe place. In this situation and for pessimistic scenario, evacuating
Table 2. Ideal evacuation paths - pessimistic path capacity scenario
τ evacuees CPU Time τ evacuees CPU Time
1 20 0.28 sec 27 540 2.61 sec 2 40 0.31 sec 28 560 2.77 sec 3 60 0.44 sec 29 580 2.84 sec 4 80 0.53 sec 30 600 2.96 sec 5 100 0.47 sec 31 620 3.10 sec 6 120 0.58 sec 32 640 3.53 sec 7 140 0.60 sec 33 660 3.32 sec 8 160 0.61 sec 34 680 3.54 sec 9 180 0.71 sec 35 700 3.91 sec 10 200 0.76 sec 36 720 3.42 sec 11 220 0.83 sec 37 740 4.14 sec 12 240 0.88 sec 38 760 4.16 sec 13 260 1.01 sec 39 780 4.17 sec 14 280 1.09 sec 40 800 4.19 sec 15 300 1.12 sec 41 820 4.30 sec 16 320 1.44 sec 42 840 5.13 sec 17 340 1.28 sec 43 860 5.07 sec 18 360 1.33 sec 44 880 5.12 sec 19 380 1.57 sec 45 900 5.27 sec 20 400 1.61 sec 46 920 5.36 sec 21 420 1.73 sec 47 940 5.49 sec 22 440 1.88 sec 48 960 6.01 sec 23 460 2.02 sec 49 980 6.35 sec 24 480 2.08 sec 50 1000 6.25 sec 25 500 2.19 sec 51 1008 6.47 sec 26 520 2.35 sec Optimistic
Figure 6. Ideal evacuation and evacuation along
shortest paths
1008 individuals takes of course more time: 5 minutes and 35 seconds.
Optimistic. In a second scenario, we repeated the simulation using optimistic parameters with a higher paths capacity. In this case everyone can reach the safe place after 16 time slots, i.e., 1 minutes and 20”. Also in this case, computation time is short, being always under 3 seconds including presolve. In a second instance, we again suppose that the prescribed evacuation routes are the shortest paths from any cell to the safe place. In this situation, evacuating 1008 individuals takes 1 minute and 45”.
By comparing two simulations that are run in each scenario, we observe that people flows plainly for some time (1 min and 45” in pessimistic and 30” in optimistic scenario). After that time, shortest routes start experiencing congestion, and evacuation is slowed
0 100 200 300 400 500 600 700 800 900 1000 5 30 55 80 105 130 155 180 205 230 255 280 305 330 355 380 405 430 455 480 505 Pe op le n ot y et ev acu at ed Time (seconds)
Pessimistic under risk Optimistic under risk
Figure 7. Evacuation time under a static risk for
pessimistic and optimistic paths capacity
0 20 40 60 80 100 120 140 0.4 0.5 0.6 0.7 0.8 0.9 1 1.1 1.2 1.3 1.4 1.5 1.6 1.7 1.8 1.9 2 2.1 2.2 2.3 2.4 2.5 2.6 2.7 2.8 2.9 3 Ev acu atio n tim e h o rizo n (tau )
Emergency exits width (m)
Pessimistic Optimistic
Figure 8. Evacuation time variations w.r.t. emergency exits width
down. The phenomenon is illustrated in the charts of Figure 6: as one can expect, the tail of people still in the building increases with initial occupancy.
Risk consideration. In another scenario, we assume that two emergency exits (of the four) are blocked due to a static emergency risk (such as earthquake). In this case, the evacuation time increases to 8 minutes and 25 seconds in pessimistic and to 2 minutes and 40 seconds in optimistic path capacity (Figure 7).
Optimum dimensions (emergency exits) In another scenario, considering the same occupancy (N = 1008), we performed continuous simulations by increasing/decreasing the emergency exits width, in order to observe its improvement or deterioration impact on the evacuation time.
Looking at the results shown in Figure 8, for both optimistic and pessimistic path capacities, the evacuation obviously takes longer by decreasing the emergency exits width. The interesting point is that, the evacuation time horizon highly slopes downward by making the exits wider, but up to a certain dimension: 2.3m for pessimistic and 2.2 m for optimistic condition. For exits wider than these measurements, the evacuation time remains constant. The reason is that, having exits
that are wide enough, the evacuation time will not be a function of congestion on exits, rather it will depend on the traveling time and congestion in corridors and internal doors. By performing continuous simulation for other areas, one can make the building architecture optimally evacuable and safe.
Software Architecture of the Example of
Application
From an architectural viewpoint, the system should provide a map of monitored area on the security agents dashboards. If a disaster is detected, an architectural adaptation will take place to perform the evacuation plan. Figure 9 shows self-adaptive software architectures corresponding to the patterns proposed in Section 4. In centralized master/slave pattern (Figure 9, left), the adaptation logic performs by a centralized master component that is responsible for the analysis and planning of adaptations and multiple slave components are responsible for monitoring and execution in the entire building. In collaborative regional planning pattern (Figure 9, right) a regional planner decides for each region. The subsystems provide their planner with necessary information and different planners interact with one another to coordinate adaptations that may span multiple regions.
Both architectures have two adaptation modes: Normal mode and Critical mode. Normal mode: in this mode the sensors read CO2 concentration and temperature in each area every 5 seconds. A timer is set in this mode to schedule the reading from the sensors. A message carrying each value is sent from the output message port of the sensor components to the in port of the central controller in master/slave pattern. In regional planning pattern, the values will be analyzed and planned locally in each area; however, the decision making will take place under coordination of other areas planners to support and approve any required execution. The main goal of this application, to be run on a tablet, is to show a 2D-representation of the monitored space providing also contextual data (sensed by RFID systems) on where the crowd is at any time, and how it moves in normal (and emergency) cases. If instead an emergency is detected, the state of the area will be adapted to critical mode.
Critical mode: in this mode, an adaptation will take place in monitoring level and sensors value will be read more frequently. In addition to show the map on dashboards, a message will be sent to acoustic alarm and evacuation sign actuators of each area to lead people to the safe places. In centralized master/slave pattern, the central controller handles the situation of whole area
based on the network flow model. In collaborative regional planning, instead, the regional controllers in collaboration to each other handle the situation of risky areas based on the proposed algorithm. However, an architecture can qualitatively be better than another. For instance, in our previous work [6] we argued that the energy consumption in collaborative regional planning pattern is higher than centralized master/slave and it receives higher battery level drain due to increased number of exchanged messages.
IoT infrastructure. The IoT infrastructure, whose architecture is sketched in Figure 9, consists of various elements, such as sensing, computation and actuation. For the purpose of this example, we used RFID tags and readers, Beacons, CCTV cameras, and people counters to track crowd movements in the real environment. Each above-mentioned device operates according to its own particular principles and constraints, i.e. RFID technologies and Beacons require to equip pedestrians with special RFID or BT tags, while the use of CCTV cameras and people counters is not constrained to any additional device. Furthermore, mobile phones are becoming increasingly powerful equipped by a set of embedded sensors to be used to detect a disaster or track people in indoor/outdoor areas. In this line, Some tools such as Mission Track let inform and control the localization of people in a risky situation. The system actually facilitates the notification of an incident detected by any observer through a mobile app. In computation phase, some simple analytics (such as crowdedness detection) will typically be done on the edge, then more detailed analysis (such as routing planning) can be performed on the cloud. In actuation step, our evacuation guidance system, interacts to people via an optical arrow that shows the direction to follow on the wall.
Nevertheless, due to legal barriers towards carrying out a real evacuation with our novel tool, we used our IoT infrastructure to monitor the movement of people in the considered physical space to feed the simulation with some gathered data, such as maximum simultaneous presence of crowd. In this line, the initial occupancy that is considered for our simulation scenarios comes from an experiment performed at University of L’Aquila during an exhibition on 15 January 2018, when the simultaneous presence of 1008 people in Alan Turing building was recorded as peak value.
9.
Conclusion
This work uses a network flow model for supporting the rapid evacuation of people from a building in case
Temp Sensor (Room1) CO2 Sensor (Room1) RFID System (Room1) Normal Critical
Dashboard Alarm Evacuation Signs
Controller Planner (Normal) Planner (Critical) o o o o o o i i i i i Fusion Temp Sensor (Room2) CO2 Sensor (Room2) RFID System (Room2) o o o Temp Sensor (Room1) CO2 Sensor (Room1) RFID System (Room1) o o o Temp Sensor (Room2) CO2 Sensor (Room2) RFID System (Room2) o o o Normal Critical Controller Room1 Planner
(Normal) Planner (Critical)
o o o i i Fusion Normal Critical Planner
(Normal) Planner (Critical)
o o o
i i
Fusion
Controller Room2
Dashboard Alarm Evacuation Signs
i i i o o i i
I) Centralized master/slave II) Collaborative regional Planning
Simulator
Evacuation Planner
Analyzer Analyzer Analyzer
Figure 9. Architectural patterns
of emergency, as well as providing safety measurements for complex buildings architectural design.
As a future work, we started to investigate on a new model in which the building area is divided into smaller cells, each can be occupied by a maximum of one individual. Hence, individual moves are subject to availability of free neighbor cells. The cells occupancy, takes place according to persons reaction time. In other words, the model supports different individual speeds via different reaction times: a slower individual will have a higher reaction time. Other possible constraints include the possibility of grouping people (e.g., a couple or a family) into close paths. For instance, one can require that two individuals must be at any time within an specific distance.
Other future work includes: i) considering dynamic risk and human behavior aspects specially in panic situations; ii) feasibility assessment towards integrating mobile applications such as Mission Track (see section 8) with our IoT-based emergency infrastructure; iii) empirical evaluation of the model in extensive scenarios, and comparing estimated vs. real data.
References
[1] M. Lujak, H. Billhardt, J. Dunkel, A. Fern´andez,
R. Hermoso, and S. Ossowski, “A distributed
architecture for real-time evacuation guidance in large smart buildings.,” Comput. Sci. Inf. Syst., vol. 14, no. 1, pp. 257–282, 2017.
[2] F. Palmieri, M. Ficco, S. Pardi, and A. Castiglione, “A cloud-based architecture for emergency management
and first responders localization in smart city
environments,” Computers & Electrical Engineering, vol. 56, pp. 810–830, 2016.
[3] W. Choi, H. W. Hamacher, and S. Tufekci, “Modeling of building evacuation problems by network flows with side constraints,” European Journal of Operational Research, vol. 35, no. 1, pp. 98–110, 1988.
[4] P.-H. Chen and F. Feng, “A fast flow control algorithm for real-time emergency evacuation in large indoor
areas,” Fire Safety Journal, vol. 44, no. 5, pp. 732–740, 2009.
[5] H. Muccini and M. T. Moghaddam, “Iot architectural styles,” in Software Architecture. ECSA 2018. Lecture
Notes in Computer Science, (C. E. Cuesta, D. Garlan,
and J. P´erez, eds.), vol. 11048, pp. 68–85, Springer International Publishing, 2018.
[6] H. Muccini, R. Spalazzese, M. T. Moghaddam,
and M. Sharaf, “Self-adaptive iot architectures: An
emergency handling case study,” in Proceedings of the 12th European Conference on Software Architecture: Companion Proceedings, ECSA ’18, (New York, NY, USA), pp. 19:1–19:6, ACM, 2018.
[7] C. Abib, H. Muccini, and M. T. Moghaddam, “Applying a network flow model to quick and safe evacuation of people from a building: a real case,” in RSFF’18, pp. 50–61, CEUR-WS.org, online, 2018.
[8] J. J. Fruin, “Pedestrian planning and design, metropolitan association of urban designers and environmental planners,” Inc., New York, 1971.
[9] U. Weidmann, “Transporttechnik der
fußg¨anger: transporttechnische eigenschaften
des fußg¨angerverkehrs, literaturauswertung,” IVT
Schriftenreihe, vol. 90, 1993.
[10] R. Knoblauch, M. Pietrucha, and M. Nitzburg, “Field studies of pedestrian walking speed and start-up time,”
Transportation Research Record: Journal of the
Transportation Research Board, no. 1538, pp. 27–38, 1996.
[11] I. TranSafety, “Study compares older and younger pedestrian walking speeds,” Road Management & Engineering Journal, 1997.
[12] J. Ye, X. Chen, C. Yang, and J. Wu, “Walking behavior and pedestrian flow characteristics for different types of walking facilities,” Transportation Research Record: Journal of the Transportation Research Board, no. 2048, pp. 43–51, 2008.
[13] W. Daamen and S. Hoogendoorn, “Emergency
door capacity: influence of door width, population
composition and stress level,” Fire technology, vol. 48, no. 1, pp. 55–71, 2012.