Intrinsically motivated or externally regulated?
-Measuring emerging adults’ motivation for environmental behaviour.
Självbestämt och motiverat eller styrt och kontrollerat?
-en studie om unga vuxnas motivation till miljöbeteende.Authors:
Ola Nyrinder & Anna Strannegård Examiner: Ebba Lisberg Jensen
Supervisor: Kjell Mårtensson
MV109A Miljövetenskap III, 30 hp/ 30 ESCT Urbana Studier, Malmö Högskola
2013-08-21
Abstract
Individuals experience a fundamental change upon becoming adults. They develop lifestyles and habits that they will carry with them throughout the rest of their life. Therefore urging this group to adopt an environmentally friendly lifestyle is vital. The purpose of this study is to identify environmental habits and motivation for pro-environmental behaviour among emerging adults in Sweden. Through a questionnaire survey including 294 responses, the study has found that emerging adults are motivated to engage in environmental activities with identified regulation as the predominant type of regulation. The main barriers for further engagement are the three basic psychological needs for autonomy, competence and relatedness.
Keywords: motivation, pro-environmental behaviour, emerging adults, SDT, environment
Sammandrag
Unga vuxna är en viktig målgrupp att uppmana till att anta en miljövänlig livsstil, då stadiet mellan tonår och vuxenliv präglas av förändring och utveckling av livsstil och vanor. Denna studie syftar till att undersöka unga vuxnas vanor gällande miljöbeteende och vilken typ av motivation de har för att handla miljövänligt. Genom en enkätundersökning som inkluderar 294 svar har denna studie funnit att unga vuxna är motiverade till att vara miljövänliga. Studien visar att identified regulation är den mest dominanta typen av reglering till miljöbeteende. De huvudsakliga barriärerna mot ökat engagemang kan härledas till de tre grundläggande psykologiska behoven autonomi, kompetens och tillhörighet.
Foreword
Writing this thesis has been like walking a winding road. We would like to thank the people showing us the right way and reminding us that, even though the road seems eternal, there will be an end eventually.
Special thanks goes to our supervisor Kjell Mårtensson, for the tolerance and support he has given us along the way. We also would like to send a special thanks to Per Lindquist, for the helpful and patient approach during the questionnaire construction. For encouragement, valuable feedback and many thoughtful discussions, we would like to say thank you to our fellow students.
1
Table of Contents
1 A TIME FOR BEHAVIOURAL CHANGES? ... 1
1.1 AIM AND DISPOSITION OF THE STUDY ... 1
2 EMERGING ADULTHOOD, PRO-‐ENVIRONMENTAL BEHAVIOUR AND MOTIVATION ... 2
2.1 TO BE AN EMERGING ADULT ... 2
2.2 TO ACT IN FAVOUR OF THE ENVIRONMENT ... 3
2.3 TO BE MOVED TO DO SOMETHING ... 4
2.3.1 ON THE SCALE OF SELF-‐DETERMINATION ... 5
2.3.2 PSYCHOLOGICAL NEEDS FOR AUTONOMY, COMPETENCE AND RELATEDNESS ... 7
2.3.3 TO MEASURE MOTIVATION TOWARD THE ENVIRONMENT ... 8
2.4 CONJECTURE AND REFLECTION ... 9
3 A QUESTIONNAIRE STUDY ... 10
3.1 CONSTRUCTION OF THE QUESTIONNAIRE ... 10
3.2 OUR TARGET AUDIENCE ... 12
3.3 METHOD OF ANALYSIS ... 12
3.3.1 STATISTICAL ANALYSIS ... 13
3.3.2 THEME ANALYSIS ... 13
3.4 THE COMPLICATIONS OF DISTRIBUTING A SURVEY ... 15
4 A GENERATION OF GREEN BEHAVIOUR? ... 17
4.1 THE LIFESTYLE OF EMERGING ADULTS ... 17
4.2 PAWNING CANS TO PAY FOR THE NEXT FLIGHT ABROAD? ... 20
4.3 BECAUSE IT´S FUN AND INTERESTING? ... 22
4.4 IDENTIFIED ON THE SCALE OF SELF-‐DETERMINATION ... 24
4.5 RELATING ENVIRONMENTAL BEHAVIOUR TO MOTIVATION ... 28
4.6 INCENTIVES TO BEHAVIOURAL CHANGE ... 30
4.7 FINAL SUMMARY ... 32
5 RATHER INTRINSICALLY REGULATED? ... 34
5.1 CONCLUSIONS ... 34
5.2 A SMALL CONTRIBUTION TO A BIG CHANGE ... 35
REFERENCES ... 37
APPENDIX 1. ... 41
1 A time for behavioural changes?
When teenagers enter adulthood many important lifestyle choices are made (Arnett 2000). This is a time when they start to manage their own life, and freedom and responsibility becomes more important in their everyday life. In Sweden, there were 1 524 578 individuals in between the ages of 18-29 the 31st of December 2012 (SCB 2013). These individuals are defined as emerging adults (Arnett 2000). Emerging adults develop habits and lifestyles today that will influence their actions in the future.
Cooke & Fielding (2010, p. 156) write, “The recognition that many environmental problems are the result of human behaviour highlights the role of environmental psychology in finding solutions to these issues”. Deeper understanding about what motivates people to do things for the environment is essential to change human behaviour. The Self Determination Theory (SDT) is a theory that emphases type of motivation for human behaviour and provides a tool to measure the efficiency of different types of regulation in motivating pro-environmental behaviour (Deci & Ryan 2000; Pelletier et al 1998).
1.1 Aim and disposition of the study
The purpose of this study is to identify environmental habits and motivation for pro-environmental behaviour among emerging adults in Sweden. To fulfil this purpose we will apply the Self Determination Theory and endeavourto answer the following questions: What is the main type of regulation in relation to pro-environmental behaviour within this age group? What life and environmental attributes are associated with emerging adulthood?
Chapter 1 introduces the study’s research area, purpose and disposition. Chapter 2 discusses the problem in more depth, and the theoretical basis of the study is explained. Chapter 3 details the method and research process. In Chapter 4 the results of the empirical study are reported and analysed based on the theoretical framework. The last part of Chapter 4 provides a study summary. Conclusions and reflections are presented in Chapter 5.
2 Emerging adulthood, pro-environmental behaviour and
motivation
What distinguishes young adults' motivation for pro-environmental behaviour from other age groups? Life attributes developed when entering adulthood, such as growing responsibilities, adaption of values and the formation of a family, bring new opportunities as well as obstacles to act environmentally friendly. In this chapter we discuss the challenges facing maturing individuals and present the concept pro-environmental behaviour. We make use of the Self Determination Theory to explain how motivation is measured not only in amount, but also in type of regulation.
2.1 To be an emerging adult
Many young individuals experience a time of fundamental change and importance in their lives from the late teens throughout the twenties (Arnett 2000). This stage in life, from 18-29 years, is called emerging adulthood (Arnett 2011). During this time significant lifestyle choices are made. Arnett (2004) points out that the age during which people enter adulthood has changed over the last few decades. In the 1970s a typical 21 year old was considered to be an adult and probably had the responsibilities of a home, children and a life-partner. The life of a 21 year old today is very different, and many of the commitments associated with adulthood has not yet fully occurred (Arnett 2004). Today, many events and attributes associated with adulthood, such as parenthood and marriage, occur later in life, which provide emerging adults with a time of freedom and exploration (Arnett 2000). During this time they also develop attitudes and worldviews that they will carry with them throughout their lives.
Young people in Sweden today possess an understanding of nature, the environment and society (Lindén 2001). This is partially reflected in their lifestyles, attitudes and opinions. Bennulf (1997) refers to environmentally aware and ecologically oriented individuals as
green, meaning that although research is inconclusive, young people seem to be greener than
other age groups.
On the question of which groups of society that are most green the social science research is inconclusive. [...] However, in a review of the research that exists a flat image of the green front occurs. The Greens are often said to be young, educated urbanites (Bennulf 1997, p. 144).
Despite environmental knowledge and awareness in this age group, studies show that young people do not always lead a thoroughly environmentally friendly lifestyle (Lindén 2001). For example, young people buy more clothes, more often, and consume more electronic devices than other age groups. Their consumption is also more rapid and therefore the lifetime of the goods reduced (ibid). Emerging adults often use their period of freedom to travel (Arnett 2007), a behaviour that contributes significantly to climate change (Bonnedahl 2012). Many studies have tried to explain this so called “value-action gap”, the gap between environmental awareness and environmental behaviour, yet no absolute explanation has been found (Kollmuss & Agyeman 2002).
Ojala (2012) argues that young people are important to include in the discussion of environmental issues, since they are the ones who will suffer the consequences of environmental problems such as global climate change and who, at some point, will govern our society. However, research on environmental behaviour so far has focused on adults (Ojala 2012; Renaud-Dubé 2010). Since emerging adulthood is an essential and a more extended stage in life, it is important to understand this group’s characteristics to be able to urge them to live a more environmentally friendly lifestyle.
2.2 To act in favour of the Environment
Fricker (1998, p. 193) writes, “there is little dispute that our present path is unsustainable” and many people recognize that human behaviours contribute to environmental problems (Gardner & Stern 1996). This has lead to a scientific interest in the topic of pro-environmental behaviour (McDougle et al 2011). Pro-environmental behaviour is “behaviour that consciously seeks to minimize the negative impact of one’s actions on the natural and built world (e.g. minimize resource and energy consumption, use of non-toxic substances, reduce waste production)” (Kollmuss & Agyeman 2002, p. 240). However, the negative impact on the environment of an individual’s action is often relatively small (Biel 1999). A person may perceive that their driving habits have benefits that outweigh the negative consequences such as pollution. If the negative consequences are not sufficiently large the person will not refrain from using the car (ibid). Therefore, individuals’ actions contribute to environmental destruction and everyone needs to adopt a more environmentally friendly lifestyle.
However, to adopt a lifestyle that respects the environment is difficult for many. Research shows that even if people are aware about how their behaviour affects the environment, and even though they see themselves as environmentally friendly, they do not change their habits (Krantz Lindgren 2001; Kollmuss & Agyeman 2002). Kottak (1999, p. 50) argues, “People usually want to change just enough to keep what they have”. Instead of being open-minded for new solutions, we rely on those reflecting the values and lifestyles we already have (Bonnedahl 2012). This approach can be seen as an internal barrier. Other internal, and mental barriers include lack of knowledge, scepticism, habits, distrust of information or feeling disempowered (Lever-Tracy 2010). There might also be external barriers such as societal and infrastructural obstructions. Examples of these are lack of public transportation, faulty architectural infrastructure and a dependence on fossil fuels.
To reduce air and water pollution, waste and the spread of toxic chemicals, the government directs human action and production through taxation, fees, subventions and information (Pihl 2007; Thaler & Sunstein 2008). A general opinion is that our day-to-day behaviours are dependent on values, attitudes and decisions, and that behaviours can be directed by enlightenment and information (Sjödén 1999; Jackson 2005). Information spreading is based on the idea that raising awareness of the problem can increase or motivate participation in environmentally friendly actions (Barr et al 2011; Collins 2004; Blake 1999). However, this approach is only effective if behaviour is based on internal factors, such as ignorance. If the barriers are external, for example large economical and temporal costs, information spreading has a limited effect (Sjödén 1999). Another reason against the information spreading theory is that it may nurture a feeling of helplessness regarding the issue. Helplessness might lead people to feel out of control of their own life, which may result in decreased motivation to act environmentally friendly (Jackson 2005; Pelletier et al 1999).
2.3 To be moved to do something
In our everyday language the meaning of motivation is unclear (Hein 2012). Does motivation towards an action mean that people are willing to do it? Or are they focused on a certain goal? Motivation could also mean that a person has an incentive to perform a certain action. Individuals may have a personal understanding of the word's meaning and there are many situations where the expression motivation can be applied. Hein (2012) points out that for an everyday use of the word motivation there is no need of a precise definition, although when
using the word as a theoretical concept it is important to be more precise. Research on motivation outline and analyse what factors affect and direct an individual’s actions (Atkinson 1964). However, definitions vary among different theories (Wagner 2003). Ryan and Deci (2000, p. 54) suggests that to be motivated “means to be moved to do something”. In their Self-determination theory (SDT) they propose that people not only have various amounts of motivation but also different types of motivation (Ryan & Deci 2000).
2.3.1 On the scale of self-determination
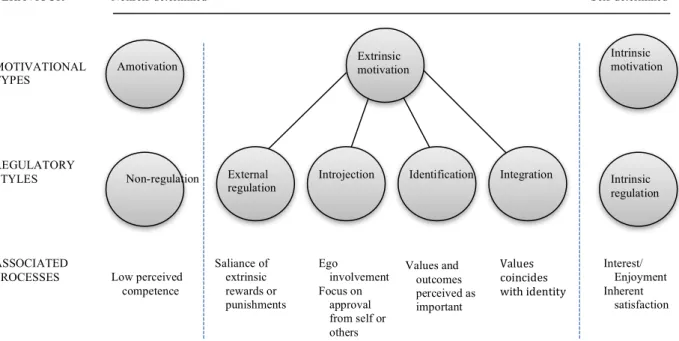
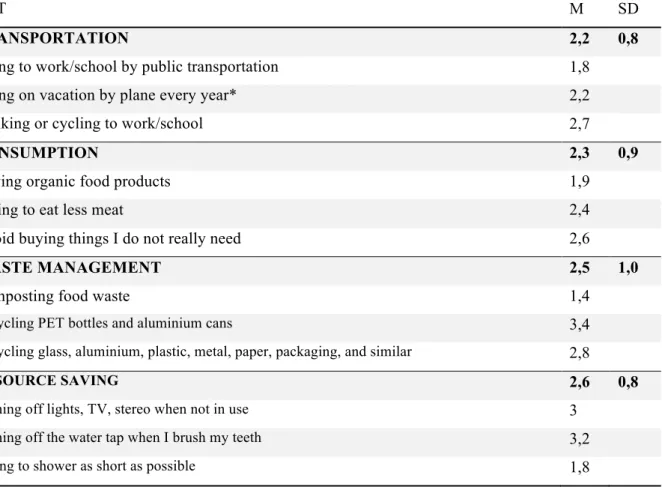
Self-determination theory (SDT) is a theory of human motivation with type of motivation as the focal predictor of performance, relational and wellbeing outcomes (Deci & Ryan 2008). According to SDT, behaviours are regulated in five different ways, which vary on a scale of self-determination (see figure 1). Extrinsic motivation steams from external influences and regulations, which can be more or less internalized into an individual’s sense of self (Deci & Ryan 2000). Internalization is “the process through which an individual acquires attitudes, beliefs or behavioural regulation and progressively transforms it into a personal value, goal or organization” (Deci & Ryan 1985, p. 130). Within this process, it may be necessary to change personal perspectives and values, for example, by taking the external demands of society and adopting them as their own (ibid). Through internalization, extrinsic motivation and values may become a part of the self. When behaviour is motivated by regulations that have not been internalized and the behaviour is not self-determined.
The different regulatory types are divided in to controlled and autonomous motivation. Autonomous motivation includes intrinsic, integrated and identified regulation. Controlled motivation comprises external and introjected regulation (Deci & Ryan 2008). Behaviours that are non-regulated emerge from amotivation. A person experiences amotivation when there is no impetus toward behaviour. Amotivated individuals cannot grasp the outcome of their behaviour, and therefore not the underlying motives to it (Pelletier et al 1999), they are not able to regulate themselves to behaviour and this regulation is the least self-determined (Deci & Ryan 2000).
Next on the scale is external regulation and introjected regulation. External and introjected regulations represent the two basic and controlled forms of extrinsic motivation and are associated with a sense of being pressured to act in a particular way (Deci & Ryan 2000: 2008). The reason for externally regulated behaviours is the attendance of specific consequences, for example rewards or punishments from others. When consequences for behaviour are no longer administered by others, but by the individual themselves the regulation is introjected. An individual behaves in a certain way to feel proud or avoid feelings of guilt and shame, but also to attain approval from others. Extrinsic motivation has been somewhat internalized by the individual, but has not been constituted into the self. Introjected regulation is more likely to be maintained than external, but is a less stable type of regulation (Deci & Ryan 2000).
Autonomous motivations arise from within the person (Deci & Ryan 2008). A sense of choice
or self-endorsement is characteristic for autonomously motivated individuals. This results in greater psychological health and more effective performances in activities. Self-endorsement also increases the chances of maintained behaviour (ibid). The first somewhat autonomous form of regulation is identified regulation. When identified regulated, an individual will engage in behaviour because the outcome is perceived as important (Deci & Ryan 1985,
ASSOCIATED
PROCESSES Low perceived competence Saliance of extrinsic rewards or punishments Ego involvement Focus on approval from self or others Values and outcomes perceived as important Values coincides with identity Interest/ Enjoyment Inherent satisfaction Intrinsic motivation Extrinsic motivation External regulation Amotivation
BEHAVIOUR Nonself-determined Self-determined
REGULATORY STYLES Integration Identification Introjection
Figure 1. The figure shows how type of motivation and regulation varies on a scale of
self-determination. The associated processes show reasons for each regulatory style. Modified figure inspired by Deci & Ryan 2000; Ryan & Deci 2000.
Non-regulation MOTIVATIONAL TYPES Intrinsic regulation
2000). In the process of identification an individual has, to a higher extent, internalized the regulation into oneself and accepted the values of behaviour. Integrated regulation results in behaviours that have been internalized into an individual's sense of self (Deci & Ryan 1985). A person behaves because the behaviour is coinciding with values the individual has accepted as their own. When regulation is integrated, a person will not only perceive the regulation as important, but also make it coherent with ones own identity (Deci & Ryan 2000). Totally
self-determined behaviours arise from intrinsic regulation. When individuals are intrinsically
motivated they experience interest or enjoyment. Individuals engage in intrinsically motivated behaviours by their own choice out of interest and not out of avoidance of punishment (Deci & Ryan 2000).
2.3.2 Psychological needs for autonomy, competence and relatedness
In SDT, needs are defined as “ innate psychological nutriments that are essential for on-going psychological growth, integrity, and well-being” (Deci & Ryan 2000, p. 229). SDT argues that behavioural motivation requires consideration of three basic psychological needs for
autonomy, competence and relatedness. Autonomy is referred to as volition and self-regulation
and is the urge to self-organize experiences and behaviours (Deci & Ryan 2000). This also includes avoidance of external control. Competence refers to individuals’ need of engaging in optimal challenges, having an effect on, and achieving valuable results within the physical and social world (ibid). Individuals automatically seek interesting situations that are challenging which require an individual to test their abilities and try something new that suits the individual’s competencies. When a challenge is encountered, individuals will persistently work in order to master it (Deci & Ryan 1985). The desire to feel attached and experience security, intimacy and belongingness to others is referred to as relatedness (Deci & Ryan 2000).
In pursuing and successfully satisfying these needs, individuals experience positive psychological outcomes. Motivators that undermine autonomy, competence, or relatedness reduce motivation, performance and well-being (Deci & Ryan 1985, 2000). The meaning of autonomy, competence and relatedness may vary for different individuals and cultures. Nevertheless, satisfying needs is “essential for the wellbeing and development of all individuals regardless of culture” (Deci and Ryan 2000, p. 231). Hence, this theory is applicable worldwide.
2.3.3 To measure motivation toward the environment
SDT has been used by a number of researchers on pro-environmental behaviour (see Pelletier & Sharp 2008; Darner 2012; De Groot & Steg 2010; Cooke & Fielding 2010). Darner (2012) argues that behaviours that are self-determined are more likely to be consistent and long lasting.
The most relevant type of motivational regulation regarding environmental motivation is integrated regulation. This is because this type of motivation determines behaviours that arise from the self but are not necessarily pleasurable in their own right, such as many pro-environmental behaviours (Darner 2012, p. 471).
An individual who performs pro-environmental behaviours as a result of integrated or
intrinsic regulation (the most self-determined types of regulations), experience environmental self-determination because the behaviour arises from within the self. Pro-environmental
behaviours may not be inherently interesting or enjoyable. Nonetheless, because of the consequences of the behaviours (ex. lower carbon footprint or contribution to a sustainable future), a person with autonomous motivation toward the environment might find the behaviour satisfying anyway (Cooke & Fielding 2010). The outcomes of pro-environmental behaviours might be an important and valued goal for this person, and may also be a part of her identity and thus her lifestyle. Amotivation is the least self-determined type of motivation and is described as a state where an individual lacks the intention to behave (Deci & Ryan 2000). This is likely to occur when individuals do not perceive a sense of control (autonomy) or efficacy (competence). Amotivated individuals are not capable of seeing how their contribution could solve the problem, and therefore they do not engage in pro-environmental activities (Pelletier et al 1999).
A paper published in 1998 by Pelletier et al presents a measuring tool on individual’s motivation to environmental behaviours called Motivation Toward the Environment Scale (MTES) (Pelletier et al 1998). MTES consists of several statements, which measure people’s levels of motivation to environmental behaviours and correspond to the regulatory types of
amotivation, external, introjected, identified, integrated and intrinsic regulation presented in
the Self-determination Theory (see figure 1). The final version of the MTES was preceded by four studies that evaluated and developed the scale. The first study consisted of 60 questions on motivation of environmental behaviours. In the following two studies the number of questions was narrowed down and the final questionnaire consisted of 24 questions of “very acceptable levels of reliability and validity” (Pelletier et al 1998, p. 459). When answering the
questionnaire respondents state to what extent each statement corresponds with their personal motives for engaging in a pro-environmental behaviour, choosing on a 7-point likert scale ranging from Do not correspond at all to Correspond exactly. The respondent’s score reflects what type of regulation the individual has toward environmental behaviours.
2.4 Conjecture and reflection
In the process of urging emerging adults towards an increased environmentally friendly lifestyle, it is important to understand the life attributes of this age group, what motivates them to pro-environmental behaviour and what they perceive as barriers for acting in favour of the environment. SDT is significant from a pro-environmental behavioural perspective because this theory emphasises the type of motivation, not amount. Today the government uses different instruments, such as economic incentives, regulations and information spreading, to reduce and control environmentally destructive activities (Pihl 2007). These instruments can be connected to the self-determination theory. By using MTES it is possible to evaluate what motivates emerging adults to make decisions based on environmental impacts. This knowledge is valuable when trying to urge this age group towards behavioural change. SDT furthermore provides interesting aspects on psychological needs, and suggests that behaviour is more likely to be maintained when the motivation arises from self-determination and the needs for autonomy, competence and relatedness are satisfied. We believe SDT and the MTES provides an operational tool to examine the types of motivation towards environmentally friendly behaviour amongst emerging adults.
3 A questionnaire study
The purpose of this study is to identify environmental habits and motivation for pro-environmental behaviour among emerging adults in Sweden. To fulfil this purpose we will
We apply the Self Determination Theory by Deci & Ryan to examine the type of motivation rather than the amount of motivation. The research is based on a questionnaire study and type of regulation is measured through the Motivation Toward the Environmental Scale (MTES). A quantitative method enables the capturing of perceptions and thoughts in a large population (Kylén 2004). The survey was constructed electronically and distributed on the Internet.
3.1 Construction of the questionnaire
We developed the questionnaire by using the Internet based survey program SurveyPlant. An Internet based questionnaire increases the potential of using social media as a distribution tool, which was considered a great advantage compared to a regular paper survey. The construction of the questionnaire was inspired by four phases, presented by Kylén (2004).The first phase was to make a draft. Several questions were constructed and various designs tested. This basic version was the starting point of the questionnaire.
Before we continued the development of the questionnaire, we asked our supervisor group and supervisor to answer the questions and give feedback on their opinion about the questionnaire. Based on their opinions we further developed the questions. The construction of the questionnaire became a work in progress over the course of a fortnight. Background questions, introduction messages, length of the survey, and question type and such were evaluated carefully in consultation with the supervisor.
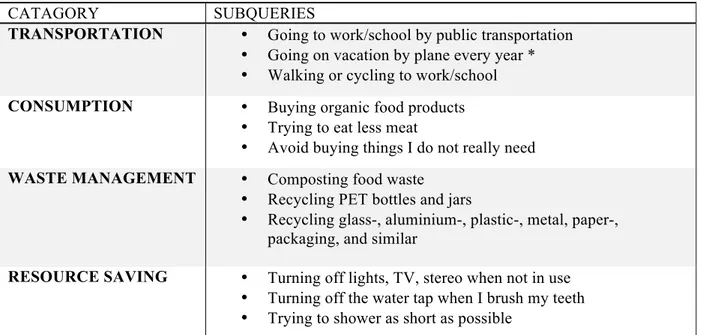
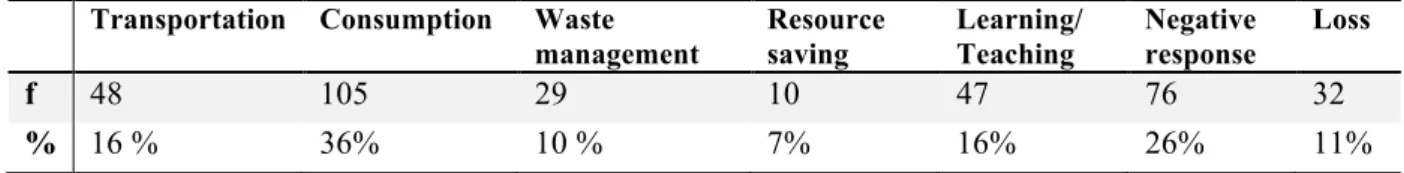
In the survey, two Likert-scales were used, MTES and a scale constructed by us. Our own scale was inspired by the work of Osbaldiston and Sheldon (2003), Miao and Wei (2013) and Green-Demers et al (1997), and some of the questions are retrieved from their studies. However, we modified some of them and added our own formulations to adapt the scale to our target group. In the scale 12 environmentally friendly acts were divided into the four categories including Resource saving, Transportation, Waste management and Consumption (see table 1). These categories represent actions where individuals have the potential to control their own environmental impact. Moreover, we think these actions are feasible for our
target population to engage in. The respondents were asked about the extent to which they engaged in each act on a 5-point likert scale ranging from never to always. If a respondent scored high on the acts reflecting a certain category, this indicated a high level of commitment.
Table 1. The table summarizes the main categories of environmentally friendly acts.
CATAGORY SUBQUERIES
TRANSPORTATION • Going to work/school by public transportation
• Going on vacation by plane every year * • Walking or cycling to work/school
CONSUMPTION • Buying organic food products • Trying to eat less meat
• Avoid buying things I do not really need
WASTE MANAGEMENT • Composting food waste • Recycling PET bottles and jars
• Recycling glass-, aluminium-, plastic-, metal, paper-, packaging, and similar
RESOURCE SAVING • Turning off lights, TV, stereo when not in use
• Turning off the water tap when I brush my teeth • Trying to shower as short as possible
*Reverse scoring in the analysis
Some replies are hard to predict and therefore it is difficult to provide the respondent with sufficient options when constructing a questionnaire. Therefore we decided to create two open questions. These questions gave the respondents the possibility of answering in their own words.
Before distribution, the final version was sent to fellow students, friends, family, supervisor and lecturers for review. A recurring comment from the reviewers was that some of the alternatives in the MTES were very similar. Taking this into account, we decided to exclude some alternatives resulting in each type of regulation consisting of three subqueries. This was met with positive feedback and the scale now was easier to answer. Typos were corrected and modifications made.
The introduction message in the survey presented the overall purpose of the study. We stated our own names and informed the respondents that their answers would be analysed and processed anonymously. We explained the confidentiality of the study, detailing how we
could not link an answer back to the participant. This was a way to inspire confidence and make the respondents answer honestly to our questions.
The final version was distributed April 18th. The completed survey is attached as appendix 1.
3.2 Our target audience
According to statistics Sweden (SCB) the total number of men and women in the age of 18-29 in Sweden on the 31st of December 2012 was 1 524 578 (SCB 2013). With regard to the temporal and economical aspects of the thesis, a random selection of the population was not feasible.
We presumed that many people in the target population had a profile on Facebook and therefore this media was considered an effective way to circulate the questionnaire to a large number of people very quickly. We created an event on Facebook where the link to our survey was available and urged all guests to invite as many friends as possible, which led to a wider circulation of the link. It is possible that people sharing our viewpoints on the environment were more likely to reply to the survey, since many of our contacts on Facebook probably share interests, education and so on, this might have affected the outcome of the study. However, Facebook also enabled people to share the link on their personal page, which made it possible for other people to spot the survey even though they had no connection to us. The selection of respondents in this study can therefore be seen a combination of what Esaiasson et al (2012) refer to as self-selection and a snowball-selection. These types of selections are non-random selections. By self-selection the respondents themselves can decide whether or not to participate in the survey, and snowball-selection refers to the fact that the respondents are encouraged to redirect the questionnaire to persons relevant for the delimitations (ibid).
3.3 Method of analysis
We performed our statistical analysis by using the programs SurveyPlant and Statistical Package for the Social Science (SPSS) and the two open questions were analysed similar to content analysis (see Esaiasson et al 2012).
3.3.1 Statistical analysis
Descriptive statistics of the responses were enabled in SurveyPlant, while other measurements such as correlations (Pearsons r) between the type of regulation and environmental acts as well as the internal consistency, were calculated in SPSS. When calculating the total index to each and one of the categories in MTES and our own environmental behaviour scale, all of the claims were collapsed into new variables. By adding the subqueries to reflect a certain regulation or environmental act into a new variable it was possible for us to attain a mean value for the category. In order to eliminate possible errors we followed the work by Pelletier et al (1998), the founders of the MTES. For example, the three subqueries reflecting intrinsic regulation was added and then divided into three (Claim1+Claim2+Claim3)/3. This new variable was labelled Intrinsic. The same process was repeated for each regulatory style. The scale consisting of 12 activities measuring the extent of pro-environmentally behaviour (see table 1) was computed in the same way. For example, the three acts reflecting the resource saving category, were computed into a new variable labelled Resource saving. The same process was repeated for each environmental category.
We also calculated the standard deviation (SD) for the two scales. SD shows the average dispersion from the mean value (Lantz 2006). An empirical rule suggests that 2/3 of the answers will be within the mean M ± 1 SD, and 19/20 of the answers will be within the mean average ± 2 SD (ibid). Our results varied on a relatively small scale therefore no extreme values are present.
3.3.2 Theme analysis
We constructed a colour coding for each of the questions based on an initial review of the answers. Both of us took part of the categorization process, and if there were any disagreements over an answer, we had a discussion and tried as objectively as possible to sort the answer into an appropriate category. If a respondent´s answer consisted of multiple categories, such as economical and facilitating incentives, each category was processed separately from the other.
After a review on the answers to question 13 Is there something you do for the environment
that is interesting, exciting or fun? Briefly describe what and why, we decided that in addition
another two categories. The six classifications decided upon were Resource saving,
Transportation, Waste management, Consumption, Learning/Teaching and Negative responses.
The classification Resource saving comprised all replies mentioning energy reduction or water use. Transportation included walking, using public transportation, biking or driving ones car as environmentally friendly as possible (eco-driving). Waste management included activities like recycling, picking up waste in public or wilderness areas, or composting food waste. Within the category Consumption we included activities such as buying organic food, being a vegetarian or purchasing second hand clothes. We also included non-consumption and reusing or remaking of products. Learning/Teaching embraced all answers referring to the circulation of information or encouragement to others to adopt a pro-environmental behaviour. Within this category answers concerning learning about nature or collecting information about environmentally friendly behaviour were also included. We placed all replies reporting no or similar within the category Negative responses. Responses that were incomprehensive were classified as Loss.
The categories dividing the answers of question 19 Describe in three sentences what you think
would make you become more environmentally friendly, were defined as Economy, Information/Feedback, Accessibility/Simplicity, Others commitment, Own commitment and Societal changes.
If an answer indicated that factors such as higher income, cheaper organic products or lower or no costs for public transportation were incentives to act in a more environmentally friendly way it was categorized as Economy. Information/Feedback included replies like better information on what impacts one’s actions have on the environment, broader knowledge on climate change, reminders in the media for acting in a more environmentally friendly and so on. Accessibility/Simplicity covered for example proximity to recycling facilities, better connections in public transport and better access to organic products. Some respondents indicated that if other people had an increased commitment, friends, family or celebrities, it would be an incentive for them to act differently as well. These answers were categorized as
Others commitment. If answers contained a higher own commitment or implementation of
different habits they were classified as Own commitment. Some respondents mentioned that he or she needed a fundamental societal change or a changed collective worldview in order to
increase ones own behaviour. These replies were placed in the group Societal changes. This group also included policy changes and the introduction of new/stricter laws or requirements. Incomprehensive, or “Do not know” answers were classified as Loss.
3.4 The complications of distributing a survey
The findings of this study cannot be generalized since the respondents are not randomly selected and therefore not representative of the overall population. However, this was not the aim of this thesis, but rather to provide an indication of emerging adults’ motivation.
One of the complications of distributing a survey online is that respondents can, to a greater extent, report false answers than if they are confronted in real life. Respondents could also respond to the survey numerous times or misunderstand the questions when there is no opportunity to seek clarification. Furthermore, the limitation of the survey includes registered Swedes, which was mentioned in the questionnaires introduction message. Nonetheless, two respondents answered the open questions in Danish and English, and it is possible that these respondents are registered in Sweden even though they choose not to respond in Swedish. This uncertainty could have been avoided by asking the respondents if they were registered in Sweden or not and simply remove those who answered no.
Since the analysis of our results is partially based on statistical measures, we find it relevant to discuss reliability and validity. The MTES has documented levels of reliability and validity (Pelletier et al 1998). However, as noted the MTES in the present study has been narrowed down from 24 to 18 statements, and was also translated into Swedish in order to reduce possible errors and misunderstandings. We were initially uncertain how this could come to affect the reliability and validity of the MTES. Cronbachs-Alpha measures the internal consistency of a scale and is important to reflect upon in a study (Tavakol & Dennick 2011). The value ranges between 0-1 where levels between 0,7-0,95 are considered as acceptable (ibid). When the data was exported to SPSS and the reliability measured we found that Cronbachs-Alpha (α) for the statements reflecting any type of regulation ranged between α= 0,74 to α= 0,91.
We discovered that Cronbachs-Alpha of the scale we constructed did not exceed 0,7, despite efforts to exclude some alternatives in order to increase the Alpha-value. To reach higher
levels of internal consistency it would have been necessary to formulate a “battery” of questions in multiple surveys and evaluate the results from these and the formulations of questions carefully. Taking the temporal aspects into account, that would not have been feasible. This issue has been discussed with the supervisor and we decided to use the scale nevertheless, but this should be considered in order to approach measurements comprising this scale in an appropriate way.
Furthermore, we believe it is necessary to discuss loss of analysis units, even though Esaiasson et al (2012) suggests this is more relevant if the population is randomly selected. Since we used a snowball-selection, the survey was spread beyond our control. Theoretically, many more than our response group saw the link to the survey but chose not to answer for unknown reasons. In the introduction message the respondents were informed that their answers would be processed anonymously. When the questionnaire was distributed, the respondents were encouraged to participate in a scientific study. These two methods are ways to reduce the loss of analysis units (Esaiasson et al 2012). Despite these attempts, some 29 % of the respondents replied they were men, and 69 % females (N= 294). The result shows that we have a lot less men, assuming that the actual population are more or less equally distributed in 50 % females and 50 % males. Since this study does not aim to compare women and men, no further difference has been made between genders in the analysis. Nonetheless, we find it interesting that more women seemed interested in responding to the survey. The result of this is that we are aware that this study does not represent an equivalent balance in gender.
The data collection ended on the 1st of May 2013, at that time, 298 persons had submitted the questionnaire. One survey was incomplete, even though this should not be possible because of the mandatory question setting in SurveyPlant. Three surveys had an exact copy of themselves. We presumed an error had occurred when these questionnaires were submitted, hence they were removed from the study.
4 A generation of green behaviour?
What is life like for an individual in her twenties? What motivates her to act in favour of the environment? In the following chapter we analyse 294 questionnaires and reconnect the findings to the theoretical framework described in chapter 2.
4.1 The lifestyle of emerging adults
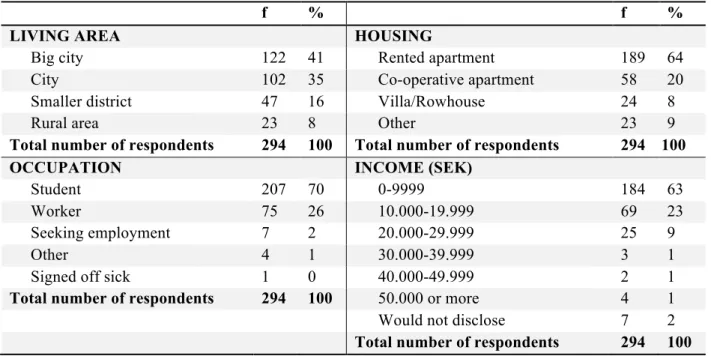
The respondents were asked to report their age and could choose from a list ranging from 18 to 29 years old. Most respondents, 56 individuals (19 %), were aged 23, the respondents' mean age was 24 and the median age was 23 (N= 294). The answers observing age have been complied in table 2.
Regarding gender the participants could choose from three checkboxes, woman,
man or would not disclose. 204 respondents
(69 %) were women and 86 (29 %) men. 4 individuals (1 %) choose not to disclose their gender.
The respondents were asked to state their housing situation and whether they lived in a Rural Area, Smaller District, City or Big
City. We defined in the question that a City
had 50.000-200.000 citizens and more than 200.000 people were considered a Big City. Most respondents lived in a Big City (41 %) or in City (35 %) (N= 294). Answers are presented in table 3. 189 (64 %) stated that they lived in a Rented apartment, 58 (20 %) lived in a Co-operative apartment, 24 individuals (8 %) lived in a Villa/ Row house, and 23 (8 %) ticked the checkbox Other (N= 294).
We wanted to know whether our respondents had started their own family yet, and asked them to state their marital status and parenthood. Only 8 people (3 %) were married, 55 (19 %) had a relationship, 101 (34 %) lived together with their partner and 130 (44 %) reported
Table 2. The table presents the age of the respondents. The results are presented in frequency (f) and percentage (%) rounded to the nearest integer. N= 294. AGE f % 18 9 3 19 8 3 20 18 6 21 25 9 22 34 12 23 56 19 24 43 15 25 29 10 26 26 9 27 13 4 28 16 5 29 17 6 Median 23 Means 24
Total number of respondents 294 101
their marital status as single (N= 294). On the question Do you have children? 15 (5 %) answered yes, remaining 279 respondents (95 %) answered no (N= 294).
Concerning occupation, most of the respondents, 207 people (70 %), were Students. 75 (26 %) reported that they Worked, 7 (2 %) were Seeking employment, 1 person (0 %) was Signed
off sick and 4 people (1 %) stated Other (N= 294). The respondents were asked to indicate
their net pay per month, and could choose between 0-9999, 10.000-19.999, 20.000-29.999,
30.000-39.999, 40.000-49.999 or 50.000 or more. The highest percentage (63 %, f= 184)
valued their income to 0-9999 SEK per month, 69 people (23 %) choose 10-19.999. The remaining 14 % selected any of the options between 20.000-29.999 and 50.00 or more (N= 294).
Table 3. The table present respondents’ Living area, Housing, Occupation and Income (SEK) per month. The results are presented in frequency (f) and percentage (%) rounded to the nearest integer. N= 294.
f % f %
LIVING AREA HOUSING
Big city 122 41 Rented apartment 189 64
City 102 35 Co-operative apartment 58 20
Smaller district 47 16 Villa/Rowhouse 24 8
Rural area 23 8 Other 23 9
Total number of respondents 294 100 Total number of respondents 294 100
OCCUPATION INCOME (SEK)
Student 207 70 0-9999 184 63
Worker 75 26 10.000-19.999 69 23
Seeking employment 7 2 20.000-29.999 25 9
Other 4 1 30.000-39.999 3 1
Signed off sick 1 0 40.000-49.999 2 1
Total number of respondents 294 100 50.000 or more 4 1
Would not disclose 7 2
Total number of respondents 294 100
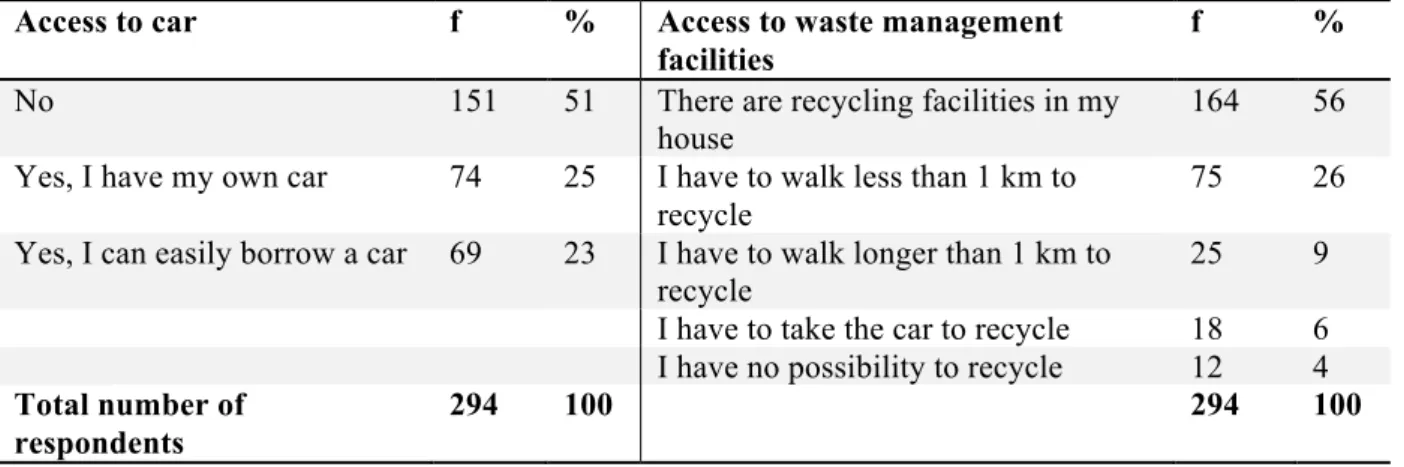
Table 4 shows that the majority, 51 % of the respondents did not have access to a car and 25 % reported that they owned a car. 69 (23 %) could easily borrow a car. Moreover, table 4 shows that 164 (56 %) had the possibility to recycle where they live, and 75 (26 %) had to walk less than 1 kilometre to recycle. Only 12 (4 %) reported that they had no opportunity to recycle.
Table 4. The table present respondents’ answer to the questions Do you have access to a car? and
What possibilities do you have to recycle waste? The results are presented in frequency (f) and
percentage (%) rounded to the nearest integer. N= 294.
We expected many of our respondents to have a limited income due to their low age. Many organic products are more expensive than conventional ones, therefore we formulated a question aimed to examine whether this affected emerging adults abilities to buy organic products. The question was formulated: Organic products can sometimes cost more than
conventional products. Does this affect your ability to buy organic products?. The answers
are listed in table 5. The respondents could choose from a list of six statements. Most, 138 people (47 %), indicated I buy organic products when I can afford to. 84 (29 %) answered
For environmental reasons, it is worth paying a little extra for organic products, and 23 (8 %)
felt that the statement I cannot pay extra for organic products agreed with their view. 24 of the respondents (8 %) always bought the cheapest option I buy the cheapest option, whether it
is organic or not, 13 (4 %) selected Organic products are too expensive and 12 (4 %) choose
the option I do not care (N= 294).
Table 5. The table present the respondents’ answer to the question Organic products can sometimes
cost more than conventional products. Does this affect your ability to buy organic products? The
results are presented in frequency (f) and percentage (%) rounded to the nearest integer. N= 294.
f %
I cannot pay extra for organic products 23 8
I buy organic products when I can afford to 138 47
For environmental reasons, it is worth paying a little extra for organic products 84 29
I do not care 12 4
Organic products are too expensive 13 4
I buy the cheapest option, whether it is organic or not 24 8
Total number of respondents 294 100 Access to car f % Access to waste management
facilities
f %
No 151 51 There are recycling facilities in my
house
164 56
Yes, I have my own car 74 25 I have to walk less than 1 km to recycle
75 26
Yes, I can easily borrow a car 69 23 I have to walk longer than 1 km to recycle
25 9
I have to take the car to recycle 18 6
I have no possibility to recycle 12 4
Total number of respondents
This background information provides us with a picture of emerging adults in Sweden today. Most respondents live in Big cities or Cities and are mostly renting apartments. The majority of the respondents were still students with a low income, they were unmarried and had no children. Because of the lack of attributes associated with adulthood, like a settled family, children and employment, we can deduce that we have successfully reached our target population of emerging adults.
4.2 Pawning cans to pay for the next flight abroad?
We constructed an index consisting of 12 questions to measure to what extent our respondents had environmentally friendly lifestyles. The questions were computed into four new categories labelled Transportation, Consumption, Waste management and Resource saving. The question was formulated: Which of the following do you do and to what extent? The respondents could agree on a scale ranging from Never (valued 0) to Always (valued 4). The mean values (M) and standard deviation (SD) of each category, calculated in SPSS, are presented in table 6.
The mean value for the main categories were fairly equally distributed (see table 6). Our respondents reported the highest mean value for Resource saving (M= 2,6 ± 0,8). Next came
Waste management (M= 2,5 ± 1,0) and Consumption (M= 2,3 ± 0,9). The category Transportation had the lowest mean value (M= 2,2 ± 0,8). The four categories have a
relatively equal dispersion of answers (N= 294).
There are only four acts where the mean value is less than 2: Buying organic food products (M= 1,9), Composting food waste (M= 1,4), Trying to shower as quickly as possible (M= 1,8) and Going to work/school by public transportation (M= 1,8) (N= 294). We can infer from this that our respondents do not perform these actions very often. The mean values of these four acts might be explained by the respondents’ background. The majority of the respondents are students, with quite a limited monthly budget, living in larger cities. Their limited budget may explain why Buying organic food products scored low. Since most respondents also lived in larger cities, it is possible that many of them have no requirement for public transportation. This is also supported by the somewhat higher mean value of 2,7 of the statement Walking or
cycling to work/school, which indicates the opportunity to walk or cycle. Many respondents
is still in an implementation phase in Sweden, this might explain the low extent of
Composting food waste (M= 1,4).
Table 6. The table presents the mean value (M) for each act and category ranging on a scale from 0= Never to 4= Always. Standard deviation (SD) is presented for every main category. All results are rounded to the nearest decimal. N=294.
ACT M SD
TRANSPORTATION 2,2 0,8
Going to work/school by public transportation 1,8
Going on vacation by plane every year* 2,2
Walking or cycling to work/school 2,7
CONSUMPTION 2,3 0,9
Buying organic food products 1,9
Trying to eat less meat 2,4
Avoid buying things I do not really need 2,6
WASTE MANAGEMENT 2,5 1,0
Composting food waste 1,4
Recycling PET bottles and aluminium cans 3,4
Recycling glass, aluminium, plastic, metal, paper, packaging, and similar 2,8
RESOURCE SAVING 2,6 0,8
Turning off lights, TV, stereo when not in use 3
Turning off the water tap when I brush my teeth 3,2
Trying to shower as short as possible 1,8
*Reversed scoring in the analysis.
We found it important to reveal how much saving money influences emerging adults’ motivation to act in a more environmentally friendly manner, and we therefore created a question to investigate this further. The question was: Being environmentally friendly in our
daily lives could be a way to save money. For example, reusing products, saving electricity, cycling instead of using the car and so on. Is this something you do? For what reasons? The
Table 7. The table present respondents’ answer to the question Being environmentally friendly in our
daily lives could be a way to save money. For example, reusing products, save electricity, cycling instead of using the car and the like. Is this something you do? For what reasons? The results are
presented in frequency (f) and percentage (%) rounded to the nearest integer. N= 294.
f %
Yes, mainly for environmental reasons, not for economic reasons 30 10
Yes, mainly for economic reasons, not for environmental reasons 52 18
Yes, for both economic and environmental reasons 185 63
No 11 4
I have not thought about this 16 5
Total number of respondents 294 100
52 of the respondents (18 %) were environmentally friendly in their everyday life (reused products, saved electricity etcetera) for economical reasons alone, and 185 (63 %) did it because of both economical and environmental reasons (N= 294). This implies that a large number of respondents engage in such activities for economical reasons.
4.3 Because it´s fun and interesting?
One question in the survey was aimed to examine whether any pro-environmental behaviour was perceived as intrinsically motivating among emerging adults. Intrinsically motivated individuals engage environmental friendly activities out of interest and enjoyment (Deci & Ryan 2000). The question was formulated: Is there anything you do for the environment that
is interesting, exciting or fun? Briefly describe what and why. The respondents had the
opportunity to answer this question using their own words, which revealed answers we could not have foreseen.
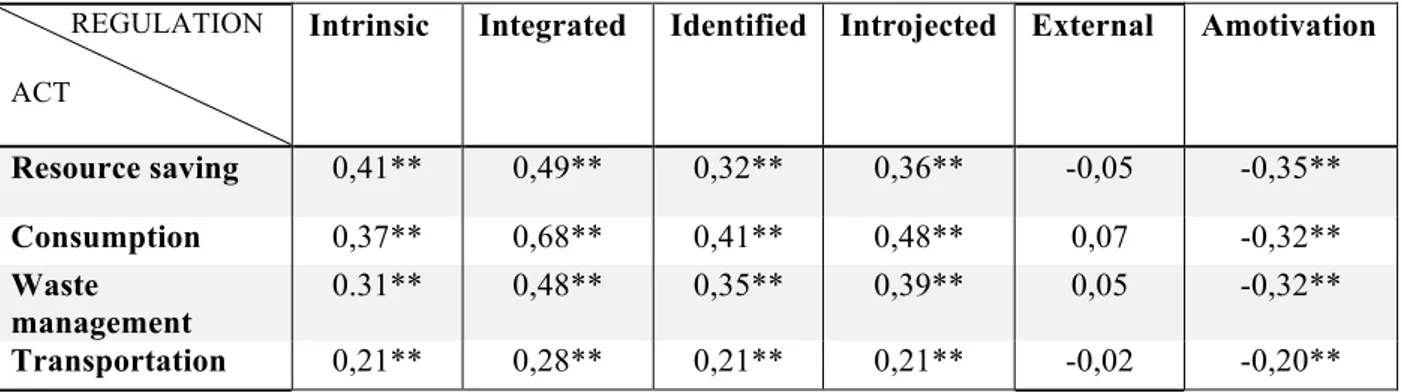
Actions classified as Resource saving was mentioned by 20 respondents (7 %) as something they did for the environment that they think is fun, interesting or exciting. 29 (10 %) declared
Waste management and 48 respondents (16 %) Transportation. One quite illustrative answer
in the category of Transportation is, “Public transport is easy, convenient and actually quite fun since there are so many fun people and surroundings to see”. We believe this respondent has found pleasure in the “small things”, which might just be enough to maintain their environmentally friendly behaviour.
Table 8. The table present the categories created from the open question Is there anything you do for
the environment that is interesting, exciting or fun? Briefly describe what and why. If a respondent´s
answer consisted of multiple categories, each category was processed separately from the other. The results are presented in frequency (f) and percentage (%) rounded to the nearest integer. N= 294
Transportation Consumption Waste management Resource saving Learning/ Teaching Negative response Loss f 48 105 29 10 47 76 32 % 16 % 36% 10 % 7% 16% 26% 11%
Another respondent has written, “I cycle, and I persistently cycle all the time. This is sometimes a challenge, but it is something I’m proud of, and actually boast about. Cycling is environmentally-friendly, healthy and trendy […] if I had not received so much positive feedback from others, I would probably not cycle as much as I do”. It seems as this respondent has found an optimal challenge which can be linked to the psychological need for competence, but also that his activity has been met by approval and positive feedback from others, which may be associated with the need for relatedness.
One respondent mentioning waste management in the answer wrote, “When I was young I thought it was absurd to put garbage in my pocket, therefore I threw it away directly, and if I happened to be outside and no trash cans were available the garbage ended up on the ground. Nowadays, I think it seems absurd to throw garbage on the ground. So, I’ve stopped throwing garbage on the ground.” This answer illustrates an internalization process. It is possible that when the person was younger he or she did not perceive the underlying motives for not putting garbage on the ground, and that they have started to value the motives to such behaviour as important.
Actions categorised under Consumption were mentioned by most respondents, 105 persons (36 %). Many respondents mentioned second hand shopping, one wrote, “I buy second-hand clothes almost exclusively, the supply is so much more fun, than in other large and boring stores”. We also discovered that small scale home growing of vegetables is quite common, “I grow my own food […] because it´s fun and interesting. I like having control of my own life and understand and manage what´s important”. The answers presented here show that consumption is perceived as fun, interesting or exciting for a variety of reasons.
We also had to create one new category we labelled Learning/Teaching, which was stated in 47 (16 %) answers. This category is comprised of respondents who actively try to read and
learn about environmental issues, and also tries to encourage pro-environmental actions in their social sphere. 76 of the respondents (26 %) did not perceive any environmentally friendly act as fun, interesting or exciting, “no, it´s neither exciting nor fun or particularly interesting”. These 76 respondents should, according to SDT, not to be intrinsically motivated, since they did not engages in activities out of interest and enjoyment (Deci & Ryan 2000).
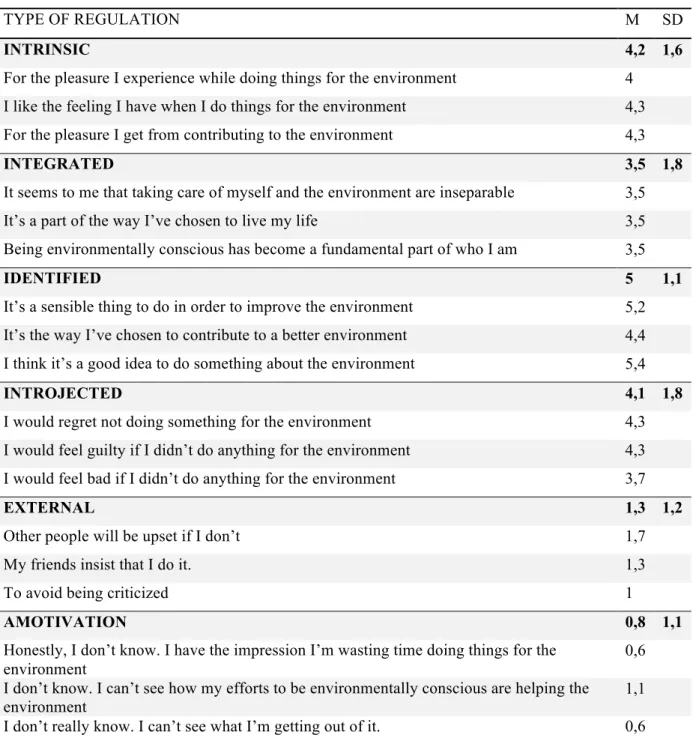
4.4 Identified on the scale of self-determination
To measure the type of regulation towards environmentally friendly behaviour among our respondents we used the Motivation Toward the Environment Scale (MTES). The scale contains 18 questions measuring degrees of amotivation, external, introjected, identified,
integrated and intrinsic regulation. Each regulatory type was rated by three questions and
thereafter a total index for each type was computed and is presented as a mean value (see table 9).
The respondents were asked to indicate the extent to which each item corresponded with their motive for doing things for the environment and could choose from a 7-point likert scale ranging from Does not correspond at all (valued 0) to Correspond exactly (valued 6). Our results indicate that the type of regulation toward the environment among emerging adult are primarily Identified (M= 5,0 ± 1,1), thereafter Intrinsic (M= 4,2 ± 1,6), Introjected (M= 4,1 ± 1,8) and Integrated (M= 3,5 ± 1,8). The categories with the lowest mean value was External (M= 1,3 ± 1,2) and Amotivation (M= 0,8 ± 1,1) (N= 294).
The standard deviation (SD) shows a difference between the regulatory types. There is a higher dispersion of the claims representing intrinsic (SD = 1,6), intergrated (SD = 1,8) and introjected (SD = 1,8) regulation. The standard deviation and hence the dispersion of answers is overall lower for the claims measuring identified (SD = 1,1), external regulation (SD = 1,2) and amotivation (SD = 1,1).
Table 9. The table states the mean value (M) for each question and type of regulation ranging on a scale from 0 = Does not correspond at all to 6= Correspond exactly. Standard deviation (SD) is presented for every type of regulation. All results are rounded to the nearest decimal. N=294.
TYPE OF REGULATION M SD
INTRINSIC 4,2 1,6
For the pleasure I experience while doing things for the environment 4
I like the feeling I have when I do things for the environment 4,3
For the pleasure I get from contributing to the environment 4,3
INTEGRATED 3,5 1,8
It seems to me that taking care of myself and the environment are inseparable 3,5
It’s a part of the way I’ve chosen to live my life 3,5
Being environmentally conscious has become a fundamental part of who I am 3,5
IDENTIFIED 5 1,1
It’s a sensible thing to do in order to improve the environment 5,2
It’s the way I’ve chosen to contribute to a better environment 4,4
I think it’s a good idea to do something about the environment 5,4
INTROJECTED 4,1 1,8
I would regret not doing something for the environment 4,3
I would feel guilty if I didn’t do anything for the environment 4,3
I would feel bad if I didn’t do anything for the environment 3,7
EXTERNAL 1,3 1,2
Other people will be upset if I don’t 1,7
My friends insist that I do it. 1,3
To avoid being criticized 1
AMOTIVATION 0,8 1,1
Honestly, I don’t know. I have the impression I’m wasting time doing things for the
environment 0,6
I don’t know. I can’t see how my efforts to be environmentally conscious are helping the
environment 1,1
I don’t really know. I can’t see what I’m getting out of it. 0,6
Regarding amotivation, the standard deviation exceeds the mean and the standard deviation is close to the mean regarding external regulation. This corresponds to the fact that these scales are not normally distributed but have a positive skew. When the frequency distribution of values departs from normality, the skewness describes how one tail of the distribution is more drawn out than the other (Barnard et al 2011). Out of the 294 persons who responded to the questionnaire some 144 (49 %) scored 0 on all three subqueries reflecting amotivation
(0+0+0)/3, and 28 respondents (10 %) scored 0,3 (0+0+0)/3, which is the median for amotivation. 26 respondents (9 %) scored 0,67 and 26 respondents (9 %) scored 1,0 on all three subqueries (1+1+1)/3. Thereafter, the frequency distribution falls, in total 60 respondents (20 %) had a score ranging from 1,33 through 3. 3 respondents (1 %) scored 3,33 (3+3+4)/3 and 2 respondents (0,6 %) scored 3,67 (3+4+4)/3. The highest five scores, ranging from 4 to 6, were achieved by 5 respondents (2 %). In other words, only 1 respondent (0,3 %) scored 6 on all three subqueries (6+6+6)/3. When the answers are distributed in a way similar to this, the distribution is skewed to the right (Barnard et al 2011). This means that the response frequency is relatively lower to the right on the scale, and gradually increases to the left. A similar distribution applies to external regulation. The skewed distribution explains why the standard deviation is higher than the mean regarding amotivation, and close to the mean regarding external regulation.
By the low mean value of amotivation we can infer that the respondents do have some kind of motivation toward engagement in pro-environmentally friendly activities. Amotivation emerges when there is no impetus toward behaviour (Pelletier et al 1999). The results concerning the environmental actions described in section 4.2 imply that the respondents tend to engage in these activities in a higher extent than not, wherefore amotivation is not significantly present (M= 0,8). External regulation does not affect the respondents’ motivation to engage in pro-environmentally friendly behaviours to any higher extent (M= 1,3). More interesting is the rather high mean value for introjected regulation (M= 4,1). This suggests that the regulation for behaviour has been somewhat internalized. The risk of consequences or contingencies are still present, however, the individual now administrates them. The reason for behaviour can be approval or avoidance of shame. The mean value for introjected regulation (M= 4,1) implies that an internalization process of extrinsic motivation has been initiated.
The claims reflecting identified regulation received the highest mean (M= 5). This may indicate that the respondents have accepted the values of pro-environmentally behaviour as important, but have not entirely constituted them into the sense of self, which is also supported by the relatively low mean of integrated regulation where the values have been internalized into the self. The low mean for integrated regulation (M= 3,5) might support the argument that an internalization process has been initiated but has not yet reached the stage of integrated regulation, but rather borders introjected and identified regulation. Deci and Ryan