CONSTRUCTION EQUIPMENT FUEL
CONSUMPTION DURING IDLING
Characterization using multivariate data analysis at Volvo CE
MUJTABA HASSANI
School of Business, Society and Engineering Course: Master of science thesis work Course code: ERA 402
Credits: 30 credits
Program: Master of Science degree in industrial engineering and management with focus on
Supervisor: Maher Azaza Examiner: Jan Skvaril Customer: Volvo CE Date: 2020-06-13 Email:
ABSTRACT
Human activities have increased the concentration of CO2 into the atmosphere, thus it has
caused global warming. Construction equipment are semi-stationary machines and spend at least 30% of its life time during idling. The majority of the construction equipment is diesel powered and emits toxic emission into the environment. In this work, the idling will be investigated through adopting several statistical regressions models to quantify the fuel consumption of construction equipment during idling. The regression models which are studied in this work: Multivariate Linear Regression (ML-R), Support Vector Machine Regression (SVM-R), Gaussian Process regression (GP-R), Artificial Neural Network (ANN), Partial Least Square Regression (PLS-R) and Principal Components Regression (PC-R). Findings show that pre-processing has a significant impact on the goodness of the prediction of the explanatory data analysis in this field. Moreover, through mean centering and application of the max-min scaling feature, the accuracy of models increased remarkably. ANN and GP-R had the highest accuracy (99%), PLS-R was the third accurate model (98% accuracy), ML-R was the fourth-best model (97% accuracy), SVM-R was the fifth-best (73% accuracy) and the lowest accuracy was recorded for PC-R (83% accuracy). The second part of this project
estimated the CO2 emission based on the fuel used and by adopting the NONROAD2008
model.
Keywords: Idling condition, environmental effect, diesel fuel, machine learning, multivariate data analysis, partial least square regression, support vector machine regression, principal component analysis, principal component regression, correlation coefficient matrix, artificial neural network, exhaust emission reduction techniques, global warming, emission regulation,
PREFACE
“If the teacher is wise, he does not bide you to enter the house of his wisdom. But leads you to the threshold of your own mind”
K. Gibran
To my beautiful daughter Zara
This thesis work is performed for a degree of Master of Science at Mälardalen University in city of Västerås, Sweden. The project was undertaken on behalf of Volvo Construction Equipment product support and manufacturer of construction equipment, at city of Eskilstuna.
I wish to express my sincere gratitude and appreciation to my supervisor Mr. Maher Azaza, associate senior lecturer and my examiner Mr. Jan Skvaril, associate senior lecturer at Mälardalen University who lightened my way through the work with their precious guidance and knowledge.
I would like to appreciate Uptime Center at Volvo Construction Equipment Eskilstuna, especially my supervisor Mr. Robert Sundkvist, head of Uptime Center for his support and instructions. I will also thank Mr. Leif Waad, product specialist at Uptime Center for his kind support and cooperation.
Västerås, June 2020
CONTENT
1 INTRODUCTION ... 1
1.1 BACKGROUND ... 2
1.1.1 Global warming potential and environment ... 2
1.1.2 EPA and EU non-road emissions regulations ... 3
1.1.3 Construction equipment industry ... 6
1.1.4 Exhaust emissions from construction equipment ... 8
1.1.5 Literature review... 10
1.2 PURPOSE/AIM ... 11
1.3 RESEARCH QUESTIONS... 12
1.4 SCOPE OF STUDY AND LIMITATIONS... 12
2 LITERATURE STUDY... 13
2.1 IDLE-CONDITION OF THE EQUIPMENT ... 13
2.2 FACTORS THAT IMPACT THE FUEL CONSUMPTION AND EXHAUST EMISSION OF CE ... 14
2.2.1 Equipment and condition... 14
2.2.2 Equipment maintenance... 15
2.2.3 Equipment operations ... 15
2.2.4 Operation condition ... 16
2.3 EXHAUST EMISSIONS AND POLLUTION REDUCTION TECHNIQUES ... 16
2.3.1 Active combustion strategy ... 17
2.3.2 Passive combustion strategy ... 18
2.3.3 CO2 neutralization approaches ... 19
2.4 MACHINE LEARNING ... 20
2.4.1 Basics of machine learning ... 20
2.4.2 Quantitative vs qualitative method ... 21
2.4.3 Training projection model ... 25
3 METHOD ... 28
3.1 RAW DATA AND CHEMOMETRICS ... 28
3.1.1 Samples ... 28
3.1.2 Pre-processing of data ... 29
3.1.3 Training ... 29
3.1.4 Performance of the model ... 30
3.2 FLOWCHART OF THE MODEL ... 31
3.3 ARTIFICIAL NEURAL NETWORK... 33
3.4 QUANTIFICATION OF CO2 EMISSION ... 33
3.5 SOFTWARE... 35
4 CURRENT STUDY ... 36
4.1 CORRELATION COEFFICIENT MATRIX ... 36
4.1.1 Correlation coefficient matrix among Idle 1 versus idle 2 mode ... 36
4.1.2 Correlation coefficient matrix among idle as a single variable ... 40
4.2 STATISTICAL TECHNIQUES... 42
4.2.1 Principal component analysis ... 42
4.2.3 Projection technique ... 50
4.2.4 Gaussian process regression ... 62
4.3 ARTIFICIAL NEURAL NETWORK... 63
4.4 LONG SHORT-TERM MEMORY NETWORK ... 65
4.5 CARBON DIOXIDE EMISSION ESTIMATION ... 67
4.5.1 Emission estimation based on NONROAD2008 ... 67
4.5.2 Emission estimation based on fuel used ... 68
5 RESULTS ... 69
5.1 IMPACT OF PRE-PROCESSING ON THE ACCURACY OF THE MODELS ... 69
5.2 IMPACT OF PRE-PROCESSING GAUSSIAN PROCESS REGRESSION MODEL ... 70
5.3 ACCURACY OF NEURAL NETWORK AND LSTMN ... 70
5.4 CO2 EMISSION FROM THE EQUIPMENT ... 70
5.5 WEIGHT OF PREDICTORS ... 71
5.5.1 Partial least square regression ... 71
5.5.2 Partial least square regression (predictor with high correlation coefficient) ... 73
6 DISCUSSION ... 75
6.1 PERFORMANCE OF MODELS ... 75
6.2 REFLECTION ON THE WEIGHT OF THE PREDICTORS ... 78
6.3 REFLECTION ON THE SOCIAL ECONOMIC AND ENVIRONMENTAL ASPECTS OF THE WORK ... 79
6.4 CO2 ESTIMATION ... 79
6.5 GENDER EQUITY IN EQUIPMENT DRIVING ... 80
7 CONCLUSIONS ... 80
8 SUGGESTIONS FOR FURTHER WORK ... 81
LIST OF FIGURES
Figure 1 Emission standard’s impact on substantial reductions of HC, NOx & PM for diesel
engines ... 4
Figure 2 Comparison of US Tier 4 standard versus EU Stage V ... 5
Figure 3 Volvo CE telematics system ... 7
Figure 4 NOx emission per source in region US and EU ... 8
Figure 5 PM emission per source in region US and EU ... 9
Figure 6 Impacting factors on CE: s exhaust emissions ...14
Figure 7 Machine learning techniques ... 20
Figure 8 Before and after rescaling of the dataset (UV-rescaling)... 24
Figure 9 Mean centering ... 24
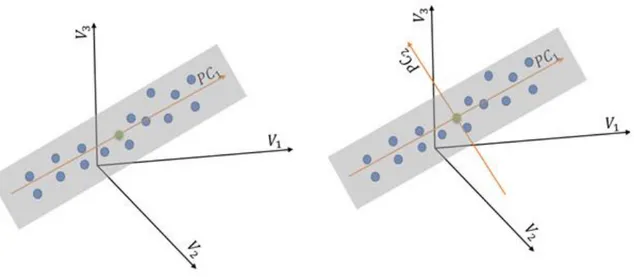
Figure 10 Plan built by principal components ... 26
Figure 11 Principal components coordinate system... 26
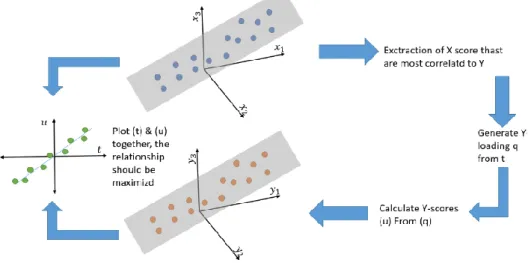
Figure 12 PLS terminology ... 27
Figure 13 Projection to latent structures ... 27
Figure 14 Workflow of the model development ... 31
Figure 15 Work flow of training a neural network ... 33
Figure 16 Percent variance explained by different principal components (mean centering) .. 43
Figure 17 Correlation coefficient among to variables based on mean centering ... 43
Figure 18 Explained variance of PCA ... 44
Figure 19 Correlation coefficient among to variables ... 45
Figure 20 Explained variance in x with different PCs ... 46
Figure 21 Relationship between the variables along to first, second and third variable ... 47
Figure 22 ML-R accuracy based on mean centering ... 48
Figure 23 ML-R accuracy based on mean centering and MAX-MIN scaling feature ... 49
Figure 24 ML-R accuracy based on mean centering ... 50
Figure 25 Percent variance explained by different factors of PLS-R (mean centering) ... 51
Figure 26 PLS-R accuracy based on mean centering ... 51
Figure 27 PLS-R important variables based on mean centering ... 52
Figure 28 Explained variance of PLS-R based on mean centering and max-min scaling ... 53
Figure 29 PLS-R accuracy based on mean centering and MAX-MIN scaling feature ... 53
Figure 30 PLS-R important variables based on mean centering and max-min scaling feature ... 54
Figure 31 Explained variance of PLS-R based on mean centering ... 55
Figure 32 PLS-R accuracy based on mean centering ... 55
Figure 33 PLS-R important variables based on mean centering ... 56
Figure 34 Principal component that explain the variance of the predictors ... 57
Figure 35 PC-R accuracy based on mean centering ... 57
Figure 36 PC-R principal components based on mean centering and max-min scaling feature ... 58
Figure 37 PC-R accuracy based on mean centering and max-min scaling feature ... 58
Figure 38 PC-R accuracy based on mean centering ... 59
Figure 39 PC-R accuracy based on mean centering ... 59
Figure 41 SVM accuracy based on mean centering and max-min scaling feature in
pre-processing ...61
Figure 42 SVM-R accuracy of the predictor with high correlation coefficient ...61
Figure 43 Left: GP-R accuracy mean centered and normalized. Right: GP-R accuracy mean centered ... 62
Figure 44 Terminology of simple layer neural network... 63
Figure 45 Residual between true response and predicted response ... 66
Figure 46 Accuracy of LSTMN model ... 66
Figure 47 Important variables corresponding to first factor ... 72
Figure 48 Important variables corresponding to second factor ... 72
Figure 49 Important variables corresponding to third factor ... 73
Figure 50 Important variables corresponding to first factor ... 73
Figure 51 Important variables corresponding to second factor ... 74
Figure 52 Important variables corresponding to third factor ... 74
Figure 53 Samples contribution to the model ... 75
Figure 54 Impact of the normalization on the PLS-R model ... 76
Figure 55 Impact of normalization on the PLS-R model ... 76
LIST OF TABLES
Table 1 Global warming potential ... 3Table 2 EU Exhaust emission regulations ... 3
Table 3 EPA exhaust emission regulation ... 5
Table 4 Variance of different numerical ranges ... 23
Table 5 Correlation between idle duration and fuel consumption ... 36
Table 6 Correlation coefficient between fuel used and hydraulic oil temperature ... 37
Table 7 Correlation coefficient among fuel used and engine coolant temperature ... 38
Table 8 Correlation coefficient between fuel used at idle mode and number of engine shutdown at different engine speed. ... 38
Table 9 Correlation coefficient among fuel used at idle mode versus duration of engine before shutdown at different engine speed ... 39
Table 10 Correlation coefficient within idle duration and AC system at auto versus manual mode ... 40
Table 11 Correlation coefficient among idle fuel used and hydraulic oil temperature ... 40
Table 12 Correlation coefficient among fuel used during idling and hydraulic oil temperature ...41
Table 13 Correlation coefficient within duration of idle condition of the machinery at different RPM ...41
Table 14 Correlation coefficient within idle condition versus AC system of the machine ... 42
Table 16 Validation factors of ML-R based on mean centering and max-min scaling feature 49
Table 17 Validation factors of ML-R based on mean centering ... 50
Table 18 Validation parameters of PLS-R based on mean centering ... 52
Table 19 Validation factors of PLS based on mean centering and max-min scaling feature ... 54
Table 20 Validation factors of PLS-R based on mean centering ... 55
Table 21 Validation parameters of PC-R based on mean centering... 57
Table 22 Validation factors of PC-R based on mean centering and max-min scaling feature 58 Table 23 Validation factors of PC-R based on mean centering ... 59
Table 24 Validation parameters of PC-R based on mean centering ... 60
Table 25 Validation factors of SVM based on mean centering and max-min scaling feature ..61
Table 26 Validation factors of SVM-R based on mean centering ... 62
Table 27 Validation parameters of GP-R ... 63
Table 28 The properties of LSTMN model ... 65
Table 29 Performance and internal validation of LSTMN... 65
Table 30 Carbon dioxide emission estimation from EPA emission factor ... 68
Table 31 carbon dioxide emission estimation during idling from fuel consumption ... 68
Table 32 Impact of pre-processing on the accuracy of the models ... 69
Table 33 Impact of pre-processing on the accuracy of GP-R ... 70
Table 34 Accuracy of neural network ... 70
Table 35 External validation parameters of LSTMN ... 70
Table 36 Compression of CO2 estimation techniques ... 70
ABBREVIATIONS
Abbreviation DescriptionAMR Allied Market Research
ANN Artificial Neural Network
AQG Air Quality Guidelines
CE Construction Equipment
CFR Code of Federal Regulations
CH4 Methane
CO2 Carbon Dioxide
DOC Diesel Oxidation Control
DPF Diesel Particulate Filter
EEA European Environment Agency
EMEA Europe, Middle East and Africa
EMEA Middle East, and Africa
EPA Environmental Protection Agency
GP-R Gaussian Process Regression
GP-RS General Packet Radio Service
GP-RS General Packet Radio Service
GWP Greenhouse Gas Potential
HC Hydrocarbon
ICCT International Council on Clean Transportation
LSTMN long short-term memory network
ML-R Multivariate Linear Regression
MVDA Multivariate Data Analysis
N2O Nitrous Oxide
NO2 Nitrogen Dioxide
NRMM Non-Road Mobile Machinery
NSOF Non-Soluble Organic Fraction
NSR NOx Storage Reduction
PC Principal Component
PCA Principal Component Analysis
PC-R Principal Component Regression
PDS Pre-Diagnostic System
PDS Pre-Diagnostic System
PEMS Portable Emissions Measurement Systems
PLS-R Partial Least Square Regression
PM Particulate Matter
PPB Parts Per Billion
PPMV Parts Per Million Per Volume
RPM Revolutions Per Minute
SAT Satellites
SCR Selective Catalytic Reduction
SOF Soluble Organic Fraction
SVM-R Support Vector Machine Regression
US EPA United States Environmental Protection Agency
UV Ultraviolet
DEFINITIONS
Definition Description
Equipment age The number of year that the equipment has purchased
Engine tiers Emission standard, manufacture of diesel engine must
meet the performance level after a specified date
PEMS system Measurement system that identifies the exhaust gas
character
NONROAD2008 Exhaust gas estimation method developed by International Plant Protection Convention
Non-road/off-road Refers to engines used in other than a motor vehicle
40 Code of
Federal Regulations (CFR)
1
INTRODUCTION
Air pollution causes lots of damage to the human body, plants, lakes, and animals (EPA, 2017). World Health Organization (WHO) estimates that this phenomenon causes about 4.3 million deaths each year, leaving most people suffer from stroke and heart-condition (World Health Organization, 2020). Saxena, et al. (2019), explains that air pollution sources can be classified into four categories: energy sector, industrial sector, agriculture and waste. Energy sector generates the largest proportion of air pollution emissions. This sector contains the transport sector, which further consists of sub-categories such as on-road and off-road vehicles.
According to Environmental Protection Agency (2017), on-road refers to vehicles used for transport of passengers or goods such as heavy-duty, light-duty and trucks. The term off-roads refers to vehicles and engines used in construction, agriculture and other purposes such as aircraft, construction equipment and vessel. Masters (2011), describes that construction equipment is used for various purposes such as construction industry, building roads, building bridges, etc. According to The Constructor (2020), there is a wide span of different types of construction equipment in different sizes. Nevertheless, the size and type of equipment depends on the application areas and the size of the projects. Fu (2013), describes that wheel loaders and excavators are some common construction equipment. Fan (2017), and Matthews, Rutty, & Andrey (2017), state that the most of this construction equipment are powered by diesel. Toth (2016) and Sajjad, et al. (2013), states that construction equipment averagely consumes 38 liters of diesel per hour and emits 87.400 g/h carbon dioxide (CO2) into
environment. Dybdahl, et al. (2004) states that particulate matter (PM) is a product of the combustions process of the diesel engines which considers toxic and carcinogenic. Sajjad et al. (2013); and Frey, Rasdorf, & Lewis, 2010; Heidari & Marr, (2015), observes that most of construction equipment (CE) are considered as stationary machines and spend a significant time during the idle-condition under its daily operation. There are several studies that believe the idle-condition of the engine as an issue that needs to be minimized. Sajjad et al. (2013) points out that the idle-condition of an engine has a negative impact on the environment, economy, and air quality. Furthermore, Brodrick, Dwyer, Farshchi, Harris, & King JR (2011) states that idle condition of the engines has negative impact on the operator as well as the engine its self. However, Sajjad et al. (2013), spots that idle duration of the engine is a function of ambient temperature. However, there is a significant gap in idle condition of the engine in cold versus warm ambient temperature. According to IEA (2005), geographical locations with cold ambient temperature refer to places where the ambient temperature is equal to or lower than 10 degrees Celsius during six months of a year. Warm ambient temperature refers to places where the ambient temperature is 25 degrees Celsius or higher during six months of a year.
Perozzi, Mattetti, Molari, & Sereni (2016), explains that there is a lack of data in the literature that monitors the idling condition of the CE. Furthermore, it is a difficult task to measure the duration of idle-condition of the construction equipment. Manley & Peters (2012), confirms
the complexity of fuel consumption and exhaust emissions of construction equipment during idling. It proposes more studies needs to be done in this field in order to increase the knowledge
about the factors that affect the fuel consumption and CO2 emission. Fan (2017), suggests to
measure the fuel consumption of the machinery of a construction site by weekly data and Perozzi, Mattetti, Molari, & Sereni (2016), proposes to maintain specific sensors to measure the duration of idling and its fuel consumption. Volvo CE has over 88.541 machines worldwide and owns 9.8% of the global market (Confidential, 2019). The machinery is equipped with several specific sensors and telematics system that measure and monitor the results (Volvo CE, 2020). Fan (2017), suggests to consider the CE machines as a black box and develop statistical models to explore the factors that impacts the fuel consumption of the machinery. By this, valuable information about machinery itself will be obtained and it will also increase the knowledge about CE machines.
1.1 Background
This section presents the theoretical background of this thesis work and the section will introduce general information about the back-bone of this study. Nevertheless, the section ends up with the presentation of the aim and delimitation of the study.
1.1.1 Global warming potential and environment
According to Erin (2019), the essence behind the rise in the global average temperature is the increase in consumption of fossil fuels. During the burning process of fossil fuels, greenhouse
gases such as CO2 are released into the atmosphere. Erin (2019) and Buchanan (2016) explain
that demand of energy from fossil fuel such as coal, oil and gas has been increased during recent years. Buchanan (2016), explain that the energy sector is the main source of a large
proportion of greenhouse gases and CO2 emissions. Notwithstanding, a quarter of global
emissions emanate from the transport sector. This has led to an increased greenhouse effect,
which in turn has led to global warming. CO2 is a greenhouse gas that allows short-wavelength
solar rays to pass through the atmosphere but prevents long-wavelength radiation from leaving the Earth's atmosphere, this is called the "greenhouse effect". Buchanan (2016) mention that the greenhouse effect is necessary and without this phenomenon, the average soil surface temperature would be -18 degrees Celsius. United States Environmental Protection Agency (2020) states that natural greenhouse gases are comprised of other gases too. This mixture consists of; 81% CO2, 10% CH4, 7% N2O and 3% fluorinated gases. However, recently the
concentration of CO2 from 400 parts per million per volume (PPMV) has increased
substantially by 280 PPMV during the industrial period. Another greenhouse gas that has
increased remarkably is the amount of CH4 in the atmosphere. Currently, the CH4
concentration is 2000 ppb (parts per billion), which has increased by 300% from the period before the industrialization (580-783 ppb). Schuerger, Moores, Clausen, Nadine, & Britt
(2012), explains that CH4 formation changes in the atmosphere, which affects its impact and
durability. Based on this fact, it is difficult to estimate the lifetime of methane in CO2
the atmosphere. Schuerger et al (2012), explains that CH4 can be destroyed in interaction with
ultraviolet (UV) rays.
Wei, Zhu, Shu, Tan, & Wang (2012), explain that to analyze the significance different gases in atmosphere, it is necessary to measure every gas by the same unit which is greenhouse gas potential (GWP). Buchanan (2016), indicates that GWP describes the ability of a greenhouse gas to contribute to the greenhouse effect and global warming. However, Erin (2019) observes that the European Union (EU) has the vision to reduce the greenhouse gases by 20% until 2020 by having 1990 as a reference year, through switching to renewable energy sources and increasing energy efficiency. Table 1 show the GWP of some common gases in the atmosphere. Table 1 Global warming potential. Source: (Naturvårdsverket, 2019)
Greenhouse gas GWP
CO2 1
CH4 25
NO2 298
1.1.2 EPA and EU non-road emissions regulations
The European Commission has formed and established a series of emission standards for road diesel engines in recent decades. European Commission (2014), states that the term non-road mobile machinery (NRMM) refers to “small gardening and handheld equipment (lawnmowers, chain saws), construction machinery (excavators, loaders, bulldozers,) agricultural & farming machinery (harvesters, cultivators,); even railcars, locomotives and inland waterway vessels”. Table 2 presents the regulation process concerning its adoption date and directive. The European Commission (2018), states that these regulations are intended to protect the health of EU citizens, improve air quality and protect the environment. The international council on clean transportation (2016), indicates that every EU-state regulatory authority most apply those directives both on internal and external markets for new machines. The European Commission (2014), describes that each directive consists of two parts, the first part describes how and when each directive should be applied and the second part focuses on the development and implementation of technical specifications. Furthermore, it also introduces the circumstances for the forthcoming directives. The European Commission (2018), states that regulations impose emission restrictions on non-road machines for different engine-power (see Table 2). Non-road manufacturers are forced to meet these requirements for new machines to enter the European market. Table 2 is adopted based on the information from the international council on clean transportation (2016).
Table 2 EU Exhaust emission regulations, source: Directives on emission from non-road mobile machinery
Directive Adoption date Progress
97/68/EC December 1997 Implementation of Stage I & II emission standards regarding
exhaust emission discrimination for diesel engines with a horsepower span of 37-560 kW
2014/26/EC April 2004 Manifestation of Stage IIIA, IIIB and IV emission standards. With contrast that regulations expand the range of the horsepower to 19-560 kW
2006/105/EC November 2006 Modification of previous directive regarding concerns on the
approval standard numbering system
2010/26/EC March 2010 Modification of directive regarding to IIIB and IV emissions
standards
2011/88/EU November 2011 Modification of directive regarding IIIB engines
2012/46/EU December 2012 Adjustment of previous directive and additional of reflection
on technical process on emission measurement.
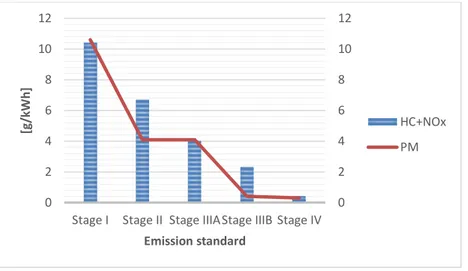
The international council on clean transportation (2016) states that each directive is stricter compared to the previous version, and also includes a wider range of equipment. Figure 1
presents the impact of emissions standards on HC, NOx and PM emissions. The vertical axis
presents the substances in grams per kilowatt-hour and the horizontal axis presents the European emission standards. The figure is adopted based on the information from the international council on clean transportation (2016).
Figure 1 Emission standard’s impact on substantial reductions of HC, NOx & PM for diesel engines. source (ICCT, 2016)
The International council on clean transportation (2016), states that each directive is stricter
and imposes tougher limits on emissions of PM, HC and NOx. The European Commission has
upgraded the Stage IV standard and proposed Stage V. However, Stage V targets a broader range of diesel engine power (19 <kW <560) and limits PM and NOx + HC emissions by 97 and 94%, respectively.
Hooftman, Messagie, Mierlo, & Coosemans (2018), observe that the European Environment Agency (EEA) annually publishes a report that measures the air quality level of members. However, the report considers the WHO Air Quality Guidelines (AQG) to ensure the health of European citizen. The report also considers the ambient air quality directives and examines the progress of the measures. Further, the authors analyze the results of the reports in 2000 to 2014 and find that thanks to the strenuous European Ambient Air Quality Directives, the air quality is acceptable and the directives have had a positive effect on air quality.
0 2 4 6 8 10 12 0 2 4 6 8 10 12
Stage I Stage II Stage IIIAStage IIIB Stage IV
[g/ kW h ] Emission standard HC+NOx PM
The environmental protection agency is the United States regulatory authority that controls and establishes inventory and regulations against techniques and operations with the intention of securing air quality standards (EPA, 2019). The environmental protection agency (2016), notes that in the United States, regulations governing the restriction of substances such as NOx,
CO, HC and NMHC for off-road diesel engines are handled in accordance with the procedures of 40 Code of Federal Regulations (CFR). Nevertheless, PM restrictions are enforced with regard to California Regulations. Table 3 describes the various regulations and their adoption time. Table 3 is developed based on the information from environmental protection agency (2016).
Table 3 EPA exhaust emission regulation
Standard Adoption
date
Progress
Tier 1 1998-2000 Limitation of substantial reductions of NOx & PM for diesel engines
regarding to engines power in range of 8-560 kW.
Tier 2 2001-2006 Limitation of substantial reduction of NOx & PM for diesel engines
regarding to engines power in range of 8-560 kW
Tier 3 2006-2008 Limitation of substantial reduction of NOx & PM for diesel engines
regarding to engines power in range of 37-560 kW
Tier 4 2008-2015 Delamination of substantial reductions of NOx & PM for diesel
engines regarding to engines power in range of 56-560 kW
Milieu Ltd (2004), describes that it’s difficult to compare the American regulatory standards process with the European one, as each region limits different substances regarding to different geographical conditions. However, the international council on clean transportation (2016) states that the latest European regulation standard (Stage V) for new machines places a higher limit on the emission of PM compared to the American emission standard (Tier 4). Figure 2
shows that for NOx emissions both make the same requirements but for the emissions of PM
stage V is roughly strict.
Source ICCT 2016
Figure 2 Comparison of US Tier 4 standard versus EU Stage V
Naturvårdsverket (2018), states that since 2008 European Commission has regulated CO2
environmental requirements on the manufacturer of the maintained vehicle type and that CO2
emissions must not exceed 95- and 147-grams CO2 per kilometer for passenger cars and light
trucks, respectively. Naturvårdsverket (2018), asserts that in 2014 the European Commission took the initiative and introduced strategic work that through successive steps, increases the
knowledge regarding CO2 emissions from buses and heavy trucks. However, due to a lack of
information on fuel consumption and CO2 emissions of this on-road transport type, no
measurements or reports were presented.
Naturvårdsverket (2018), declares that in 2017 the European Commission introduced a simulation program (Vehicle Energy Consumption Calculation Tool, VECT) to calculate new
heavy vehicle fuel consumption and CO2 emissions. Nonetheless, EU has not taken the CO2
emission from construction equipment or construction sites into account. Moreover, Fan (2017), states that the life-time of construction equipment is long and regulations in
CE-industry impose requirements for new machines without taking the CO2 emission into account,
therefore several actions are needed in this area to reduce the environmental cost.
1.1.3 Construction equipment industry
Allied market research (2020) and Market Report (2020), mentions that construction equipment is also known as heavy equipment. Market Report (2020), mentions that earlier, the CE industry faced an economic slowdown due to the world's economic condition. Nevertheless, there is some uncertainty regarding forecasting the market size of the construction equipment industry from a global perspective. This might be since the manufactures are not willing to share such an information. Although, according to Allied Market Research (AMR), the market size of the construction equipment industry is expected to be $288.8 billion by 2020. However, the analyses depict the market has grown by 9.2% during 2016-2020. Though, Market Report (2020), is expecting that the market has the potential to grow steadily by 4.5% until 2025. The market growth is suspected to be different in different regions, China is expected to have the highest growth by 7.2%, the market size in the US and EU is supposed to grow by 3.6%, the author's prediction model doesn't state in percentage how the CE industry will change in emerging countries such as Asia-Pacific, Latin America, and the Middle East. Though, Market Report (2020), states that they have the potential to grow and shape the market. Following the peak growth in EU construction output of 4.1% in 2017, the rate of growth slowed down to 2.8% in 2018. This trend has continued in the beginning of 2019 and was forecasted to have a growth rest of the year.
According to the Market Report (2020) and Allied Market Research (2020) the following list is the key players of the CE market:
• Volvo AB • Caterpillar Inc. • Komatsu Ltd
• Doosan Heavy industries & Construction Co. Ltd. • Hitachi Construction Machinery Co. Ltd.
• J.C. Bamford Excavators limited • Kobe Steel Ltd
• Liebherr Group • Atlas Copco AB
• CNH Industrial N.V.
The client of this thesis work is Volvo CE Eskilstuna. Volvo CE is a part of the Volvo Group and environmental care is its core values (Swecon, 2020). Volvo CE’s intention is to reduce the environmental impacts of its products and demands developing an algorithm to identify the
fuel consumption and CO2 emissions with a focus on idle-condition. Volvo CE launched
headquarters of Uptime Center in Eskilstuna, Sweden on the 17th of December 2018. Uptime
Center's intention is to support the entire Volvo dealer network in Europe, the Middle East, and Africa (EMEA) region to keep customers' machines running which happens to be Volvo CE vision (Bast, 2019).
Uptime Center is a unit that manages the input data coming from the construction equipment. It monitors how the customer treats machines and how the equipment performs from a time and space point of view. Furthermore, it is worthy to mention that Uptime Center doesn't have knowledge about the operator identity. Generally, the aftermarket product’s support can take place through two different approaches: Proactive and Reactive product support.
Reactive support is the traditional customer support manner, where the end customer comes in contact with a Volvo dealer and describes the problem. Based on the problem description, the dealer coordinates how to tackle the issue to keep the machine uptime (rolling). Proactive product support defines as a unit (Uptime Center in this case), based on the machine's performance information, predicts the possible errors that may occur for the machine and thereby inform the end customer through the Volvo dealer. The reactive approach predicts the problem before it takes place and brings time reduction in entire product support process thus
it identifies which component is needed and which kinds of
mechanics are most sufficient to tackle the issue.
Uptime Center deals continuously with Active care which consists of two parts: monitoring and weekly report. The monitoring process goes through the CareTrack, which is the terminology that Volvo CE uses for its telematics system. The CareTrack information is upgraded every five minutes automatically. Figure 3 shows how the information flow of Volvo CE’s telematics system.
The machine sends information through General Packet Radio Service (GP-RS) or Satellites (SAT). All the information saves into CareTrack server, which is the system's data warehouse. The data warehouse is getting analyzed by the Pre-Diagnostic System (PDS), which is based on advanced Deep Learning techniques where different variables are trained to identify pattern recognition of the data warehouse. However, PDS send the results to Volvo product support (Uptime Center). However, the received information will be analyzed further by product specialists and identifies the error codes regarding the performance of the machine to obtain an overview of the machine. Furthermore, product specialists analyze the behavior of the operator machines as well. The behavior of operator machines measured based on engine speed and engine status. Further, the results of this procedure compiles into a report and sent to the closest dealer to the customer in the EMEA region. The Volvo dealer checks the report and informs the customer.
Moreover, a weekly report about the performance of the machinery is conducted and sent to the fleet manager in order to present an overall assessment. The weekly report contains overall information about the machine status and also proposal parts that may improve fuel consumption and performance of the machine.
1.1.4 Exhaust emissions from construction equipment
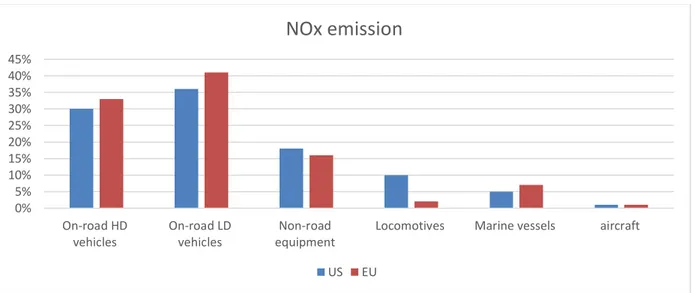
Kubsh (2017), mentions that agricultural and construction equipment are the key sources of air pollution in many countries. Menon & Dallmann (2o16), claims that construction equipment is a key source of air pollution in the regions of United States and European Union. Further, according to Kubsh (2017), the equipment is mostly diesel-powered and emits harmful particles into the environment during the combustion process. Menon & Dallmann (2o16), states that NOx and PM are among the important pollutants that has raised lots of
concern. Figure 4 displays the NOx contribution from different sources in regions United States
and the EU. On-road vehicles such as light and heavy machines are still the dominant source of air pollution compared to other sources. The figure is created based on the information which is presented in Kubsh (2017) report.
Figure 4 NOx emission per source in region US and EU. Source: Kubsh (2017)
0% 5% 10% 15% 20% 25% 30% 35% 40% 45% On-road HD vehicles On-road LD vehicles Non-road equipment
Locomotives Marine vessels aircraft
NOx emission
Figure 5 displays the PM contribution from different sources in regions United States and EU. On-road vehicles such as light and heavy machines are still the dominant source of air pollution compared to other sources. The figure is created based on the information which is presented in Kubsh (2017) report.
Figure 5 PM emission per source in region US and EU. Source: Kubsh (2017)
Naturvårdsverket (2018), states that there are some uncertainties regarding the estimation of emissions from CE machines in Sweden. This may partially depend on lack of fuel consumption reports in these sectors and partially because of the estimation tools itself. Moreover, the estimation devices based on stationary diesel engines, consequently needs to upgrade in order to present a more realistic profile about characterizes and the overall environmental impact of exhaust emission. The Swedish environmental protection agency monitors exhaust emissions from different sectors such as transport and industry etc. (Jonsson & Bondemark, 2017). Naturvårdsverket (2018), believes that a large proportion of construction equipment are diesel-powered combustion engines. Hence, it emits greenhouse gases into the atmosphere during its operation. Adriansson (2019), states that the largest application area of construction equipment in Sweden is in the industry- and construction sectors. However, CE machines contribute to 40% of the total greenhouse gas emissions from those sectors. According to Jonsson & Bondemark (2017), emissions from CE machines have increased by 25% compared to 1990. However, the increased amount of emission corresponds to a quarter of a million tons
of CO2 equivalent. Naturvårdsverket (2018), observes that during 2016 CE machines emitted
3.5 million tons of greenhouse gases which corresponds to 20% of total emissions from the transport sector. Adriansson (2019), analyzes the characterization greenhouse gas emission from CE machines and concludes that CO2 comprises the largest part, but although other
substances exist too.
According to Naturvårdsverket (2018), among CE machines, tractors emit the biggest amount
of CO2 in Sweden. Further, wheel loaders, excavators, snowmobiles/quad bikes, mining/Tipp
trucks and riding mowers are other types of CE machines that contribute to 70% of total CO2
in Sweden.
Jonsson & Bondemark (2017), mention that since 1990 Sweden’s territorial emissions have decreased by 25 %. However, during the same period emissions from CE machines have moved
0% 10% 20% 30% 40% 50% On-road HD vehicles On-road LD vehicles Non-road equipment
Locomotives Marine vessels aircraft
PM emission
out in the opposite direction and increased by 13%. Further, Naturvårdsverket (2018), observes that the Swedish transport administration in accordance with EU emission regulation has introduced Steg regulations69. Furthermore, this requirement means that CE machines that operate in the urbanized areas such as Malmo, Stockholm, and Gothenburg should not be older than 12 years (since the machines have purchased) and the machines should meet Step IV or later emission standards.
1.1.5 Previous studies in this field
Abolhasani, et al. (2012); Frey, Rasdorf, & Lewis (2010) and Heidari & Marr (2015), analyzed the accuracy of NONROAD2008 estimation method by using portable emissions measurement system (PEMS). PEMS is a device that is used to measure the exhaust emissions in real-time and NONROAD2008 is an estimation technique that is been developed by EPA. However, the authors explain that NONROAD2008 is based on a steady-state engine dynamometer test. It uses an uninstalled stationary engine in a laboratory environment and does not represent the exhaust emissions from a real-world perspective. Therefore, this area requires more studies to quantify the fuel consumption and exhaust emission rates of non-road equipment.
In an explanatory data analysis performed by Frey, Rasdorf, & Lewis (2010), explores the strength of predict variables such as; engine tire, engine size, engine model year and engine load with respect to fuel consumption and exhaust emission profile as respond variables. The authors put the generation of gases such as; NOx, HC, CO and PM into focus. Further, the
exhaust emissions are measured by applying PEMS system to evaluate the accuracy of the NONROAD2008 estimation model.
Abolhasani, et al. (2012), measures the emission profile of the CE in a similar manner as Frey, Rasdorf, & Lewis (2010). What is distinguishable is that Abolhasani, et.al (2012), focuses only on excavators and analyzes the impact of the duty cycle on fuel consumption versus emissions profile of the construction equipment. Heidari & Marr (2015), emphasizes the importance of quantification of the exhaust emission from construction equipment. Therefore, the authors validate and compare the NONROAD2008 and OFFROAD2011 methods with each other. The results explicated that there is a large gap in the emission level between estimation methods (NONROAD2008 & OFFROAD2011) versus real-world. However, the result of the experiment also showed that the gap was more substantial especially regarding equipment that meets higher Tire (Tire 3 & Tire 4) emission standards (Abolhasani, et. al., 2012; Frey, Rasdorf, & Lewis, 2010; Heidari & Marr, 2015). Abolhasani, et al. (2012); and Frey, Rasdorf, & Lewis, (2010); and Heidari & Marr, (2015), propose that the exhaust emission estimation models needs to be upgraded, specifically for the equipment that has a higher emission standard as they release a lower amount of emissions to the atmosphere.
Furthermore, some authors emphasize the importance of the idle-condition from a fuel economy and exhaust emission perspective. Perozzi, et al. (2016), observe that construction equipment is a stationary machine and it is a difficult task to measure the idle-condition of construction equipment in contrast with the on-road vehicle. Hence, in the case of the on-road vehicle, the idling duration can be determined by considering the gear position (if the gear is in the neutral mode, this means that the machine is idling). In the case of off-road vehicles, a
complex study is required to develop an approach to estimate the idle duration. For this purpose, an embedded sensor system is needed to fulfill and tackle this issue.
Matthews, et al. (2017), analyzes the idling duration with regards to the ambient temperature, operator behavior and fuel consumption during both winter and summertime. The results indicate that the idling occurs mostly because of the operator's personal attitude. Further, the duration of idling is seasonal, and its portion is higher during the wintertime. Nevertheless, the authors acknowledged the inaccuracy of the data, partly because of poor maintenance of the device that measures the machine behavior and partly because of the delimitation of the device's memory capacity.
Brodrick, et al. (2011) and Fan (2017), studied the strength of different factors during idling such as engine load, engine speed and production year of the engine and their impacts on fuel consumption as well as exhaust emission of the equipment. Fan (2017), only analyzed 14-wheel loader from different manufacturers operating in different job sites. The data collection was excuted manullay on a weekly basis by installation of specific sensors in the gear-box. By this manner, the number and duration of idlings were recorded for every wheel loader. Thus, the authors acknowledge about doubts that may rise about the accuracy of the data. Therefore, they suggest a similar study should be done using data from Telematic systems. Brodrick, Dwyer, Farshchi, Harris, & King Jr (2011) perform a similar study as Fan (2017), but focusing on excavators instead.
Until this point, few studies have been executed on one single equipment model that
simultaneously focuses on CO2 emission and enjoy data from telematics systems. Fan (2017),
Perozzi, et al. (2016); Brodrick, Dwyer, et al. (2011); and Frey, Rasdorf, & Lewis (2010) are united that there is very little real-world data available that presents the idle duration of off-road machines. They propose more studies should be done to identify the factors that impact the fuel consumption of diesel engines, specifically construction equipment. Additionally, they highlight that such studies provide an overall profile of all the components and their impact on fuel consumption. Frey, Rasdorf, & Lewis (2010) also emphasize the importance of such information and add that it helps to assess the environmental impact of CE activities.
1.2 Purpose/Aim
The purpose of this degree project is to develop a statistical model that explores the strength of contributing factors that impact the fuel consumption during idling. The outcome of the work will be to optimize emission control technologies to maximize the utilization degree of
CO2 emission reductions as well as the fuel economy of the construction equipment. The model
will support the decision-maker or fleet manager to identify equipment’s components which
contributes during the idling to quickly decide the most appropriate CO2 emission technology
1.3 Research questions
1. What data analysis techniques are suitable to estimate CO2 emissions from CE?
2. How accurate the different prediction models are to estimate the fuel consumption of CE?
3. Which factors contribute highly to fuel consumption of CE during idling?
1.4 Scope of study and limitations
Since the construction equipment types vary a lot, a single model of excavator (EC480E) has been chosen. The machine selection is been executed with taking the client’s feedback into consideration. However, the chosen model is an equipment with high fuel consumption and high idling duration. The data extraction is been executed from Volvo CE’s telematic system which represents the equipment’s performance in Africa, Middle-east and Europe region. During the combustion process of diesels engines several particles is released into the environment, but this experiment is focused on estimation of CO2 emission during idling
condition of the equipment. This degree project is been executed anonymously and do not take the operators identity and operator skills into account.
2
LITERATURE STUDY
This section is conducted to cover and present the theoretical framework of this study. The section starts by identifying the idle condition of the engine and its reasons. Further, the section explains the factors that contribute to idling.
2.1 Idle-condition of the equipment
Several studies assume the idle-condition of the engine as an issue that should be taken care of. Sajjad et al. (2013), remarks that the idle-condition of an engine harms the environment, economy, and health. Raczon (2016), confirms that idle-condition is an issue and needs to be minimized to reduce fuel consumption in construction equipment and increase the fuel efficiency.
Perozzi, Michele, Molari, & Eugenio (2016), analyzes the idle condition of tractors. However, idling is an engine condition in which the engine is on without purpose and the machinery is not in movement. Furthermore, the idle span of tractors can be classified as follows:
1. Short term: headland turns
2. Medium-term: job activity transformation
3. Long-term: comfort purpose or keep the engine at optimal condition especially in cold region.
Matthews, Rutty, & Andrey (2017), perform a similar study for heavy trucks. However, the authors define idle-condition a situation in which the engine is on and the vehicle is not in motion. Furthermore, the idling reasons for trucks can be categorized as following:
1. Startup the engine (waiting period to reach the optimal condition of the engine) 2. Waiting period because of drivers’ personal purpose
3. Waiting period because of traffic conditions (red lights, heavy traffic, etc.)
Brodrick, Dwyer, Farshchi, Harris, & King Jr (2011), observe that idling costs about $838 million and 2 trillion gallons of diesel fuel. Moreover, it releases hazardous substances into the atmosphere and damages the engine.Matthews, Ruth, & Andrey (2017), indicate that during idling, engine generates vibration and noises that harms the driver's health.
Sajjad et al. (2013), analyzing the impacts of idling of passenger cars regarding fuel consumption and exhaust emissions. The analysis states that, in average, a diesel vehicle
consumes 7-liter fuel/h and emits 16 kg/h CO2 during idling. The analysis confirms that the
emission content has a positive correlation with the ambient temperature. In cold temperature conditions, fuel consumption is higher compared to warm temperature conditions. According to International Energy Agency (2005), geographical locations with cold ambient temperatures refer to places where the ambient temperature is equal to or lower than 10 degrees Celsius for six months of a year. Places with a warm ambient temperature refer to locations where the ambient temperature is 25 degrees Celsius or higher within six months during a year.
Perozzi, Michele, Molari, & Eugenio (2016), states that off-road machines are stationary, therefore it's a difficult task to allocate the idling duration. However, the authors propose that by installing different specific sensors on the engine it’s possible to monitor the idling pattern of the machine. Chrentienne (2014), states that identifying the factors that lead to
idle-condition of the machinery is significant. Moreover, by developing mathematical tools regarding optimization of planning and scheduling it can be minimized. Fan (2017), explains that optimization of planning and scheduling of the construction site to reduce the idling condition brings only 10% reduction in fuel consumption, which is almost impossible.
2.2 Factors that impact the fuel consumption and exhaust emission of CE
Fan (2017), indicates that there are many factors that influence the fuel consumption and exhaust emission of the construction equipment. Nevertheless, those factors can be classified into four main categories. Figure 6 is adopted based on the information from the author’s paper.Figure 6 Impacting factors on CE: s exhaust emissions
2.2.1 Equipment and condition
Fan (2017), describes that engine manufacturing year, horsepower, manufacturer of the engine and engine size are the main factors affecting the emission rate of construction equipment during operation. Sandanayake, Zhang, & Setunge (2015), observe that the performance of the CE machines deteriorates by the time. Consequently, the rate of fuel consumption and exhaust emissions of the machinery increase. Fan (2017), states that by the implementing manufacture’s instruction manual, the contractor can control this issue within the addition of maintenance rate.
Zietsman & Perkinson (2005), observes that the design of diesel engines is not similar, which impact the fuel consumption and emission rate of the engine. This fact is especially true in comparison to new CE machines versus old models. Hence, the new engines used to meet the regulations standards such as Tire 4 or Stage V (check section 1.1.3). Fan (2017), observes that
the rate of the machinery exchange to the new generation is very slow because of the large investment cost of the CE machines.
2.2.2 Equipment maintenance
Fan (2017), observes that maintenance has a strong impact on the performance and fuel consumption of the construction equipment. Likewise, every machine has a specific manual and maintenance routine that needs to be followed properly. Waad (2020), highlights that fuel quality is not the same worldwide, not the condition of the machinery either. Hence, manufactures have developed different instruction manuals for different machines. Fan (2017),observes that poor maintenance strategy can cause higher repair cost which will have a negative impact on fuel consumption and exhaust emission as well.
Shukla, Gupta, & Agarwal (2018) and Resitoglu, Altinisik, & Keskin (2014), observe that after-treatment of exhaust emissions from diesel engines requires timely replacement of filters before it’s saturated. Hence, any default in the after-treatment system of diesel engines will negatively affect the performance of the machinery. Therefore, it changes the fuel consumption rate and exhaust emission character of diesel engines. Fan (2017), states that timely replacement of tires can minimize fuel consumption and increase the productivity of the machinery.
2.2.3 Equipment operations
Fan (2017) and United States (1994) observe that one of the biggest constructor struggles is to determine the right machine for the right job. Hence, every job activity has its own requirements to have higher productive usage. However, if the machinery overmatches or annihilates the job-site it will change the fuel consumption rate negatively. United States (1994), highlights the importance of fleet management of construction equipment to reduce the fuel consumption rate and increase the productivity of the job-site.
Waad (2020) claims that in fleet management, operator skills have a significant impact on fuel consumption and emission character of CE machines at the job-sites. Fan (2017), states that a skilled operator performs the tasks by consuming less amount of fuel. United States (1994), states that the development of the operator's competence will improve the fuel economy of the CE machines at construction sites.
Furthermore, Volvo CE (2012) performs a case study to measure the impact of operator skills on fuel consumption and its productivity at the job site. However, 80 operators have been classified into four different groups as follows:
1) novice (operator with 2-10 hours operation experience)
2) occasional (operators with machine knowledge but low operation experience)
3) test operator (Volvo CE employee that have good knowledge operation skills but not professional)
4) professional operator (professional operator and professional knowledge about the machinery). However, all the operators have performed the same task during the same job condition and the results have been ranked. The results establish that there is a huge gap regarding fuel
consumption and job productivity in between those four groups. Moreover, from a productivity point of view, there is a distinguished gap of 700% between professional operators versus novice operators. However, from a fuel economic point of view, this gape is almost 200%.
Fan (2017), confirms the importance of operator competence in fuel economy of CE machines. Further, skilled operators perform the tasks with a low amount of idling time, they have a better knowledge of how to take care of the machinery and identify the problem of the machine promptly. Nonetheless, skilled operators are expensive to hire and less competent operators can achieve similar results as well.
2.2.4 Operation condition
Fan (2017), states that the application area of construction equipment is as follows: digging, loading, hauling, backlighting, compaction, lifting etc. However, the mentioned job activity has a different job condition that impacts load condition and engine status. Brodrick, Dwyer, Farshchi, Harris, & King JR (2011), highlights the significance of diesel engines transient characteristics in fuel consumption and exhaust emission. However, an internal diesel engine consumes 0.6 gallons/h (2.27 liter/h) at 800 RPM (revolutions per minute) during idling. Afterwards, it increases to 2.25 gallons/h (8.52 liter/h) at 1200 RPM during the same status of the engine.
Matthews, Rutty, & Andrey (2017), observes that some papers establish that altitude of the construction site impacts the fuel consumption of the diesel engine and others do not. Fan (2017), states that diesel engines consume more fuel at high altitudes due to underperformance of the engine which leads to higher exhaust emission. Also, Ashrafur, et al. (2013) highlights the importance of the ambient temperature in fuel consumption of diesel engines. However, diesel engines that operate at the colder temperature consumes more fuel due to engine startup to achieve the efficient working condition.
2.3 Exhaust emissions and pollution reduction techniques
With increasing environmental awareness, many countries have formed strict emission control regulations on diesel engine exhaust (Na & Wei, 2011). Diesel emissions mainly consist of two main components carbonaceous material and soluble organic fraction; besides it also contains other components in smaller sizes such as sulfate and ash. (Shukla, Gupta, & Agarwal, 2018; Na & Wei, 2011; Isermann, 2014). McCormick, Ross, & Graboski (1997), claim that the
emission of NOx and diesel particles can head to harmful effects on human health. Graver, Frey
& Hu (2016), emphasize that due to negative effects from the emissions of diesel engines, studies are started around the world to control and improve combustion strategies. Na & Wei (2011) observe that there is no singular technology that is able to reduce all components of exhaust emission, therefore a combination of different techniques is needed to solve the pollution problem. Colin & Allan (2016), observe that technology development in engine emissions can be classified into two categories: active combustion strategy and passive combustion strategy.
According to Shi, Cui, Deng, Peng, & Chen (2006), this categorization is based on the stage of the pollution formation during the combustion process of a diesel engine. An active combustion strategy approach refers to reduce the pollution in the combustion chamber, versus the passive combustion strategy approach refers to reduce emissions before pollutants are released into the atmosphere.
2.3.1 Active combustion strategy
In the 1970s, the war between Israel and Arab countries led to an oil crisis. As a result, Arab countries started to nationalize their oil reserves. Ten years later, the Iraq-Iran war also affected the fuel economy worldwide (Paul, 2014). According to A. J. (2016), the unstable fuel economy market shaped the engine production line of the vehicles manufacturers and motivated them to switch to diesel engines. Paul (2014), describes that during the 1990s, the
USA and EU governments built strict restrictions on PM and NOx, which urged engine
manufacturers to develop new engines with lower emissions.
NOx particles are harmful for human health; therefore, NOx reduction has been out of the
interest of many researchers especially in the field of diesel engines (Cerit & Buyukkaya, 2008).
It is worthy to mention, some in-cylinder treatment techniques that reduce the NOx content of
the combustion process of a diesel engine are; injection timing retard, cooling the temperature and exhaust gas recirculation (EGR).
Many researchers believe that the injection timing technique is essential for the minimization of the net emission of a diesel engine. According to Cerit & Buyukkaya (2008), in addition to the minimization of the net emissions of a diesel engine, in this context, fuel economy should also be in the center of attention. However, Zehng, et al. (2014) studies injection strategies and their impact on the emission character with respect to four different fuels (pure diesel, Blends of gasoline, or / n-butanol). The analysis shows that reducing the injection time reduces the emission level of NOx. Cerit & Buyukkaya (2008), states that delaying of injection time leads
to a minimization of the peak cylinder pressure and temperature in the cylinder. This reduces
the NOx formation significantly during the combustion process.
Isermann (2014), emphasizes the importance of air temperature in pollution formation. However, by decreasing the air temperature, the air's heat capacity will increase in the cylinder. As a result, the peak pressure and temperature decrease in the cylinder, which also reduces NOx emissions.
Wei, et. al (2012), observe that EGR is one the most effective in-cylinder techniques that have
been developed to restrict NOx accumulation. Na & Wei (2011), states that EGR is conformed
for gasoline engines but it works with the same effect for diesel engines. Nonetheless, in the presence of EGR the combustion temperature is dropped which in turn leads to reduction of
NOx emissions. Shukla, Gupta, & Agarwal (2018), observe that automobile manufacturers have
modified and improved the EGR technology for modern diesel engines. This technique is
proficient to narrow NOx formation by diminishing oxygen levels and decreasing combustion
Tan, & Wang (2012), describe that by combining EGR with other emission reductions
techniques, the net NOx reduction of in-cylinder treatment will be more comprehensive.
Recently, diesel particles have been the target of many regulations. Diesel particles can be classified into two categories, Soluble Organic Fraction (SOF) and Non-Soluble Organic Fraction (Mohakumar & Senthikumar, 2017). Agarwal, Gupta, Shukla, & Dhar (2015) emphasize the importance of engine load in particle formation. According to Mohakumar & Senthikumar (2017), diesel particles are in the range of size from 7.5 to 1.0 microns and highlighting the importance of the particles size for human health. However, smaller particles are intended to be more dangerous for human body. Agarwal, Gupta, Shukla, & Dhar (2015), observe that fuel is of great importance in particle formation context. Due fuel with low hydrocarbon and high oxygen content contributes with smaller particle emission. However, one of the most common techniques that reduce the particulate matter formation is air management. Cerit & Buyukkaya (2008), emphasize the importance of air in the pollution formation of combustion engines. Zheng, et al. (2014), observe that particle formation is entirely dependent on how the air flows and mixes inside the engine chamber. LGuarieiro, Souza, & Torres (2009), observe that the design of a diesel engine has a decisive factor, in terms of air handling and particle emission reduction.
2.3.2 Passive combustion strategy
The most effective technique that is sufficient to reduce NOx emissions is EGR, but using EGR
causes increase in particle emissions (Shukla , Gupta, & Agarwal , 2018). It was mentioned in earlier sections that some in-cylinder technologies could affect the emissions of diesel engines. However, Kulkarni & Mohanta (2010) and Resitoglu, Altinisik, & Keskin (2015), observe that in order to meet emission standards, it is not enough to only implement in-cylinder techniques; after-treatment techniques are also necessary to satisfy the requirements of the regulations.
However, some common after-treatment techniques that reduces the formation of NOx are;
NOx storage-reduction (NSR) catalysts and selective catalytic reduction (SCR). However,
Shukla, Gupta, & Agarwal, (2018), speaks that NSR reduces NOx progressive in two steps.
Firstly, substances are collected and secondly, released and reduced during engine processing by the extension of an additional hydrocarbon. Further, Shukla, Gupta, & Agarwal (2018) claim that SCR technology has been used since the 1980s in various industries in pollution control purpose. This technique mainly consists of ammonia as the main substance in a water solution. SCR consists of three steps: hydroxylation catalyst section, SCR catalyst section, and oxidation catalyst section.
Two after-treatment techniques that prevent the particular emission into environment are diesel oxidation control and diesel particulate filter. However, diesel oxidation control (DOC) mainly consists of a ceramic monolith and besides diesel particles also combats CO and HC emissions. However, the degree of efficiency of the DOC is dependent on the exhaust gas temperature, where maximum particle removal takes place at exhaust temperature ranges between 200-350 degrees Celsius (Shukla , Gupta, & Agarwal , 2018).
Diesel particulate filter (DPF) is a flittering process consisting of two steps of filtering and regeneration. During the filtration process, large amounts of soot are continuously collected,
which leads to the pressure difference across the filter and affects engine performance. When the filter is fully saturated then the removal process should occur, which is called the regeneration process (Resitoglu, Altinisik, & Keskin, 2014).
2.3.3 CO2 neutralization approaches
Paul (2014); and Shi, Cui, Deng, Peng, & Chen (2006); and Colin & Allan (2016); and Graver, Frey & Hu (2016) state that since the 1970s most of the regulations have been focused to delaminate the amount of on PM and NOx emissions. Na & Wei (2011) asserts that the
concentration of CO2 has increased on average by 1-2 PPM per year. Zheng, et al. (2014),
illustrate that CO2 is the primary product of a diesel engine and is a greenhouse gas. Agarwal,
Gupta, Shukla, & Dhar (2015) observe that diesel engines release large amounts of CO2 and
steam into the atmosphere which are considered to be unregulated. Johnson (2008) states that the presence of strict emissions regulations that focus on CO2 emissions could reduce CO2
emissions and improve fuel economy. According to Agarwal, Gupta, Shukla, & Dhar (2015), regulation of CO2 is in the process as well on account of its negative effects on the environment.
Jonsson & Bondemark (2017), states that there is some potential technical solution that may
reduce the CO2 emission from the construction equipment such as hybridization and
electrification of the machinery. However, there are some fully developed hybrid excavators and electrified excavators on the market. Fan (2017), describes that by having the lifetime and initial investment cost of construction equipment, more actions are needed in this field to improve the fuel efficiency and reduce the environmental costs. Jonsson & Bondemark (2017) comes with the issue that, operational safety is critical for all of the constructors. Conversely, the contractor is avoiding to invest in new technology. Hence, makes it harder for greener products to manifest itself in the market.
Deng, et al. (2011), denies the character of hydrogen engines during idle as well as lean condition (machine is in motion). The result is based on a simulation program that shows that
the combustion in the presence of low hydrogen leads to less CO2 emissions during both
idle-lean-condition and the engine efficiency is higher in presence of CO2 low hydrogen. Lee, Woo
& Park (2017), denies a similar study for a rail diesel engine, the results emphasize the importance of the pilot-timing as a significant factor in fuel consumption and exhaust emissions of the rail diesel engine.