The mortality cost of particulate matter due to emissions in the Stockholm area : an investigation into harmfulness, sources and the geographical dimension of their impact
40
0
0
Full text
(2)
(3) Publisher:. Publication:. VTI rapport 635A. SE-581 95 Linköping Sweden. Published:. Project code: Dnr:. 2008. 92120. 2004/0416-21. Project:. TESS – Traffic emissions, socioeconomic valuation and socioeconomic measures Author:. Sponsor:. Lena Nerhagen, VTI, Robert Bergström, SMHI, Bertil Forsberg, Umeå Universitet, Christer Johansson and Kristina Eneroth, SLB Analys. The Emissions Research Programme (EMFO). Title:. The mortality cost of particulate matter due to emissions in the Stockholm area– an investigation into harmfulness, sources and the geographical dimension of their impact Abstract (background, aim, method, result) max 200 words:. It has long been recognized that emissions from traffic have a negative impact on human health. In recent years there has been emerging consensus that the main influence is due to particulate matter. From an economic point of view these negative effects are external costs caused by traffic that, if not accounted for in decision making regarding transport, will result in a non-optimal allocation of resources leading to welfare losses. In the Impact pathway approach (IPA), that has been developed in the ExternE projects, the external cost is calculated as the product of exposure, effect and value. In this study the effect we focus on is health impacts (mortality). In TESS project the purpose has been to investigate how important the external health cost of road traffic generated PM is in relation to the cost of other sources of PM. To do this we have both investigated how the exposure varies between sources but also assessed if it is reasonable to assume that the impact differs between PM from different sources. Whether or not to assume that PM of different origin is equally harmful is of particular interest in Sweden where nonexhaust PM makes a large contribution to the concentrations of PM in urban areas. In the project we have used Stockholm as a case study and we have focused on mortality since this is the health impact that has been found to have the largest impact on health cost in other studies. The findings in this report are that there is not an one-to-one correspondence between emissions and costs. The reason for this is that the cost is based on health impacts which in turn are related to population exposure. Combustion PM from road traffic and residential heating gives rise to a higher cost than for example power plants, although the emissions are smaller, since their emissions are released in close proximity to people’s place of residence. Regarding non-exhaust PM (mainly road wear) the estimated cost is lower than that for combustion PM (exhaust emissions) from road traffic. This depends on the use of different exposure-response functions where non-exhaust PM is considered to have less impact on mortality. The results also show that the emissions from the sources in Stockholm also have an influence on the population exposure in the rest of Sweden and in Europe. This is due to the formation of secondary PM from gaseous pollutants, mainly NOx. For power plants this estimated cost is similar to that for the health impacts that occur locally in Stockholm for this source.. Keywords:. External cost, Air pollution, Particulate matter, Road traffic ISSN:. 0347-6030. Language:. No. of pages:. English. 36.
(4) Utgivare:. Publikation:. VTI rapport 635A. 581 95 Linköping. Utgivningsår: Projektnummer:. Dnr:. 2008. 2004/0416-21. 92120. Projektnamn:. TESS – Trafikens emissioner, samhällsekonomisk värdering och samhällsekonomiska åtgärder Författare:. Uppdragsgivare:. Lena Nerhagen, VTI, Robert Bergström, SMHI, Bertil Forsberg, Umeå universitet, Christer Johansson och Kristina Eneroth, SLB Analys. Emissionsforskningsprogrammet (EMFO). Titel:. Kostnaden för dödlighet som partiklar från emissioner i Stockholm orsakar – en studie i hur skadliga olika partiklar är, vilka källorna är och den geografiska dimensionen Referat (bakgrund, syfte, metod, resultat) max 200 ord:. Det är sedan länge väl känt att emissioner från vägtrafik har en negative påverkan på människors hälsa. Den forskning som skett under senare år visar på att den främsta orsaken till detta är de partiklar som emissionerna orsakar. Inom nationalekonomin är denna negativa påverkan på människors hälsa en extern effekt som kommer att leda till beslut som inte är optimala och därmed välfärdsförluster. I Impact Pathway ansatsen (IPA) som utvecklats i de EU-finansierade ExternE-projekten beräknas den externa kostnaden som produkten av exponering, effekten och den ekonomiska värderingen av effekten. I denna rapport är den effekt som vi studerar påverkan på människors hälsa (dödlighet). Syftet med TESSprojektet har varit att studera hur stora vägtrafikens hälsokostnader som orsakas av partiklar är i förhållande till de som orsakas av partiklar från andra källor. För att göra detta har vi undersökt hur befolkningsexponeringen skiljer sig åt mellan olika källor men också om det är rimligt att anta att hälsopåverkan av olika partiklar är densamma. Den senare frågan är av speciellt intresse för situationen i Sverige eftersom partiklar från vägslitage är en viktig orsak till höga partikelhalter i större tätorter. I studien har vi gjort beräkningar för Stockholm och den hälsoeffekt vi studerat är dödsfall eftersom denna effekt i andra studier har visat sig ha störst betydelse för den beräknade kostnaden. Det resultaten visar är att förhållandet mellan emissioner och kostnader inte är ett till ett. Detta beror på att kostnaderna är baserade på de beräknade hälsoeffekterna vilka i sin tur beror på den beräknade befolkningsexponeringen. Förbränningspartiklar från vägtrafik och bostadsuppvärmning ger exempelvis upphov till högre kostnader än energianläggningar, trots att deras emissioner är lägre, eftersom deras utsläpp sker i närheten av bostäder. När det gäller partiklar från vägslitage så är kostnaden lägre än den som orsakas av avgaspartiklar från vägtrafiken. Detta beror framförallt på olika antaganden när det gäller hälsoeffektsambanden där slitagepartiklar antas ha en lägre påverkan på dödligheten. Resultaten visar också att emissionerna i Stockholm även bidrar till att människor i övriga Sverige och i Europa exponeras för partiklar. Orsaken till detta är att det bildas sekundära partiklar av emissioner såsom NOx. För energianläggningar är den kostnad som dessa emissioner orsakar ungefär densamma som de kostnader som denna källa orsakar lokalt i Stockholm.. Nyckelord:. Externa effekter, luftföroreningar, partiklar, vägtrafik ISSN:. 0347-6030. Språk:. Antal sidor:. English. 36.
(5) Preface This is a report resulting from the research project TESS – Traffic emissions, socioeconomic valuation and socioeconomic measures – that has been financed by EMFO (The Emissions Research Programme). In 2002 an agreement about the EMFO programme was reached between the partners from the Swedish Vehicle Research Council, PFF. EMFO was a sector-wide research competence to develop vehicles and vehicle components with emission levels that are sustainable in the long term. The aim of EMFO was to offer academia, industry and authorities access to necessary knowledge and pioneering solutions that are necessary if vehicle technology is to develop in a sustainable direction. One important task has been to coordinate activities within the programme with both national and international research in the field. EMFO comprised subsidiary programmes and two of these were: “Socio-economic evaluation of the health and environmental impact of different emissions” and “Optimal range of socio-economic measures”. TESS undertook research in these two areas but it was also related to the subsidiary programme: “Health and environmental impact”. The application was approved in 2005 and the project took place 2005–2008. The basis for the research in TESS is the valuation methods developed in the EU funded ExternE projects where the external cost of emissions is calculated by tracing the effects that the emissions have on human health and then valuing these effects. The aim of TESS was to calculate the external costs related to particulate matter that local emissions (from road traffic and other sources) generate on a local and regional scale using Stockholm as a case study. Based on this information an analysis was also made on what reduction measures are likely to be efficient from an economic point of view. The analysis undertaken in TESS requires collaboration between researchers from different research disciplines and therefore there were four parties involved in this project. Coordinator for the project has been VTI, where Lena Nerhagen was project leader as well as responsible for the economic analysis. Christer Johansson and Kristina Eneroth at SLB analys (Environment and Health Administration, Stockholm) contributed with information about local emissions and performed exposure calculations for the Stockholm area. Robert Bergström at SMHI performed the regional scale dispersion and exposure modelling. Finally, Bertil Forsberg at Umeå Universiy undertook the health impact assessment. This report presents the results of the valuation part of the TESS project. It is based on the results from the sub-projects undertaken (see references in text) and summaries of these results are presented in the report. In Nerhagen and Li (2008) the results of the cost-effectiveness analysis that has been undertaken within the TESS project are presented. Borlänge December 2008. VTI rapport 635A Cover: photos.com.
(6) Quality review Review seminar was carried on 5th December 2008 in Stockholm where Mats Gustafsson, researcher at VTI, reviewed and commented on the report. Based on these comments and comments from Gunnar Lindberg alterations have been made to the final manuscript of the report. Participants at the seminar were also Gunnar Lindberg, Göran Friberg, Jan-Eric Swärdh, Maud Göthe-Lundgren, Svante Mandell and Anna Mellin. The research director Mats Andersson then examined and approved the report for publication.. Kvalitetsgranskning Rapporten presenterades och granskades på ett seminarium i Stockholm den 5 december 2008 då Mats Gustafsson, forskare på VTI, lämnade synpunkter på rapporten. Vid seminariet deltog även Gunnar Lindberg, Göran Friberg, Jan-Eric Swärdh, Maud GötheLundgren, Svante Mandell och Anna Mellin. Utifrån de kommentarer som Mats Gustafsson lämnade samt synpunkter från Gunnar Lindberg har rapporten justerats och slutligt rapportmanus tagits fram. Forskningschef Mats Andersson har därefter granskat och godkänt publikationen för publicering.. VTI rapport 635A.
(7) Table of contents Summary ............................................................................................................ 5 Sammanfattning ................................................................................................. 7 1 1.1 1.2. Introduction .............................................................................................. 9 Project description ................................................................................... 9 Content of report.................................................................................... 11. 2 2.1 2.2 2.3 2.4. Methods ................................................................................................. 13 The Impact Pathway Approach.............................................................. 13 Dispersion and exposure modeling........................................................ 13 Estimation of health impacts .................................................................. 22 Economic valuation of health impacts.................................................... 25. 3 3.1 3.2. Results and discussion .......................................................................... 27 Health impact and external cost calculation........................................... 27 Discussion and suggestions for further research ................................... 29. References ....................................................................................................... 32. VTI rapport 635A.
(8) VTI rapport 635A.
(9) The mortality cost of particulate matter due to emissions in the Stockholm area – an investigation into harmfulness, sources and the geographical dimension of their impact by Lena Nerhagen, Robert Bergström*, Bertil Forsberg**, Christer Johansson*** and Kristina Eneroth*** VTI (Swedish National Road and Transport Research Institute) SE-581 95 Linköping Sweden. Summary It has long been recognized that emissions from traffic have a negative impact on human health. In recent years there has been emerging consensus that the main influence is due to particulate matter. From an economic point of view these negative effects are external costs caused by traffic that, if not accounted for in decision making regarding transport, will result in a non-optimal allocation of resources leading to welfare losses. To be able to implement road pricing measures, but also for the evaluation of other control measures through benefit-cost analysis, information on the external cost of traffic emissions is needed. In the Impact pathway approach (IPA), that has been developed in the ExternE projects, the external cost is calculated as the product of exposure, effect and value. In this study the effect we focus on is health impacts (mortality). Regarding particulate matter (PM) there is recognition among the research community that there are different types of PM and that it is likely that their impact on human health differs. Still the current practice is to treat fine PM (which are considered to be most detrimental to health) as equally harmful irrespective of origin. In TESS the purpose has been to investigate how important the external health cost of road traffic generated PM is in relation to the cost of other sources of PM. To do this we have both investigated how the exposure varies between sources but also assessed if it is reasonable to assume that the impact differs between PM from different sources. Whether or not to assume that PM of different origin is equally harmful is of particular interest in Sweden where non-exhaust PM makes a large contribution to the concentrations of PM in urban areas. In the project we have used Stockholm as a case study and we have focused on mortality since this is the health impact that has been found to have the largest impact on health cost in other studies. The findings in this report are that there is not an one-to-one correspondence between emissions and costs. The reason for this is that the cost is based on health impacts which in turn are related to population exposure. Combustion PM from road traffic and residential heating gives rise to a higher cost than for example power plants, although the emissions are smaller, since their emissions are released in close proximity to people’s place of residence. Regarding non-exhaust PM (mainly road wear) the estimated cost is lower than that for combustion PM (exhaust emissions) from road traffic. This depends on the use of different exposure-response functions where nonexhaust PM is considered to have less impact on mortality. The results also show that *. SMHI. **. Umeå University. ***. SLB Analys. ***. SLB Analys. VTI rapport 635A. 5.
(10) the emissions from the sources in Stockholm also have an influence on the population exposure in the rest of Sweden and in Europe. This is due to the formation of secondary PM from gaseous pollutants, mainly NOx. For power plants this estimated cost is similar to that for the health impacts that occur locally in Stockholm for this source. These results also have implications for policy. It is concluded that if the purpose is to reduce human mortality more focus should be placed on reducing combustion emissions that contribute to the more dangerous, fine PM. To evaluate policies regarding nonexhaust emissions, more research is needed to clarify their impact on health. The regional impact and the impact on other emissions should also be more in focus in policy evaluations. It is also concluded that for a full picture on health cost of particulate matter there is a need for more research regarding morbidity; what exposure response functions as well as economic values should be used. Finally, all inputs are the result of ongoing empirical research and they are all related to uncertainties, hence the mortality cost that is calculated represents the results of the current state of the art.. 6. VTI rapport 635A.
(11) Kostnaden för dödlighet som partiklar från emissioner i Stockholm orsakar – en studie i hur skadliga olika partiklar är, vilka källorna är och den geografiska dimensionen av Lena Nerhagen, Robert Bergström*, Bertil Forsberg**, Christer Johansson*** och Kristina Eneroth*** VTI 581 95 Linköping. Sammanfattning Det är sedan länge väl känt att emissioner från vägtrafik har en negativ påverkan på människors hälsa. Den forskning som skett under senare år visar på att den främsta orsaken till detta är de partiklar som emissionerna orsakar. Inom nationalekonomin är denna negativa påverkan på människors hälsa en extern effekt som kommer att leda till beslut som inte är optimala och därmed välfärdsförluster. För att utvärdera vilka åtgärder som behövs för att reducera välfärdsförlusterna krävs kunskap om storleken på de externa kostnaderna. I Impact Pathway ansatsen (IPA) som utvecklats i de EUfinansierade ExternE-projekten beräknas den externa kostnaden som produkten av exponering, effekten och den ekonomiska värderingen av effekten. I denna rapport är den effekt som vi studerar påverkan på människors hälsa (dödlighet). När det gäller partiklar så har dessa olika ursprung och olika kemiska sammansättning och de förväntas därför ge upphov till olika påverkan på människors hälsa. Trots det är det antagande som för närvarande används vid hälsoeffektberäkningar att alla partiklar har samma påverkan. Syftet med TESS har varit att studera hur stora vägtrafikens hälsokostnader är i förhållande till dem som orsakas av partikelemissioner från andra källor. För att göra detta har vi undersökt hur befolkningsexponeringen skiljer sig åt mellan olika källor men också om det är rimligt att anta att hälsopåverkan av olika partiklar är densamma. Den senare frågan är av speciellt intresse för situationen i Sverige eftersom partiklar från vägslitage är en viktig orsak till höga partikelhalter i större tätorter. I studien har vi gjort beräkningar för Stockholm och den hälsoeffekt vi studerat är dödsfall eftersom denna effekt i andra studier har visat sig ha störst betydelse för den beräknade kostnaden. Det resultaten visar är att förhållandet mellan emissioner och kostnader inte är ett till ett. Detta beror på att kostnaderna är baserade på de beräknade hälsoeffekterna vilka i sin tur beror på den beräknade befolkningsexponeringen. Förbränningspartiklar från vägtrafik och bostadsuppvärmning ger exempelvis upphov till högre kostnader än energianläggningar, trots att deras emissioner är lägre, eftersom deras utsläpp sker i närheten av bostäder. När det gäller partiklar från vägslitage så är kostnaden lägre än den som orsakas av avgaspartiklar. Detta beror framförallt på olika antaganden när det gäller hälsoeffektsambanden där slitagepartiklar antas ha en lägre påverkan på dödligheten. Resultaten visar också att emissionerna i Stockholm även bidrar till att människor i övriga Sverige och i Europa exponeras för partiklar. Orsaken till detta är att det bildas sekundära partiklar av emissioner såsom NOx. För energianläggningar är den *. SMHI. **. Umeå universitet. ***. SLB Analys. ***. SLB Analys. VTI rapport 635A. 7.
(12) kostnad som dessa emissioner orsakar ungefär densamma som de kostnader som denna källa orsakar lokalt i Stockholm. Dessa resultat har även policy-implikationer. En slutsats är att om man önskar minska den effekt på dödlighet i befolkningen som dessa källor orsakar bör man fokusera på emissionerna från förbränning snarare än slitagepartiklar. När det gäller slitagepartiklar behövs det mer forskning kring hur dessa påverkar dödlighet och sjukdom. Vid utvärdering av olika åtgärder är det också viktigt att ta hänsyn till den regionala påverkan som emissioner bidrar till samt hur olika åtgärder påverkar andra emissioner, t.ex. buller. Dessutom är det önskvärt med mer forskning när det gäller den påverkan på sjukdomar som partiklar ger upphov till – både vilka hälsoeffekterna är och hur dessa ska värderas. Slutligen, alla de delar som dessa beräkningar bygger på är resultaten av empirisk forskning där det fortfarande finns osäkerheter. Detta innebär att den kostnad vi beräknat reflekterar nuvarande kunskapsläge och den kan ändras över tid.. 8. VTI rapport 635A.
(13) 1. Introduction. 1.1. Project description. 1.1.1. Background and purpose. It has long been recognized that emissions from traffic have a negative impact on human health. In latter years there has been emerging consensus that the main influence is due to particulate matter (WHO, 2006). From an economic point of view these negative effects are external costs caused by traffic that, if not accounted for in decision making regarding transport, will result in a non-optimal allocation of resources leading to welfare losses. There are however various measures in place aimed at reducing the negative health impact (i.e. the external costs) of the emissions from traffic. The measures include emission control legislation but also air quality objectives for local concentration levels in urban areas that if exceeded compels the local authorities to take action. Also road pricing measures are increasingly considered as an option since the new information technology has opened up for new technical solutions. One such example is the Stockholm trial where rush hour road pricing was implemented, resulting in reduced traffic to and within the city area and thereby reductions in emissions and concentration levels (Johansson et al., 2008). To be able to implement road pricing measures, but also for the evaluation of other control measures through benefit-cost analysis, information on the external cost of traffic emissions is needed. In the Impact pathway approach (IPA), that has been developed in the ExternE projects, the external cost is calculated as the product of exposure, effect and value (Friedrich and Bickel, 2001). In this study the effect we focus on is health impacts (mortality) but the same approach is also used to calculate the cost for other effects such as crop yield. All inputs are the result of ongoing empirical research and they are all related to uncertainties, hence the external cost that is calculated is not “the” cost. Regarding particulate matter (PM) there is for example recognition among the research community that there are different types of PM and that it is likely that their impact on human health differ. Still the current practice is to treat fine PM (which are considered to be most detrimental to health) as equally harmful irrespective of origin. Hence, there is only one function used for the health impact of fine PM (so called PM2.5). What is mostly measured in urban areas however is the concentration of PM10, which contain both fine and coarse PM, since the air quality guidelines that have been in use up to June 2008 is based on these1. The most important local source of PM10 in many urban areas in Sweden is coarse PM from road wear (Johansson et al., 2007; Norman and Johansson, 2006; Omstedt et al., 2005). In spring, when the roadways are dry, the contribution from road wear PM may be 30 times the direct emissions from the exhaust pipe. These mechanically generated road dust PM are however not considered in calculations of the external cost that is based on the original ExternE-methodology (Friedrich and Bickel, 2001; Bickel and Friedrich, 2005). In TESS the purpose has been to investigate how important the external health cost of traffic generated PM are in relation to the cost of other sources of PM. To do this we have both investigated how the exposure varies between sources but also assessed if it is. 1. The new Directive 2008/50/EC of the European Parliament and of the Council of 21 May 2008 on ambient air quality and cleaner air for Europe, which includes standards for PM2.5, entered into force on 11 June 2008 (http://ec.europa.eu/environment/air/quality/legislation/existing_leg.htm).. VTI rapport 635A. 9.
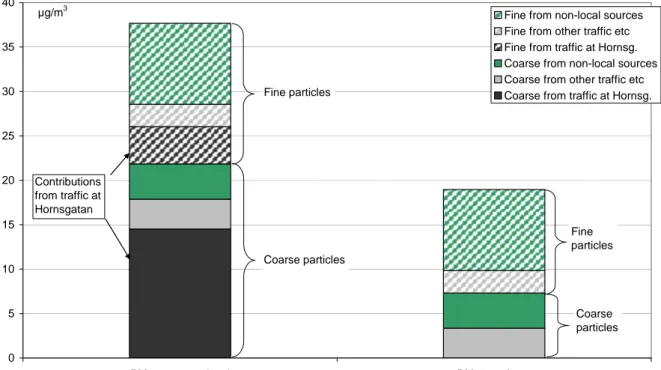
(14) reasonable to assume that the impact differs between PM from different sources. Recent research studies, which in various ways have tried to estimate the separate impact of traffic exhaust emissions on health, have found larger effects than studies using PM2.5 (Forsberg, 2008). One reason for this could be that although the mass concentration of exhaust PM is small the exhaust emissions largely contribute to the number of PM in urban air (Johansson et al., 2007) or that they are much more toxic than the particle fraction that dominate the PM2.5 levels (Schlesinger et al. 2006). Nitrogen oxide concentrations are highly correlated with the number of exhaust PM (Gidhagen et al., 2004; Olivares et al., 2007), therefore NOx or NO2 can be a good indicator for the exposure to particle exhaust emissions. In the present study we have also investigated the influence of local traffic and other sources on a regional scale, for example by studying secondary PM formation due to local emissions of NOx, SO2 and NH3. In the project we have used Stockholm as a case study and we have focused on mortality since this is the health impact that has been found to have the largest impact on health cost in other studies (Bickel et al., 2006; Nerhagen et al., 2005)2. 1.1.2. Particulate matter concentrations in Stockholm – an overview. The measured concentrations of fine PM and PM10 in an urban area is composed of several types of PM. Primary PM such as combustion PM from different sources and non-exhaust PM from road wear are mainly due to local sources while secondary PM, which are formed through chemical transformation of gaseous emissions, to a large extent are transported in from other areas. Therefore it is not possible to assess the actual impact on health from local traffic emissions using measurement data of the total concentrations. The impact of different contributions to the total PM10 concentrations at street canyon and urban background in central Stockholm is illustrated in Figure 1.. 2. As discussed in Nerhagen et al., (2005) there is also less research done on morbidity endpoints and hence less is know both about what exposure-response functions and about what economic values that are relevant to use .. 10. VTI rapport 635A.
(15) 40. µg/m3. 35. 30. Fine particles. Fine from non-local sources Fine from other traffic etc Fine from traffic at Hornsg. Coarse from non-local sources Coarse from other traffic etc Coarse from traffic at Hornsg.. 25. 20. Contributions from traffic at Hornsgatan. 15. Fine particles Coarse particles. 10. 5. Coarse particles. 0 PM10 at street level (Hornsgatan, ca 35 000 veh/day). PM10 roof-top (urban background in central Stockholm). Figure 1 The relationship between the contribution from traffic and other sources to the PM10 concentration at a densely trafficked site (Hornsgatan) and at urban background (a roof-top site) in central Stockholm (annual mean contributions). “Fine” PM refers to PM2.5 and “Coarse” PM to PM10- PM2.5. Source: Johansson and Eneroth, 2007. Hence, in order to undertake analysis of the influence of traffic emissions on human health dispersion models are needed. There is however an additional problem with the current measurement on which Figure 1 is based. If we are only interested in exhaust PM from local traffic, measurements or modelling of PM2.5 are not relevant. This is because exhaust PM consist mainly of ultrafine PM (with diameters <0.1 µm) and hence their contribution to the concentration of PM2.5 is small (Johansson et al., 2007). Therefore, in TESS we will not base the analysis on PM2.5 or PM10 but we will model the contribution of combustion (exhaust) and non-exhaust (road-wear) and secondary PM.. 1.2. Content of report. The Impact pathway approach is a bottom-up approach where the emissions are traced from source to those exposed (Friedrich and Bickel, 2001; Bickel et al., 2006; Muller and Mendelsohn, 2007). Since emission sources in Stockholm contribute to PM10 concentrations both locally and on a regional scale, we have modelled emissions of the combustion process, the contribution from road wear (non-exhaust PM) and also the formation of secondary PM from NOx, SO2 and NH3. Previous research has shown the importance of accounting for the location of the source in relation to those exposed, particularly for traffic and residential heating, since the concentrations decrease rapidly with distance to the source (Nerhagen et al., 2005; Bickel et al., 2006). In this paper we have therefore used high resolution emission- and population data to model the. VTI rapport 635A. 11.
(16) exposure on a local scale. For the regional scale, we have used a relatively high spatial resolution for the area surrounding Stockholm, and a somewhat coarser resolution for other parts of Europe. The emissions sources included in the paper are the energy sector, road traffic, residential heating, and the maritime transport that takes place within Stockholm3. In this paper we deduct the contribution from one emission source at a time to see what impact this has on total concentrations locally and regionally. However, opposite to what is done in for example Muller and Mendelsohn (2007) we reduce the yearly emissions from each source and not the marginal contribution such as one kg or one ton. The main reason for this is that both effect estimates (i.e. the exposure-response functions) and values normally used in the cost calculations are linear relationships and hence do not change with the size of the change in concentration levels (see Bickel et al 2006 for a detailed discussion). In theory the impact and value functions could be dependent on the magnitude of the emission changes and/or the concentration levels, but in practice we do not have such detailed information. The exposure-response functions, for example, are not derived from the impact of marginal changes in concentration levels over a short period of time. Moreover, the meteorology used represents the conditions for a particular period and these conditions vary from year to year. Furthermore, the exposure calculations are based on the concentration levels where people live (official residence addresses) and this will only be an approximation of their true exposure. Finally, although economists are usually interested in the costs resulting from a marginal change in quantity, what is to be considered as marginal in the air pollution context is not strictly defined. The traffic in Stockholm for example only makes a minor contribution to the total NOx emissions in Sweden and Europe and hence reducing them could be considered a marginal change4. The outline of the paper is as follows. In the next chapter we briefly describe the methods and inputs on which the calculations are based and the resulting data that will be used in the cost calculation. In part three we present results of the calculations including sensitivity analysis for some inputs followed by a discussion on what the implications are for policy and further research.. 3. The emission data for shipping only includes part of the shipping that takes place in the Stockholm area (ferries and merchant ships). 4. As long as the assumptions of linearity are correct whether or not we explore the impact of a small change in emissions (a kilo) or a large (several tons) is not of importance. However, for emissions that contribute to the formation of secondary pollutants such as nitrates or ozone the size in emissions may be of importance since these are non-linear relationships. Hence, reducing only one with a small amount can influence the amount of other pollutants in a different way than if the change is large. We however expect this effect to be minor since the amounts we have accounted for in these calculations are relatively small.. 12. VTI rapport 635A.
(17) 2. Methods. 2.1. The Impact Pathway Approach. IPA is a bottom-up approach where the calculated external cost is a function of what influence a certain emission has on human health, and the value of this health impact. The following equation, (which is a modification of an equation in Ostro and Chestnut, 1998), describes the yearly external health cost due to PM from a change in emissions from a specific source: Health cost = ∆yearly exposure · effect · value = (∆PMa;i · POP) · (Ba;j · Pi;j) · Vj. (1). where ∆PMa;i =. change in annual average exposure for pollutant i (µg/m3). POP =. population exposed to ∆PMa;i. Ba;j =. baseline annual health impact rate in population for health impact j (number of cases per inhabitant). Pi;j =. effect on health impact j per µg/m3 of pollutant i (relative risk). Vj =. value of health impact j.. This calculation has to be done separately for each type of PM since the health impacts are likely to differ. The cost calculated for each pollutant and each health endpoint can then be added up to arrive at the total external cost for each source. The determinants of the final cost are the outcome of the exposure calculation, the assumptions in the effect estimation (especially the exposure-response function P) and the value used. In the following, we will discuss each of these inputs and how they have been derived in this paper.. 2.2. Dispersion and exposure modeling. 2.2.1. Emissions and local exposure. This part of the project has been undertaken by SLB analys at the Stockholm Environment and Health Protection Administration. In this part we give an overview of the work done and of the results; details regarding the data and the modelling are given in a separate report (Johansson and Eneroth, 2007). The modelling is based on the Airviro Air Quality Management system (http://airviro.smhi.se)5. SLB analys has been involved in air quality modelling research for many years and the models used in this 5. If the interest is in the contribution of local sources to air pollution measurement data cannot be used since such measurements only capture the total concentration level within a city. Measurements will be influenced by a number of local and regional sources, see discussion in section 1.1.2.. VTI rapport 635A. 13.
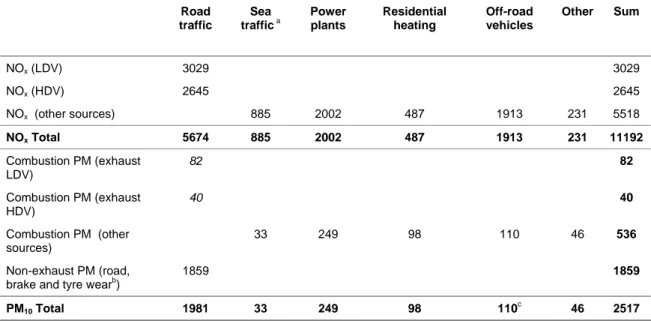
(18) paper have been continually validated against measurements at air quality monitoring stations in Stockholm and Uppsala (a neighbouring city) (Johansson et al., 1999; Eneroth et al., 2006). To be able to calculate the local exposure of air pollutants information about the emissions from each source and the population within Stockholm is needed. Temporally and spatially resolved emissions are available from the emission inventory of the Stockholm and Uppsala Air Quality Management Association (http://www.slb.nu/lvf). Information in this data base has been updated yearly since 1993. All data used in the dispersion modelling is for the year 2003 which was a year with quite normal meteorological conditions. Emissions from road traffic are based on traffic data for separate road links. The road links are classified into 45 different road types depending on signed speed limit, the percentage heavy duty traffic and the temporal variation of the traffic. Emission factors for exhaust emissions from road traffic are obtained from the EVA model of the Swedish Road Administration. Emission factors for non-exhaust PM (mainly road wear but including some contributions from brake wear and tyre wear) were obtained from measurements in a street canyon using NOx as tracer (Ketzel et al., 2007). Emissions from sea traffic as well as energy production are describes as point sources. The emission data for sea traffic includes data on merchant ships and ferries that call at Stockholm ports6. Emissions from energy production plants are updated yearly by the supervisory authorities. The emissions from residential heating are divided into oil-heating and wood combustion, and are described as grid sources (1 x 1 km). The emissions are based on regional fuel statistics from Statistics Sweden7. Information about the distribution of environmental certified and not environmental certified wood boilers – with or without accumulator tanks – is based on the annual report of chimney sweeping 2002. The grid sources are distributed according to population statistics in areas where district heating is missing. The emissions from wood combustion are associated with uncertainties due to limited knowledge about the heating appliances used and their emission factors. In the emission inventory we have also included the emissions from off-road vehicles although they are not included in the final analysis. They have not been included in the final analysis since these are diffuse emission sources and therefore their contribution to exposure is unclear. However, they could be of importance since they make a relatively large contribution to total emissions of combustion PM. Table 1 presents total emissions of NOx and PM in the Greater Stockholm area. Even though we are not interested in NOx as a pollutant, we have included information about these emissions because it is a proxy for the number of PM emitted from different sources, but also because it makes an important contribution to secondary PM8. Road 6. The data on sea traffic has been obtained from the County Administrative Board in Stockholm which in turn have based their estimates on a survey by MariTerm AB and the Institute of Shipping Analysis, ”Kartläggning av Östra Mellansveriges hamnkapacitet – Kartläggning och analys”, 2001 (in Swedish). 7. New values have been included in the emission database in 2006. Regarding PM, these are 1/5 of the previous emission factors while for NOx the new emission factors are slightly higher than those used previously. 8. For the regional scale modeling information on emissions of other pollutants from these sources were also used. The main inputs in the calculations were SOx (40 tonnes from LDV, 2 tonnes from HDV, 182 tonnes from sea traffic, 1642 from power plants and 299 tonnes from residential heating),. 14. VTI rapport 635A.
(19) traffic dominates the emissions of both PM and NOx. Regarding PM, the largest contribution comes from non-exhaust PM. For NOx and combustion PM we have made separate estimations for light duty vehicles9 (LDV) and heavy duty vehicles (HDV). The energy production sector and off-road vehicles are important NOx sources. Table 1 Total emissions (tonnes/year) of NOx and PM from road traffic and other sources in Greater Stockholm area during 2003. Road traffic. Sea a traffic. Power plants. Residential heating. Off-road vehicles. Other. Sum. NOx (LDV). 3029. 3029. NOx (HDV). 2645. 2645. NOx (other sources) NOx Total. 5674. 885. 2002. 487. 1913. 231. 5518. 885. 2002. 487. 1913. 231. 11192. Combustion PM (exhaust LDV). 82. 82. Combustion PM (exhaust HDV). 40. 40. Combustion PM (other sources). 33. Non-exhaust PM (road, b brake and tyre wear ). 1859. PM10 Total. 1981. 249. 98. 110. 46. 536 1859. 33. 249. 98. a. Only emissions from merchant ships and ferries that call at ports are included.. b. Only non-combustion PM with a diameter <10 μm. The size is mainly larger than 1 μm.. c. Only combustion PM due to the use of diesel fuel.. 110. c. 46. 2517. The outcome of the exposure calculation will have an important influence on the calculated cost. We have previously investigated what impact the assumptions regarding the spatial resolution and the population density close to the emissions source will have on the estimated exposure (Nerhagen et al., 2005). Using changes in average concentration levels for larger areas with no account of peoples’ location would underestimate the exposure. Hence, in this study population weighted concentrations were obtained by combining the dispersion calculations with gridded population data. The dispersion calculations were performed with a Gaussian dispersion model, part of the Airviro Air Quality Management system. The model calculation height is 2 m above ground level in open areas, 2 m above roof height over cities. That is, the exposure calculations in this study correspond to roof level concentrations since the exposureresponse functions from epidemiological studies are based on such concentrations. The calculation area covers the Greater Stockholm area (35km x 35 km) with a spatial resolution of 100m x 100 m (122 500 receptor points). The gridded (100 x 100 m) population data was obtained from Statistics Sweden. In 2003, 1 405 600 people lived within the 35km x 35km calculation grid.. NMVOC (6720 tonnes from LDV, 227 tonnes from HDV, 1101 tonnes from sea traffic, 265 tonnes from power plants and 415 tonnes from residential heating) and finally NH3 (371 tonnes from LDV). 9. Included in this category are all vehicles (including cars) smaller than 3.5 tonnes.. VTI rapport 635A. 15.
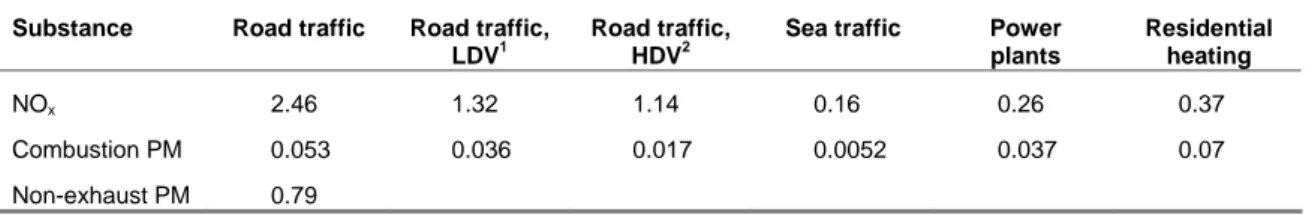
(20) Table 2 shows calculated yearly average concentrations of NOx and PM. These results tell us what impact reductions of different emission sectors would have on the yearly average concentration levels in Stockholm10. Road traffic makes the largest contribution both to the NOx and the PM concentrations. Non-exhaust PM dominates the contribution to the total PM concentration. There is however not a one to one correspondence between changes in emissions and changes in concentrations as the dispersion pattern will depend on where the emissions occur and at what height. For example, changing the emissions from power plants have less influence on local concentration levels in Greater Stockholm since they are emitted at higher altitudes. Therefore, residential heating makes a larger contribution to the NOx concentrations than power plants, although the latter have higher total emissions. The contribution of each source to the total concentrations in the Stockholm area is however relatively small. These concentrations can for example be compared with the rural background concentrations11 for these pollutants which are around 10 µg/m3 for PM10 and 4 µg/m3 for NOx. (e.g. SLB rapport 1:2004; LFV 2008:4). Table 2 Annual mean contributions to the concentrations of NOx and PM for all grid cells from different source sectors in the Greater Stockholm area (μg/m3). Road traffic. Road traffic, 1 LDV. Road traffic, 2 HDV. Sea traffic. Power plants. NOx. 2.46. 1.32. 1.14. 0.16. 0.26. 0.37. Combustion PM. 0.053. 0.036. 0.017. 0.0052. 0.037. 0.07. Non-exhaust PM. 0.79. Substance. 1. LDV = light duty vehicles. 2. HDV = heavy duty vehicles. Residential heating. The population weighted exposure estimates that are the basis for the health impact assessment are presented in Table 3. The simulated concentration in each grid square (100m x 100m) has been multiplied with the grid square population. Hence, sources that cause high concentrations in densely populated areas will get higher estimates in relation to their emissions. For traffic, the population weighted estimates for NOx and PM in Table 3 are about twice as high as the estimates in Table 2, while for sea traffic it is only 20% higher. The latter is due to the fact that sea traffic emissions are located to the east of the most populated areas and that prevailing winds are westerly.. 10. It should be noted that the annual mean contributions to concentrations of NOx and PM include all grid cells in the Greater Stockholm area, i.e. also many grid cells where the contribution from local sources are very small, making the mean of all cells quite small. The maximum contributions are due to traffic emissions and occur in central Stockholm. Here the calculated contributions (at roof level, not street canyons) are around 20 µg/m3 for NOx and 3-5 µg/m3 for PM10.. 11. Rural background concentrations are those that are valid for a large area outside the cities and they are due to both natural and man-made emissions.. 16. VTI rapport 635A.
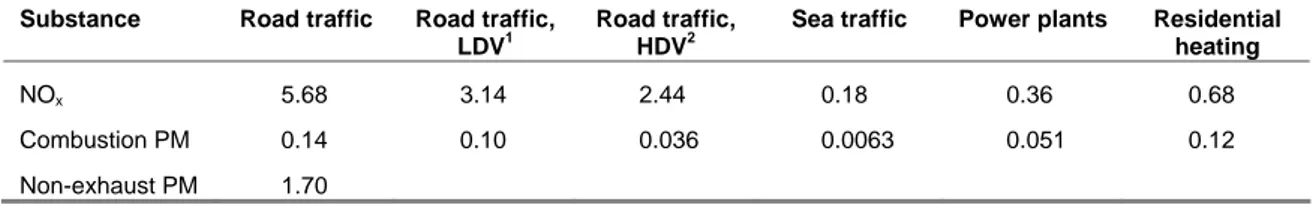
(21) Table 3 Population weighted annual mean concentrations of NOx and PM from different source sectors in the Greater Stockholm area (μg/m3). Road traffic. Road traffic, 1 LDV. Road traffic, 2 HDV. Sea traffic. Power plants. Residential heating. NOx. 5.68. 3.14. 2.44. 0.18. 0.36. 0.68. Combustion PM. 0.14. 0.10. 0.036. 0.0063. 0.051. 0.12. Non-exhaust PM. 1.70. Substance. 1. LDV = light duty vehicles. 2. HDV = heavy duty vehicles. Road traffic is the most important source for human exposure to PM and to NOx. Nonexhaust PM clearly dominates regarding exposure to PM. It can also be concluded that residential heating is an important source for exposure to combustion PM. The reason for the importance of these two sources is that these are emissions that occur in close proximity to where people live. However, the emission data for residential heating is uncertain. In this study we have used new estimates that give 1/5 of the PM-emissions from earlier studies. 2.2.2. Regional impact. The second part of this study, the estimation of the dispersion and exposure on a regional scale, has been undertaken by the Swedish Meterological and Hydrological Institute (SMHI). Details regarding the modelling can be found in Bergström (2008). The MATCH (Multi-scale Atmospheric Transport and Chemistry) model was used for the regional modelling. MATCH has participated in many international studies where different models have been evaluated against observational data and each other (see, e.g., van Loon et al., 2007; Hass et al., 2003). Detailed information about the model can be found in Andersson et al, 2007. Primary PM emitted in Stockholm will, to some extent, be transported out of the city and contribute to the PM levels in the region surrounding the city but also other parts of Europe. In addition, the gaseous NOx, SOx and NH3 emissions also contribute to PM exposure since they are chemically transformed into secondary inorganic PM, that is, particulate nitrate, sulphate and ammonium12. Secondary PM may be more important outside the emission area since it takes some time for it to form. Since primary PM will have a larger influence on the neighbouring region, the model calculations to determine the impact of emissions in Stockholm were performed on two different scales/regions. For impacts closer to Stockholm, a smaller domain was used, with a horizontal resolution of 5 km; this high resolution domain is called the Mälardalen domain. A larger model domain covering most of Europe, with a horizontal resolution of about 44km, was used to study the impacts on a continental scale. The model areas used are illustrated in Figure 2. All calculations were performed for one complete year (meteorology from 2003 was used).. 12. Secondary organic particles were neglected in this study.. VTI rapport 635A. 17.
(22) Figure 2 The modelling domains. Left: The European scale model domain with ca 44km horizontal resolution (each square represents one model grid cell). Right: The High-resolution, “Mälardalen” model domain; the domain is split into 59 × 60 grid cells, with 5km horizontal resolution in the Stockholm region. (Source: Bergström, 2008). Emission data for Stockholm for the regional scale modelling were provided by SLB analys. To describe the chemical evolution of the emissions from Stockholm, and the resulting production of secondary PM, accurate emissions are also needed for the change in other emissions and the total emissions in the rest of Sweden and Europe. For Sweden NOx, SOx, VOC, CO and NH3 emission data from the SMED (Swedish Methodology for Environmental Data, www.smed.se) project, with 1km resolution, were used. For emissions outside Sweden data from EMEP (www.emep.int) were used. EMEP data are provided with a horizontal resolution of 50km. All emission data were regridded to the two different calculation grids used in MATCH. Population data with approximately 1km resolution from the European Environmental Agency (EEA) was used for the EU countries and Croatia (EEA/JRC, 2006). For countries outside EU population data were taken from the Columbia University data base (CIESIN, 2005). Examples of the resulting PM exposure from emissions in Stockholm on the regional scale are shown in Figure 3. The exposures have been calculated as the product of the number of persons in each grid cell and the average concentration resulting from emissions in Stockholm and are expressed in the unit # persons × μg/m3. In the figures the importance of the population density within each grid cell is revealed. The high exposure areas are coloured red in the figure and they coincide with the larger cities. 18. VTI rapport 635A.
(23) within Europe. The emissions from Stockholm contribute somewhat to PM-exposure in most of Europe13.. Figure 3 Yearly average population exposure to PM2.5 (primary PM+secondary inorganic PM) from Light Duty Vehicle (left figure) and Power plants (right figure) in Stockholm. White areas are due to no or low population densities. (Unit:# persons × μg/m3). Source: Bergström, (2008). The final results of the calculations done by SMHI regarding PM are presented in Tables 4–6. Table 4 gives exposure estimates for population within the Stockholm area (that is, the emission area). This also includes results from the local scale modelling by SLB analys. In addition to the primary PM that was accounted for by SLB analys, SMHI has also modelled the contribution from secondary PM (particulate nitrate, sulphate and ammonium) due to the emissions from NOx, SOx and NH3. We find that non-exhaust PM has the largest impact on human exposure within the Stockholm area. However, we find that secondary PM due to the local NOx/SOx/NH3 emissions also has a nonnegligible impact on the local exposure in Stockholm. The relatively high contribution from LDV, compared to HDV, to particulate nitrate is due to fairly large ammonia (NH3) emissions from LDVs with catalytic converters. The NH3 reacts with nitric acid (HNO3) in the city air to form particulate ammonium nitrate. However, we are uncertain. 13. It is to be noted that the information presented in Figure 3 is the population exposure in Europe due to emissions in Stockholm. Hence, the results reflect the combined effect of contribution in concentration and population density. Although westerly winds results in somewhat higher concentrations in for example Finland than the rest of Europe (although this effect is not as large as often assumed) this difference is not seen in Figure 3 due to differences in population density.. VTI rapport 635A. 19.
(24) about this result and think it needs to be verified by more measurements and modelling.14. Residential heating seems to be an important source for exposure to combustion PM but it does not make a large contribution to the formation of secondary PM. Table 4 Population exposure in Greater Stockholm from different PM components (person μg/m3). PM component. Road traffic. Road traffic, a LDV. Road traffic, b HDV. Combustion PM. 191 500. 141 000. 50 500. Non-exhaust PM Secondary PM. d. Total pop. exposure. Sea traffic 9 000. Power plants. Residential c heating. 71 500. 167 000. 2 190 000 117 000. 115 500. 1 500. 12 000. 11 500. 28 500. 2 190 000. 256 500. 52 000. 21 000. 83 000. 195 500. a. LDV = light duty vehicles. b. HDV = heavy duty vehicles. c. The combustion PM and NOx emissions from residential heating are very uncertain which means that the population exposure values for this sector are uncertain as well. d. This is the exposure due to particulate nitrate, particulate sulphate and particulate ammonium. Of these, particulate nitrate in in most cases makes the largest contribution to population exposure. For details see Bergström (2008).. Table 5 contains the modelling results for the Mälardalen region (excluding the studied emission area of Stockholm). The population in this region was about 2 160 000 people. As seen from the table, the influence from the emissions in Stockholm on exposure is much lower in this area. This is due to two main factors, lower concentration levels and lower population densities. As for the Greater Stockholm area, non-exhaust PM gives rise to the largest exposure. Table 5 Population exposure in Mälardalen from different PM components (person μg/m3). PM component. Road traffic. Combustion PM Non-exhaust PM Secondary PM Total pop. exposure. 7 500. Road traffic, a LDV. Road traffic, b HDV. Sea traffic. Power plants. Residential c heating. 5 000. 2 500. 4 500. 2 000. 6 000. 15 000. 12 500. 2 500. 2 000. 5 500. 2 500. 196 000. 17 500. 5 000. 6 500. 7 500. 8 500. 196 000. d. a. LDV = light duty vehicles. b. HDV = heavy duty vehicles. c. The combustion PM and NOx emissions from residential heating are uncertain which means that the population exposure values for this sector are uncertain as well. d. This is the exposure due to particulate nitrate, particulate sulphate and particulate ammonium. Of these, particulate nitrate in most cases makes the largest contribution to population exposure. For details see Bergström, 2008.. 14. This is a somewhat unexpected result and we have tried to verify these results with measurement data. The latter indicates that local traffic makes a small contribution to particulate ammonium nitrate. However, since this is a pollutant taking part in chemical processes it is more problematic to capture the contribution through measurements. Hence, further research is needed in order to clarify what the actual contribution from traffic is likely to be.. 20. VTI rapport 635A.
(25) Table 6, finally, contains the estimated exposure for the rest of Europe. Although the contribution to the concentration levels on the continent of emissions from the Stockholm area is small, the estimated exposure is large when compared to population exposure in Greater Stockholm and Mälardalen, due to the number of people exposed. In this case however, the most important contribution to exposure is due to secondary PM (where particulate nitrate makes the largest contribution). For many of the sources, the total exposure on this scale is even higher than the exposure within Greater Stockholm (see Table 4). For residential heating however the impact on this scale is relatively small which is due to relatively small NOx -emissions. We also find that nonexhaust PM also has an impact on this scale. Hence policy measures, such as road charging, that reduce emissions locally in the Stockholm area will have an important impact on human health in other parts of Europe. Table 6 Population exposure in the rest of Europe from different PM components (person μg/m3). PM component. Road traffic. Combustion PM Non-exhaust PM Secondary PM. d. Total pop. exposure. 6 000. Road traffic, a LDV. Road traffic, b HDV. Sea traffic. Power plants. Residential c heating. 4 000. 2 000. 3 500. 13 000. 4 700. 300 000. 187 000. 113 000. 56 500. 176 000. 39 000. 133 000. 191 000. 115 000. 60 000. 189 000. 43 000. 133 000. a. LDV = light duty vehicles. b. HDV = heavy duty vehicles. c. The combustion PM and NOx emissions from residential heating are uncertain which means that the population exposure values for this sector are uncertain as well.. d. This is the exposure due to particulate nitrate, particulate sulphate and particulate ammonium. Of these, particulate nitrate in most cases makes the largest contribution to population exposure. For details see Bergström, 2008.. A summary of these results is presented in Figure 4. As seen in the figure non-exhaust PM from road traffic (mainly road wear and dust) have the largest influence on human exposure. This is due to the large amount of emissions. The PM exposure of the other sources is due the burning of fuels. In the figure it is seen how much exposure is due to combustion PM (primary emitted PM) and how much is due to secondary PM. The latter mainly has an influence on populations outside of Stockholm. While road traffic LDV and residential heating are important sources for exposure to combustion PM locally, the main influence of the other sources is in the rest of Europe. (According to this figure road traffic LDV also make a large contribution to exposure to secondary PM but as mentioned previously, this is a result that needs to be investigated further.) This figure however does not reflect the relative harm done by each pollutant since they are expected to have different health impacts. Hence, as will be shown in the next section, non-exhaust PM is not likely to have such a large impact on mortality as this figure might suggest.. VTI rapport 635A. 21.
(26) 3000000,00. Population exposure (ug/m3). 2500000,00. 2000000,00. Secondary PM Non-exhaust PM Combustion PM. 1500000,00. 1000000,00. 500000,00. 0,00 Road traffic. Road traffic, LDV. Road traffic, HDV. Sea traffic. Power plants. Residential heating. Emission source. Figure 4 Total population exposure in Europe due to PM from emission sources in Stockholm (person μg/m3).. 2.3. Estimation of health impacts. 2.3.1. Methodology. The second step in the IPA is the health impact estimation that, according to equation 1, is composed of two parts; a baseline estimate and an exposure-response estimate. The inputs used in these calculations are mainly obtained from epidemiological studies. They have, to some extent, been validated by toxicological studies. Both mortality and morbidity effects have been assessed in different studies. The World Health Organization (WHO) repeatedly reviews the current level of knowledge and issues Air Quality Guidelines for different pollutants and also relevant exposure-response (ER) functions. These are general estimates (not country-specific). For mortality there is a distinction made between deaths that will occur due to long-term exposure (chronic mortality) and those that occur directly after exposure (acute mortality). If both of these relationships have been found for the same pollutant, there is a risk of double counting and hence it is often assumed that the acute cases are accounted for in the calculation of chronic mortality (Friedrich and Bickel, 2001; Bickel et al., 2006; Muller and Mendelsohn, 2007). The health effect baseline incidences are the number of health events per year per unit of population. These estimates are impact- and country-specific. To arrive at relevant baseline and ER-functions to be used in this study, Forsberg (2008) has undertaken a literature survey of peer-reviewed studies. Since most external cost studies have found that mortality effects give rise to the highest costs, we have focused on such studies. The current WHO guidelines contain an exposure-response function for PM2.5 assuming a long-term effect on mortality of 1.06 (6%) for a 10 μg/m3 increment of average concentration levels at roof level. No threshold effect is assumed. It is also stated that the same ER-function should be used for the finer fraction irrespective of. 22. VTI rapport 635A.
(27) origin; hence it is assumed that different PM components are equally harmful. This is also the ER-function used in most assessments, such as the Clean Air for Europe (CAFE) calculations. Regarding the coarser fraction (PM10-2.5), these have not been included in the ExternE Methodology Update 2005 (Bickel and Friedrich, 2005). There is however an ongoing discussion among the research community of whether or not it is correct to assume that all PM have the same impact irrespective of origin or size. Hence, there is research undertaken that tries to assess the health impact of different PM components. The epidemiological studies from which ER-functions are obtained have mainly focused on short-term effects of exposure. Up to now there have only been a few cohort studies (with panel data) from which long-term effects can be assessed. Therefore, although the long-term effects may be dominant, the results from short-term effect studies can give useful indications of differences in harmfulness between different PM components. Another problem with epidemiological studies is that they build on measured mass concentration of PM10 or PM2.5, both influenced by several sources. Therefore, so-called indicator variables have been used in recent studies to assess the influence of local sources such as traffic. In the traffic environment NOx has been found to be highly correlated with the number of exhaust PM and have therefore been used as and indicator of combustion PM from traffic in some studies. Moreover, studies based on within-city gradients of PM have been used to try to exclude the impact of interurban differences in PM composition. Another issue concerning the health impact assessment, which is of importance for external cost calculations of mortality impacts, is in what ”unit” the calculation is done. In epidemiological studies it is common to assess the number of cases or the number of deaths in a population. However, for the economic assessment the number of years lost due to the health impact is of importance. For results from cohort studies this information can be obtained by studying the mortality or survival in different ages. Calculations of potential years of life lost (YOLL) are done with known life table, usually assuming that the relative risk per unit increase in exposure affects the mortality in every age class in a population in the same way. This way the potential years of life lost due to excess mortality from the population exposure can be given per calculated excess death or divided by the number of persons in the population as a mean value. The same approach can however not be used for the results from time-series studies. Here the estimates used are rather based on the condition of people who have died from the health conditions that are caused by air pollution. 2.3.2. Baseline and ER-functions used15. In this project we do not apply different baseline rates for different cities, regions or countries. The reasons for this are that the exposure calculation does not make a separation between different regions or countries and nor do we want the mortality effects to be modified by recent mortality rates. Therefore, the baseline mortality rate used in the study is the one relevant for Sweden of 1010 deaths per year from nonexternal causes per 100 000 persons. This estimate is obtained from The Swedish Board of Health and Welfare (register unit EpC). Moreover, although it is assumed in some studies that no deaths occur among those younger than a certain age (often 30 years), we. 15. For a detailed discussion and references, see Forsberg (2008).. VTI rapport 635A. 23.
(28) have not made that assumption. This is because there are some studies pointing at an impact on infant mortality and also because inclusion of the younger age groups only has marginal impact on the estimated results. The studied literature indicates indeed that there are differences in the harmfulness between different PM components. Several studies suggest that vehicle exhaust and other combustion PM are strongly related to mortality. Also concentrations of secondary PM, especially sulphate, are statistically important for mortality according to American cohort studies. Moreover, the studies based on within-city gradients of PM, seem to find a higher relative risk per concentration unit of combustion PM (or the indicator variable). A study that used data from the American Cancer Society (ACS) gives a relative risk of 17% per 10 μg/m3 PM2.5 (Jerret et al., 2005). Our conclusion is that this is, especially for combustion PM, a realistic alternative in a sensitivity analysis to the 6% per 10 μg/m3 suggested by WHO. Regarding nitrate there are few studies done on this pollutant. Since it is unknown what exactly the harmful component in secondary PM is, we have chosen to treat nitrate as equally harmful as sulphate, and hence use the ER-function suggested by WHO for PM2.5. An alternative assumption is to assume half this effect, as suggested for example in the most recent ExternE recommendation (2005). In our calculations we have also included ammonium nitrate since this pollutant is always found in measurements of secondary inorganic aerosols. Regarding non-exhaust PM, there is little support from cohort studies of an effect on mortality. In time-series studies a short-term effect on daily mortality has been found but it is usually more strongly related to finer PM. In line with these findings preliminary results from another research-project undertaken in Stockholm (TRAPART) indicate non-significant short-term effect on mortality from road wear16. Thus non-exhaust PM may be seen as having no effect on mortality. We have therefore decided to assume, as a higher estimate, that non-exhaust PM have the same short-term effect on mortality as PM10 in general. Since studies such as APHEA-2 (Zanobetti et al., 2002) have shown that the short-term effect in fact lasts over several weeks, we chose as upper estimate to assume a cumulative effect of 1% increase in all cause non-external mortality per 10 μg/m3 and as a lower bound no impact on mortality. The latter however is an underestimate of the effect of this pollutant since it is known that they worsen the conditions for persons with respiratory illnesses and other morbidity endpoints. Still we have chosen not to include morbidity endpoints because both exposure-response functions and values are uncertain. The relative increase in mortality per unit increase in exposure from cohort studies can be assumed to effect mortality in every age class in the population in the same way with a known life table. The potential years of life lost (YOLL) due to excess mortality can then be calculated per excess death or divided by the number of persons in the population to have a mean value for the whole population. We found for Stockholm that every excess death due to long-term effects of PM corresponds to 11.2 YOLL. Timeseries studies do not give any information on how much each excess death is brought forward. Therefore we have used the same assumption as in the CAFE calculations for short-term effects on mortality of PM10, 1 YOLL (a reasonable range for this estimate is from 6 to 18 months).. 16. However, chance cannot be excluded as causing this result. If the time-series had been larger and the effect stayed the same, it would become statistically significant.. 24. VTI rapport 635A.
(29) 2.4. Economic valuation of health impacts. 2.4.1. Methodology. The final input into the external cost calculation in equation 1 is the economic values placed on the estimated health impacts. Values used in these types of calculations usually have two components; the costs related to illness (medical treatment and lost production) and the value placed on the loss of welfare of being ill. While the former information can be obtained from register data, so called valuation studies are used for the latter. These are of two kinds, revealed preference studies that rely on observed behaviour and stated preference studies that use responses to hypothetical questions. There are a number of issues discussed in relation to this type of valuation. It is for example acknowledged that the valuation of small changes in risk is one of the most challenging. Up to now there has also been a focus on the valuation of accident risk. Hence, more research is needed on what are the relevant estimates to be used in this context. More detailed discussions on the valuation of changes in risk can be found in Carson et al., (2001) and Andersson and Treich, (2008). The theoretical basis for this type of analysis is that people are willing to trade money for reductions of risks and that this “willingness to pay” will be an approximation for the utility that is lost when in a state of bad health. The research undertaken in this area has mainly focused on obtaining values for the reduction of mortality risks. By dividing the willingness to pay for a risk reduction by the change in the probability of death, the value of a statistical life (VSL) is obtained. Hence, if the change in the risk of dying is 5/100 000 and the stated willingness to pay is 50 euro then the VSL is equal to 1 million euro (Boardman et al., 2006). A particular problem for the cost calculations discussed in this paper is that most studies concerning VSL come from studies of working age people and hence apply to cases where several years of life are assumed to be lost. Since air pollution mainly have an impact on elderly, it has been questioned if the VSL should be applied uniformly to people of all ages or whether the VSL should be differentiated by age. In the ExternE Methodology report (Bickel and Friedrich, 2005) this issue is discussed at length. Previously the values used were obtained from available literature, such as estimates from the valuation of fatal transport accidents. These estimates were then adapted to account for the length of lifetime lost by changing the metric from VSL to the VOLY (value of life year lost) by annuity calculation. However, since this transfer rests on a number of questionable assumptions, a study was undertaken that account for both the air pollution context and the influence of years of life lost. It is a study that uses a survey instrument that has been used in previous American and Canadian studies (Alberini et al., 2004a) and that is based on the contingent valuation method17. 2.4.2. Economic values used. In this study we have decided to apply the estimates suggested by Bickel and Friedrich (2005) since they are similar to those used in the cost-benefit analysis in CAFE (AEA 17. The conclusion to rely on VOLY is however not without critiques. Krupnick (2004) in a peer review of the methodology to be used in the cost-benefit analysis in CAFE questioned this and therefore the final work included both VSL and VOLY estimates. Hammit (2007) on the other hand states that a change in survival probabilities can be estimated by either estimate but that due care needs to be taken to other factors that influence these estimates (state of health, income etc.).. VTI rapport 635A. 25.
(30) Technology, 2005). We use these estimates since no studies in Sweden have tried to estimate VOLY. The result from the valuation study undertaken within ExternE was a mean VSL of 2.258 million euro and a median estimate of 1.052 million euro (Alberini et al., 2004b). The change in risk on which this estimate is based was a 5/1000 reduction in the risk of dying during the next ten years (hence 5/10 000 reduction in risk of dying). The study was undertaken in three countries and the estimates differ between countries. The estimates are also associated with income, sex, education, old age and previous health record. A VOLY estimate was obtained by conversion where each respondent’s WTP was divided by that respondent’s life expectancy extension that would result from the 5/10000 change in risk. The calculation of life expectancy extension was based on life table methods as suggested by Rabl (2002). The result of this recalculation was a mean estimate of 125 250 euro and a median estimate of 55 800 euro (price year 2003). The final recommendation is, contrary to previous Externe studies and other valuation studies, to use the median estimate, adjusted down to 50 000 euro, because this was the estimate was unaffected by distributional assumptions. This is assumed to be a correct estimate for chronic mortality and the undiscounted estimate to be used for acute mortality is 75 000 euro, using a discount rate of 3% (Bickel and Friedrich, 2005)18. In Sweden only VSL-values have been used in policy evaluations. It is the Swedish Institute for Communication Analysis (SIKA) that suggests values to be used in infrastructure planning. In the latest revision (SIKA, 2008), a mean value of SEK 22.3 million was suggested for VSL based on recent Swedish research (price level 2006). This is approximately equal to 2.4 million euro, hence about the same size as the mean VSL estimate obtained in the ExternE study. However, this is an estimate for traffic safety where on average approximately 38 years are lost (SIKA). Based on this information we can estimate an approximate VOLY for Sweden using annuity calculation: VOLY=(VSL*(1+r)t*r) / ((1+r)t-1).. (2). The result is about 100 000 euro (using a discount rate of 4%) which is a higher VOLY than the median estimate recommended in ExternE (Bickel and Friedrich, 2005). Hence, the values we use in this study are conservative estimates and can be seen as a lower bound. However, we think more research is needed in order to determine what a reasonable value in this health context is. VSL studies in Sweden looking at private traffic safety devices have for example found much higher VSL estimates19.. 18. These median estimates are lower than those previously used in ExternE-projects (that were based on mean VSL estimates from other studies). In the UNITE project VOLY for acute mortality 131 400 euro and VOLY chronic was 76 400 euro (Nellthorpe et al., 2001).. 19. According to economic theory VSL estimates for public projects should be higher than for private safety since the former encompass many more individuals. Swedish studies have however found the opposite result. One possible explanation for this is that since most health care in Sweden is paid for through taxes, people think that government should pay for important safety enhancing projects using funds collected by the existing taxes. This and other aspects regarding the valuation of health risks are investigated in an ongoing research project VASSLA at Örebro University.. 26. VTI rapport 635A.
Figure
Related documents
46 Konkreta exempel skulle kunna vara främjandeinsatser för affärsänglar/affärsängelnätverk, skapa arenor där aktörer från utbuds- och efterfrågesidan kan mötas eller
För att uppskatta den totala effekten av reformerna måste dock hänsyn tas till såväl samt- liga priseffekter som sammansättningseffekter, till följd av ökad försäljningsandel
Samtliga regioner tycker sig i hög eller mycket hög utsträckning ha möjlighet att bidra till en stärkt regional kompetensförsörjning och uppskattar att de fått uppdraget
The increasing availability of data and attention to services has increased the understanding of the contribution of services to innovation and productivity in
Generella styrmedel kan ha varit mindre verksamma än man har trott De generella styrmedlen, till skillnad från de specifika styrmedlen, har kommit att användas i större
Närmare 90 procent av de statliga medlen (intäkter och utgifter) för näringslivets klimatomställning går till generella styrmedel, det vill säga styrmedel som påverkar
• Utbildningsnivåerna i Sveriges FA-regioner varierar kraftigt. I Stockholm har 46 procent av de sysselsatta eftergymnasial utbildning, medan samma andel i Dorotea endast
The EU exports of waste abroad have negative environmental and public health consequences in the countries of destination, while resources for the circular economy.. domestically
