School of Sustainable Development of Society and Technology
Evaluation of Building Integrated Heating
System in Terms of Thermal Comfort &
Energy Efficiency
A Case Study of Multistory Apartment Buildings in Kumla
MASTERS THESIS “ENERGY OPTIMIZATION FOR BUILDINGS” 15 HP, ADVANCED LEVEL WBT 031
Author(s): Aber Alvi & Harris Farooq Qureshi Vasteras, 20th June 2011 Company Contact: Andreas Anderzon
1
Abstract
This work comprises of a detail study of the impact of building integrated heating (BIH) systems on energy efficiency and thermal comfort. The work has been sponsored by a company called Thermotech AB which supplied the BIH system for twin apartment buildings in Kumla owned by Kumla Bostäder.
Comprehensive energy analysis was done using IDA simulation software for the building with normal radiator heating and BIH heating systems. The analysis showed 7.5 % annual savings in favor of the BIH system but since the ground and first floor thermostatic set point was not achieved we are a bit skeptical about the actual savings. Detailed literature study in this regard showed that there was no significant difference in the energy consumption for both of the systems.
In the case of thermal comfort there are many citations preferring the integrated heating with features like better comfort, air quality, less noisy system ,flexible room layout and ability to use a sustainable source such as solar power.
Simulations for thermal comfort were unable to determine any significant betterment of one system over the other as both were theoretically able to deliver the same comfort. Actual measurements however showed extremely good PPD % values during a hot summer day. Unfortunately a winter measurement could not be taken due to time constraint but is a strong recommendation for further work.
A detailed survey was also conducted to gauge the people’s reaction on the system during the past winter. While most of the people were satisfied average PMV of around 0.5, people from lower floors did complain about it being too cold during the winter. Some complained about it being too warm during summer time which is understandable as there no external shades and the ventilation system runs at constant speed. Some people had complains about the air quality and lack of ventilation as well.
In conclusion the system’s superior thermal comfort over the conventional radiator circuit cannot be denied but its energy efficiency features may be up for debate.
We recommend the system in spite of the additional cost due to the comfort for the occupants and the fact that it utilizes a low temperature source which is much more sustainable and environment friendly then the conventional high temperature sources.
Keywords:
Building Integrated Heating, Energy Efficiency, IDA Simulations, Sustainability, Thermal Comfort Meter, Thermal Comfort Survey.2
Preface
This report comprises of an extensive study done on the influence of “Building Integrated Heating Systems on thermal indoor climate & Energy consumption”.
This report is part of degree requirement of Masters program in “Energy Optimization for Buildings” which comes under “School of Sustainable Development of Society & Technology” (HST); Mälardalen University, Sweden.
The degree project was conceived by Andreas Anderzon of Thermotech to investigate their product “BIH System” after one complete winter season.
3
Acknowledgement
All praises be to Almighty Allah for showering us with numerous uncountable blessings. Our parents who have been a source of strength for us, their ever enduring love and affection have enriched our lives; their guidance has always been and will continue to be an invaluable asset.
We would like to express our gratitude towards Andreas Anderzon of Thermotech Scandinavia AB for considering us for this project and supporting us all the way through. Very special thanks to Ellen-Ann Eriksson for helping us out in conducting the survey.
We would also like to thank Lars Hallbergson of Kumla Bostäder for his co-operation during the housing survey and providing us with unhindered access.
Our supervisor Robert Oman’s guidance and advices have been priceless and we are exceedingly grateful to him, and not to mention Gustaf Brunnberg our classmate, for helping us in translating the survey from English to Swedish.
Last but not the least we would like to thank all our teachers throughout our lives, each of them in their own respective capacities has contributed immensely towards our success.
4
Table of Contents
Abstract 1 Preface 2 Acknowledgement 3 Summary 8 Scope, Limitation & Methodology 9 Project Plan 10 Literature Review 11 i. History of Radiant Conditioning ... 11ii. Conceptual Description ... 11
iii. Hydronic systems ... 11
iv. Primary benefits of the Radiant Heating System ... 13
v. Disadvantages of the Radiant Heating System ... 15
vi. Where should one install a Radiant Heating System? ... 16
vii. Exergy in context of Low temperature heating ... 16
viii. Occupants experiences on Low temperature heating ... 17
ix. Conclusion ... 17
Thermotech’s Building Integrated Heating 19 i. Company Overview ... 19
ii. Product Description ... 19
iii. Kumla Apartments ... 19
Energy Simulations Via IDA Software 22 i. Basic Inputs for Energy Analysis ... 22
ii. Zoning Details and Inputs ... 26
iii. Floor Plans & 3d Model: ... 29
iv. Results of the Energy Analysis ... 30
a. Delivered Energy Report For Floor Heating ... 31
Building Comfort Reference ... 31
Delivered Energy Overview ... 31
Monthly Delivered Energy ... 32
b. Delivered Energy Report For Radiator Heating ... 32
Building Comfort Reference ... 32
5
Monthly Delivered Energy ... 33
v. Evaluating the Integrity of the model ... 34
vi. Analysis of the Energy Simulation Reports ... 37
a. Floor Heating Vs Radiator Heating (Energy Wise) ... 37
b. Floor Heating Vs Radiator Heating (Thermal Comfort)... 38
vii. Ground Level Heat Loss ... 40
Thermal Comfort 42 i. Local Thermal Discomfort Factors... 44
ii. Basic Definitions ... 44
iii. ASHRAE Thermal Sensation Scale ... 45
iv. Input Parameters for Personal Factors ... 46
Thermal Comfort Measurements 47 i. Instrument & Software Setup ... 47
ii. Sensor Locations over the house ... 47
iii. Measurements for the Kumla Buildings ... 48
a. Location 1 (Kitchen Area) ... 48
b. Location 2 (Living Area) ... 48
c. Location 3 (Central Area)... 49
d. Location 4 (Sov)... 50
e. Location 5 (Master Sov) ... 50
iv. Results ... 51
Thermal Comfort Survey 52 i. Results... 58
Conclusion 59 References 61 Appendix A 63 i. Data Provided by Projektengagemang ... 63
Appendix B 64 i. Thermal Comfort Survey Form: ... 64
6
Table of Figures
Figure 1: Project Timeline with Major Tasks (Microsoft Project 2010) ... 10
Figure 2: Under floor heating pipes, before they are covered by the screed ... 12
Figure 3: Simplified schematic for a Radiant based HVAC system (Source Healthy Heating) 18 Figure 4: Default Construction Values (Source Projektengagemang) ... 22
Figure 5: Site Shading (Source Google Maps)... 23
Figure 6: Thermal Bridges (Source IDA Default Values) ... 23
Figure 7: Infiltration Source Öman (1991) ... 24
Figure 8: Hot water & System Losses ... 24
Figure 9: FTX System Source (FTX Spec Sheet Appendix A) ... 25
Figure 10: Plant Setup Source (Projektengagemang) ... 25
Figure 11: Zone 1 Case 1 ... 26
Figure 12: Zone 1 Case 2 ... 26
Figure 13: Occupant Loads & Schedules ... 27
Figure 14: Lighting Loads & Schedules ... 28
Figure 15: Equipment Loads & Schedules ... 28
Figure 16: Window Schedule ... 29
Figure 17: Floor Plans (Ground Floor) Kumla Apartments ... 29
Figure 18: 3d Plans Kumla Apartments ... 30
Figure 19: Simulated VS Measured Values (Kumla Bostäder & IDA Simulation) ... 35
Figure 20: Simulated VS Measured Values (Kumla Bostäder & IDA Simulation) ... 36
Figure 21: Main Temperatures Zone 5 BIH Heating. ... 39
Figure 22: Thermal Comfort Zone 5 BIH Heating (Adjustable Clothing 0.85±0.45 Clo)... 39
7
Figure 24: Minimum Operative Temperatures for each zone. ... 41
Figure 25: Thermal comfort conditions, Source ASHRAE 55-2004 ... 43
Figure 26: Graph showing the optimal thermal conditions, based on ISO 7730 and ASHRAE STD 55, Clothing values of 0.5 to 1.0 clo and PMV limits of 0.5.Source ASHRAE 55-2004 ... 43
Figure 27: ASHRAE Thermal Sensation Scale ... 45
Figure 28: Shows the location of the sensors depicted by red marked X’s ... 47
Figure 29: Variation of operative temperature in kitchen area ... 48
Figure 30: Variation of operative temperature in living area ... 49
Figure 31: Variation of operative temperature in central area ... 49
Figure 32: Variation of operative temperature in small bedroom ... 50
Figure 33: Variation of operative temperature in master bedroom ... 51
Figure 34: Distribution of votes for satisfaction with overall thermal comfort ... 53
Figure 35: Distribution of votes for satisfaction with thermal comfort in hot weather... 54
Figure 36: Distribution of votes for satisfaction with thermal comfort in cold weather ... 55
Figure 37: Distribution of votes for satisfaction of overall air quality ... 56
Figure 38: Distribution of votes for whether air quality enhances or interferes with productivity. ... 57
8
Summary
This work comprises of a detail study of the impact of building integrated heating (BIH) systems on energy efficiency and thermal comfort. The work has been sponsored by a company called Thermotech AB which supplied the BIH system for twin apartment buildings in Kumla owned by Kumla Bostäder.
Comprehensive energy analysis was done using IDA simulation software for the building with normal radiator heating and BIH heating systems. The analysis showed 7.5 % annual savings in favor of the BIH system but since the ground and first floor thermostatic set point was not achieved we are a bit skeptical about the actual savings. Detailed literature study in this regard showed that there was no significant difference in the energy consumption for both of the systems.
In the case of thermal comfort there are many citations preferring the integrated heating with features like better comfort, air quality, less noisy system ,flexible room layout and ability to use a sustainable source such as solar power.
Simulations for thermal comfort were unable to determine any significant betterment of one system over the other as both were theoretically able to deliver the same comfort. Actual measurements however showed extremely good PPD % values during a hot summer day. Unfortunately a winter measurement could not be taken due to time constraint but is a strong recommendation for further work.
A detailed survey was also conducted to gauge the people’s reaction on the system during the past winter. While most of the people were satisfied average PMV of around 0.5, people from lower floors did complain about it being too cold during the winter. Some complained about it being too warm during summer time which is understandable as there no external shades and the ventilation system runs at constant speed. Some people had complains about the air quality and lack of ventilation as well.
In conclusion the system’s superior thermal comfort over the conventional radiator circuit cannot be denied but its energy efficiency features may be up for debate.
We recommend the system in spite of the additional cost due to the comfort for the occupants and the fact that it utilizes a low temperature source which is much more sustainable and environment friendly than the conventional high temperature sources.
9
Scope, Limitation & Methodology
The scope of this study is to evaluate the BIH (Building Integrated Heating) System installed by a company called Thermotech at twin apartment buildings in Kumla owned by Kumla Bostäder. The apartments are newly built and the heating system has been in operation for one complete winter season (2010-2011).
As the scope of this project can be very huge, from the physical system (Materials, Sizing Equipment etc), Parameters (Flow Rates, Controllability etc) to Measuring end user comfort level (Thermal Comfort). For the purpose of a Master’s Thesis this scope needed to be shortened.
The general idea therefore in consultation with Thermotech was to gauge the system from the user’s perspective in terms of thermal comfort and from the owner’s perspective exploring whether or not he had benefited by adopting hydronic low temperature floor heating instead of traditional radiator heating.
A three prong analysis was the solution.
Firstly, Energy modeling of the building was done in IDA .There were two reasons for this firstly it would allow us to compare floor heating vs. radiator heating in a simulated environment and secondly it would provide us with Thermal comfort ranges which can be evaluated against standard norms.
Secondly, detailed measurement by a Thermal Comfort Meter to determine specific regions of discomfort and get actual data about the building.
Thirdly, a comprehensive thermal comfort housing survey was carried out, utilizing the residents as tools of measurement to getting their feedback in standard forms which could then be compared with the simulated and measured values.
10
Project Plan
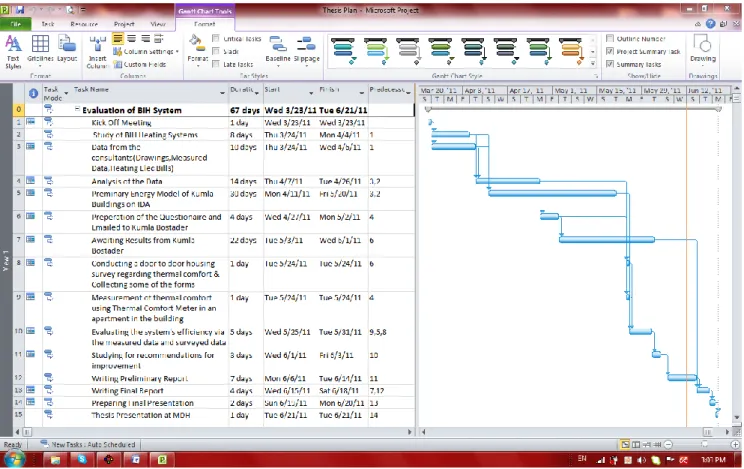
After the initial discussion with Thermotech a detail project timeline was developed so that the progress can tracked and the project can be completed within the stipulated timeframe. The Gantt chart below shows the main tasks and their start and end days and also the predecessor tasks required to initiate the desired task. It is a tool widely used in Project Management related activities.
Figure 1: Project Timeline with Major Tasks (Microsoft Project 2010)
We found it extremely valuable throughout the project by virtue of which we could track our delays and what effect they would have in the final delivery of the report.
11
Literature Review
i.
History of Radiant Conditioning
Radiant floor heating has its roots in ancient Rome (Bansal and Shail, 1999) as well as in ancient Chinese and Korean buildings (Olesen, 2002), where hypocausts were built under the floors of public baths and private houses. The floors were built on short pillars and a hot gas from the furnace was circulated through vacant spaces under the floor, heating the floor. In 1930’s the famous American architect Frank Lloyd Wright, circulated piped hot water through the floors of most of his buildings, after being inspired from his trip to Japan. Radiant-floor heating turns a floor into a large-area, low-temperature radiator. The thermal mass of the slab holds heat and radiates it slowly to the living space above.
The concept has further matured overtime most importantly in 1995 with the wide application of TABS (Thermally Active Building Systems) in the commercial and residential market (Moe, K., 2010).The use of embedded cooling systems has also become a norm in central Europe since 2000.The most recent prime example is Pearl River Tower in China which is 71 stories high being the largest radiant cooled office building in the world while also being the most energy efficient super tall structure in the world.
ii.
Conceptual Description
Building Integrated heating and cooling systems are ways to heat or cool the building with using the building structure itself. Pipes or cables are embedded in the structure and thus a large surface area is used for heating/cooling which offers a great advantage that only small difference in temperature is required between the medium and the desired room temperature.
The most common type of systems is Hydronic based floor heating especially in the Nordic countries (Radisch, 2001; Olesen, 2002; Roots, 2002).This is due to additional thermal comfort as well as aesthetic considerations.
iii.
Hydronic systems
The most common type of BIH system is heating or cooling via the use of fluid in pipes embedded in the slab.
A mix of water and an antifreeze normally propylene glycol is used as a heat transfer fluid in a closed loop which is circulated between the boiler/chiller and the floor.
Various types of pipes are available exclusively for under floor heating and cooling systems and are generally made from polyethylene including PEX, PEX-Al-PEX and PERT.
12
Hydronic systems can use a single source or mixture of energy sources to help manage energy costs. This ability to use multiple sources especially low temperature or renewable sources has made BIH system very popular in the new energy conscious market. Hydronic system energy source options are:
Boilers including Combined heat and power plants heated by: o Natural gas, coal, oil or waste oil
o Electricity
o Wood or other biomass o Bio-fuels
o Solar thermal
Heat pumps and chillers powered by: o Electricity
o Natural gas
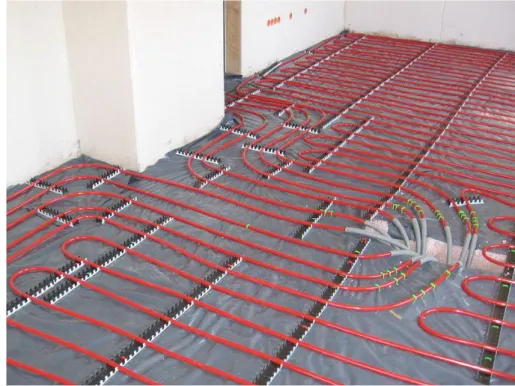
Figure 2: Under floor heating pipes, before they are covered by the screed
Due to the high cost of electricity in most areas, radiant-electric floor heating usually makes the most logic when off-peak electricity is available for charging a slab at night and during other off-peak hours.
A key requirement for most radiant-floor heating systems as stated by the Oregon Department of Energy (ODE) is adequate insulation beneath the heated slab or beneath the tubing. Most manufacturers recommend a minimum of 1” (25 mm) of extruded polystyrene (XPS) for concrete slab-on-grade radiant heating systems, but significantly higher levels are common in cold climates such as that in Sweden.
13
Zoning of radiant floors is usually done with advanced manifold modules that allow the water temperature to be varied in different zones. This provides flexibility for maintaining different temperatures in different rooms and for allowing differential heat delivery to spaces with and without solar gain.
Finally, sophisticated controls are often installed to ensure optimal comfort and to maximize energy performance. Some radiant-floor systems rely on separate temperature sensors outdoors, within the floor slab, and in the living space with microprocessor control to regulate just when and where hot water should be delivered. Standard thermostats may not be as effective due to long lag time of the concrete slab but those with built in anticipative controls based on outdoor temp variation may work well.
iv.
Primary benefits of the Radiant Heating System
A number of features are used a selling points for radiant systems, we shall try to evaluate their pros and cons.
Comfort
Superior thermal comfort is used as the primary selling point for radiant heating systems. In theory the large radiant surface means that most of the heating is delivered by radiation heating the inhabitants directly. Research by (Nevins, Rohles, Gagge, P. Ole Fanger et al), show that humans at rest with clothing typical of light office and home wear, exchange over 50% of their sensible heat via radiation.
Warmer surfaces in a living space result in a higher mean radiant temperature at which most people are comfortable even at lower air temperatures. The ability to walk barefoot on the floor also results from this which is another big selling point.
Indoor air Quality
Underfloor heating has positive impacts on the indoor air quality. Cold Flooring materials such as tile, slate, terrazzo and concrete which have very low VOC emissions can be used. The moisture issue can also be mitigated to a great extent since the temperature on the floor inhibits the growth of mold bacteria dust mites (De Boer, 2003) etc.
Compared with a conventional forced-air distribution system, there is likely to be less dust circulated around the house as there are less airborne particles due to reduced air movement and therefore less irritation of the mucous membrane (Eijdems et al, 2000). Unlike electric baseboard or forced-air heat, there will be no surfaces hot enough to burn dust particles—which could introduce VOC into house air. Eijdems, H.H., Boerrsta, A.C., Op‘t Veld, P.J. (1996) have extensively explored the benefits of low temperature heating systems on IAQ.
14
Energy savings
Much has been written about (mainly by manufacturers )saving energy through the use of radiant heating, included but not limited to lower thermostat settings, reduced infiltration, low temperature boiler settings etc, but the matter is still up for debate.
An investigation by Danish authorities on houses built in the years (2000-2002) showed that the energy consumption of houses with or without floor heating could not be told apart. (Olsen and Christiansen, 2004).
An extra consumption between 2-15% is reported in a theoretical study (Roots and Hagentoft, 2002a) over a radiator heating using a simple numerical simulation model.
Potential for energy saving exists however in the usage of the system. People with radiant floor heating are presumed to be comfortable at lower air temperature due to prevalent elevated mean radiant temperatures. Much literature is available (ASHRAE, 2008) about people being comfortable at 20 C instead of 22 C but research has found that these savings are seldom realized since people do not change their thermostats often.
Ability to use low temperature sources which in turn lead to lower boiler temperatures or the use of renewable energy (solar) are real savings.
Sustainability
Since there is a possibility to use renewable sources benefits include reduction or elimination of combustion and green house gases created by boilers and power generation for heat pumps and chillers, as well as reduced demands for non renewable and superior inventories for future generations.
Quiet operation
Hydronic floor heating systems are extremely quiet, since there is no blower fan like forced air systems and no creaking noises from expansion contraction or gurgle or water like baseboard radiators. Noise from the circulation pumps is almost negligible since they are far away and very quiet these days.
Flexible room layout
With floor heating one has the freedom the place the furniture wherever desired. There are no diffusers or radiators to be concerned about and the heating is deviled uniformly throughout the room.Radiant-floor heating systems are “invisible.”
15
v.
Disadvantages of the Radiant Heating System
Without doubt in the right application radiant heating systems are the best way to deliver heat .The upfront costs are high but there is enhanced comfort, energy savings and other benefits are described above that can easily justify the added cost. The main cons to the systems when applied to the residential market are listed below.
Economics
Nowadays the market is very energy conscious with more and more green buildings being built with a lot of focus on building envelope quality ( U values for walls and windows),air tightness passive solar design etc. Lots of Passive houses are being constructed with very low active heating requirements. In such houses investment of tens and thousands of dollars in installing floor heating systems seams unwise when it is going to run for a very few hours per year. The same level of comfort can be provided with a much cheaper though the wall gas heater or few electric baseboard heaters.
Larry Drake Executive director of the radiant panel association says that “The tighter the envelope, the less the amount of savings of a radiant system”.
Heating performance with micro-loads
Building up from the previous point since the loads are very small the time lag the heavy concrete floor carries can also be a problem and can cause overheating when passive solar or other forms of heat are present in abundance. This can cause overheating. This is usually corrected by sophisticated controls rather than using a simple thermostat, controlling the flow and the temperature of the circulating water based on outside temperature.
Authors also write about the self regulating feature of the system whereas if the slab is heated by solar gain to the desired temperature, it will extract less heat from the circulating water and improve efficiency of the system.
All other features aside the system is complex and has to be designed and zoned properly so that all the plusses can be extracted.
Heat loss into the ground
Slab on grade systems tend to lose a lot of heat to the ground. Paul Torcellini, Ph.D., P.E., of the National Renewable Energy Laboratory states that even with insulation under the ground the heat loss can be around 20 %.
Insulation levels are mainly pretty good for Swedish buildings around (10 to 12 inches) sometimes even more.
16
This loss though is significant even with good insulation levels and needs to be dealt with on a case by case basis since moist ground is more conductive. ASHRAE(2008) Soil Thermal Conductivity Chart shows that Soils with moisture contents greater than 20% can be as much as 15 times more conductive than soils with less than 4% moisture content.
vi.
Where should one install a Radiant Heating System?
As we can see that there no doubt about the ability of the system to provide a comfortable living space for the occupants, but the question remains that when is the installation viable. Alex Wilson of the Radiant Panel Association marks the following cases where Radiant heating makes sense
• In houses and small commercial buildings with conventional levels of insulation and standard insulated-glass windows—especially those in climates with minimal cooling loads—where the extra comfort of radiant heat is desired and the budget allows. • In buildings with large open spaces and tall ceilings. • In buildings where air-flushing are common, such as garages, fire stations, airplane hangars, and industrial spaces (because the large-area radiant floor allows quick recovery). • When cost is not an issue and satisfying most or the entire heating load with solar energy
is a high priority.
• When building occupants have acute chemical sensitivity or allergies—in which case there may be concern that dust could be distributed through a forced-air system or that high surface temperatures from a gas burner or electric heating element will burn dust particles and cause health problems.
Our argument is that instead of conventional radiant heating BIH heating with low temperature (a few degrees above the ambient) when used in conjunction with district heat offers multiple benefits. The low return temperatures in heating and high return temperatures in cooling enable the district energy plant to achieve maximum efficiency. Additionally, under floor radiant systems are ideally suited to renewable energy sources including geothermal and solar thermal systems or any system where waste heat is recoverable.
In the global drive for sustainability, long term economics supports the need to eradicate where possible, compression for cooling and combustion for heating. It will then be essential to use low quality heat sources for which radiant under floor heating and cooling is well suited.
vii.
Exergy in context of Low temperature heating
The main benefit concerning radiant heating and cooling systems is the usage of lower temperatures for heating and higher temperatures for cooling. In practice this also means that heat sources which are close to the preferred room temperature can be used.
17
IEA Energy conservation in building and community systems Annex 37 Low Exergy Systems for Heating and Cooling investigates the potential of replacing high energy sources (fossil fuels and electricity) with low valued energy sources.
viii.
Occupants experiences on Low temperature heating
One of the critical success factors for the implementation of Low Temperature (LT) heating systems in residential buildings is the way these systems are viewed and received by the occupants.
Costs for such systems for dwellings are higher than those for traditional High Temperature (HT) systems while energy savings in some cases are only trivial. This means that LT systems must have some supplementary qualitative benefits for occupants (thermal comfort, indoor air quality, safety, etc.).
The overall performance of LT heating systems must be at least equal or preferably better than that of traditional HT systems.
An occupant survey was conducted by Silvester et al (2000) in the Netherlands in October 1999 among 409 households with LT heating systems in which he concluded that LowEx systems are not only preferable from an exergy point of view, people also seem to appreciate the "softer" heat and coolness of the LowEx systems much more than the traditional heating and cooling solutions.
ix.
Conclusion
It has to be said that the system offers numerous advantages specially being sustainable and energy efficient but its practicality in new considerably tighter houses with good envelope and fenestration values remains questionable, the higher cost factor is sometimes difficult to justify.
Systems therefore have to be looked into more in Life Cycle Costing terms rather than at plain upfront investment.BIH systems have good prospects for a sustainable future. Some of the primary advantages being
Thermal Comfort increases in many respects (greater share of radiant heat transfer, less temperature gradients, better floor contact temperature, less draught and air turbulence);
The IAQ is also positively influenced (less dust singe and house dust mites, less stuffiness and odors through lower air temperature, less suspended particles); In addition to the ability to use Low Valued Energy savings are gained from better
performances of boilers and heat pumps, less piping heat loss and less ventilation losses.
18
Simple Schematic of the System
Figure below presents schematic of a plain under floor heating and cooling system with various sources for cooling and heating.
19
Thermotech’s Building Integrated Heating
i.
Company Overview
Thermotech Scandinavia AB is one of Scandinavia's leading suppliers of systems for heating and water supply to all types of residential and commercial premises.
The company was founded in 1996 in Sollefteå and there are still stocks and production. Seven regional offices in Sweden in Umeå, Sundsvall, Sweden, Norrtälje, Orebro, Vårgårda and Malmö. In Malmö we have also our warehouse in southern Sweden. The group has about 60 employees and annual sales topping 100 million (2009).
ii.
Product Description
Thermotech offers four main product areas Thermotech floor heating
We have over 15 years experience in floor heating and we are experts. We have a complete range of floor heating for all types of residential and commercial premises. Thermotech Minifloor 8
Marketed to be the lowest water-heating system with 8-mm tube. Suitable for small areas up to 12 sqm.
Thermotech large plants
We have a variety of group manifold and large shunts for the larger plants. Thermotech multi-system
Our own system for domestic hot water and radiator connections.
iii.
Kumla Apartments
The Kumla apartments have Thermotech floor heating installed as the primary heating system for the building.
The heat source is district heating. A heat exchanger located in the basement mechanical room then splits up the primary/secondary side which is then circulated to the floor heating manifolds located at each floor via a circulation pump.
20
Picture Left (Name plate for Heat Exchanger) Right (Floor Heating Equipment)
Picture Left (Valves ) Right (Circulation Pump)
The hot water and floor heating are in separate circuits as shown in the pictures below having separate manifolds and distribution.
Fresh air is circulated via a dedicated outdoor air FTX unit situated in the mechanical room at the roof level. There are attenuators on the supply and exhaust side and all the equipment is controlled electronically.
There is a separate fan for exhausting the building in case of fire at the design air changes per hour as per the code.
21
Picture Left (Manifold for Domestic hot water) Right (Manifold for Floor Heating)
Picture Mechanical Room on Roof with FTX unit with Supply and Exhaust Duct work & Fire Exhaust Unit
22
Energy Simulations Via IDA Software
IDA (Indoor Climate & Energy) has been used extensively for whole building energy analysis in the Scandinavian market and is a well developed software tool for energy analysis of buildings. Several research papers such as Vuolle et al (1999) and Sahlin et al (2003) describe the simulation capabilities of IDA.
IDA ICE has built in simulation capabilities for Floor heating which is why the software was our first choice tool for simulation for this particular case.
As in the methodology described earlier to investigate the benefits on employing a BIH system in comparison to a traditional radiator circuit is one of the goals of the thesis. For this purpose once the skeleton of the building was modeled with all its features, two separate files were created one for the case of ideal heating (radiator) and one for floor heating.
The details of the construction and other basic inputs are described below.
i.
Basic Inputs for Energy Analysis
First of the inputs after setting up the location and the climate file the main area is setting up the Defaults Tab which defines the construction values.
The values entered are taken from the data given by “Projektengagemang” the consulting firm that worked on the design of the buildings.
23
After setting the construction values next tab is the site shading and orientation which was determined with the help of Google Maps for correct north south direction.
Figure 5: Site Shading (Source Google Maps)
A very important is the specification of the Thermal Bridges in the building. After having a discussion with the designers, Projektengagemang and the builders Kumla Bostäder we found out that the building’s envelope was according to the current Swedish norms and no additional special insulation was utilized. So we decided to use the thermal bridges values between Typical and Poor as a standard. There was some iteration involved in this process in which was the heat load simulated was compared with the heat requirement as per the district heating bill and the values adjusted to compensate. Sliding scale in IDA was utilized to adjust them all to the same grade. The resulting values can be seen in the screen shot below.
24
Figure 7: Infiltration Source Öman (1991)
Hot water usage approximation was a difficult part considering that there are solar collectors on the roof which provide hot water as well. We had the usage statistics from Kumla Bostäder which showed that there was no district heating requirement during the peak summer, July which confirmed the theory that according to common norm the collectors are designed to meet the peak load during the summer peak.
Thus taking the average number of occupants in the building as 65 according to number of apartments (21-25) from AO Smith Corp (2010) publication and by Anna, Åsa, Ulrik, Tomas (2007) the average use of hot water is around 50 L/person. day assuming the solar collectors give the major portion of the hot water the entered value of 15000 KWh per year seemed reasonable considering the approx 30 m2 solar panels produce the rest.
25
Next is the setup of the FTX unit providing ventilation to the building. The data was provided by the consultant via a spec sheet which available as a reference in the appendix A.
IDA standard AHU was edited so that the cooling coil is turned off (0) since there is no district cooling present.
Figure 9: FTX System Source (FTX Spec Sheet Appendix A)
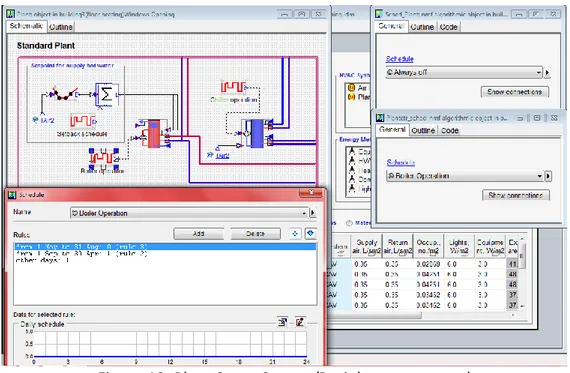
Heating and cooling plant setup is another important step in energy analysis.
26
As seen from the screen shot above the chiller is turned off completely as there is no active cooling available. The boiler on the other hand is on during the heating season (Sep-April) but is switched off during the summer season (May-Aug).This is accomplished by setting up the schedule as shown in the screenshot.
ii.
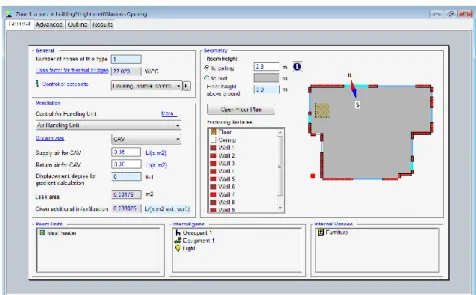
Zoning Details and Inputs
The building has 11 floors and each floor is divided into a separate zone so that the calculations may be more precise and accurate. A sample zone is shown below
Figure 11: Zone 1 Case 1
The primary input is the ventilation system which is supply and exhaust FTX unit as mentioned earlier the total flow when divided over the area gives approx 0.35 L/s.m2 which is also the general conventional value.
The Heating system is the embedded pipes in the floor and the ceiling for Case 1 (BIH Heating) while Ideal Heaters for Case 2 (Radiator Circuit) as shown below.
27
Occupancy Loads are based on observed figures at the site which also comply with AO Smith Corp (2010).
Values for clothing have been given much more freedom then in the standard setup considering freedom to wear little clothes inside the house in summer. Also as the heating set point is setup to the dry bulb temperature and not the operative temperature it would not affect the winter conditions.
The schedule used is “Housing Living” which is shown below.
Figure 13: Occupant Loads & Schedules
The Lighting levels keeping in mind that there are LED’s installed were kept low at 6 W/m2 as compared to normal standards as per ASHRAE 90.1.2007 LPD (Lighting Power Density) for Multi Family Housing which call for 7.5 W/m2.
A special schedule was built for the summer considering the abundant daylight available during the summer months.
28
Figure 14: Lighting Loads & Schedules
Equipment Loads are very tricky to estimate for houses but as more and more energy efficient are manufactured (Efficient Refrigerators and LCD Screens) the loads are coming down day by day. The assumed load is about 3 W/m2.The Schedule is shown below which is modified for weekdays and weekends.
29
A complex schedule for the opening and closing of windows was made to deter the effects of overheating during the summer months. The windows are assumed to be closed from 16th October to 14th March during the heating season while they work according to the schedule below during the rest of year.
In the first iteration for simulating this building there was a lot of thermal dissatisfaction during the summer months and opening of the windows was the layman solution to the problem which turned out to be quite effective. There may be difference of opinion regarding the time of the opening but the general intent is the same which is to bring the operative temperature down to a satisfactory level.
Figure 16: Window Schedule
iii.
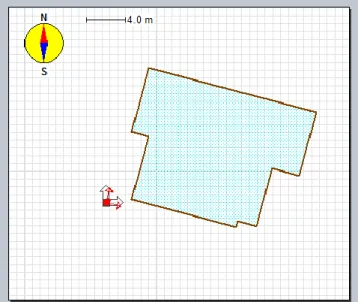
Floor Plans & 3d Model:
The following show the screen shots for the model as made in IDA with the actual drawing of the floor as per the consultant.
30
Below are the 3d model and the actual picture of the buildings in Kumla.
Figure 18: 3d Plans Kumla Apartments
iv.
Results of the Energy Analysis
An important element for energy analysis is how accurately the climate data file predicts the local weather conditions prevalent in the area. To determine this climate file for Stockholm Arlanda was compared to the weather conditions during the season 2010-2011 for which the energy statistics were available. It was noted that the climate in the simulation file was rather moderate as compared to the extreme winter season encountered. Thus an alternate climate file for Umea was considered which despite being further up in latitude as compared to Kumla provided much better values, although some values were rather extreme majority were reasonable.
There were two cases run. First, considering ideal heating (conventional radiator) and secondly considering BIH Heating.
31
a. Delivered Energy Report For Floor Heating
Delivered Energy Report
Project Building
Model floor area 1853.6 m2
Customer Model volume 5190.3 m3
Created by Harris Model ground area 209.1 m2
Location Stockholm (Arlanda) Model envelope area 2153.9 m2
Climate file Umea Hour Window/Envelope 18.1 %
Case building3(floor heating)Windows Opening Average U-value 0.4965 W/(K·m2)
Simulated 6/5/2011 09:22:37 Envelope area per Volume 0.415 m2/m3
Building Comfort Reference
Percentage of hours when operative temperature is above 27°C in worst zone 15 %
Percentage of hours when operative temperature is above 27°C in average zone 11 %
Percentage of total occupant hours with thermal dissatisfaction 13 %
Delivered Energy Overview
Delivered energy
kWh kWh/m2
HVAC aux 9492 5.1
Total, Facility electric 9492 5.1
Heating 96204 51.9
Domestic hot water 18250 9.8
Total, Facility district 114454 61.8
Total 123946 66.9
Equipment, tenant 10019 5.4
32
Total, Tenant electric 31939 17.2
Grand total 155885 84.1
Monthly Delivered Energy
b. Delivered Energy Report For Radiator Heating
Delivered Energy Report
Project Building
Model floor area 1853.6 m2
Customer Model volume 5190.3 m3
Created by Harris Model ground area 209.1 m2
Location Stockholm (Arlanda) Model envelope area 2153.9 m2
Climate file Umea Hour Window/Envelope 18.1 %
Case building2(night vent)Windows Opening Average U-value 0.4965 W/(K·m2)
Simulated 6/4/2011 22:30:50 Envelope area per Volume 0.415 m2/m3
Building Comfort Reference
Percentage of hours when operative temperature is above 27°C in worst zone 15 %
Percentage of hours when operative temperature is above 27°C in average zone 12 %
33
Delivered Energy Overview
Delivered energy
kWh kWh/m2
HVAC aux 9326 5.0
Total, Facility electric 9326 5.0
Heating 103921 56.1
Domestic hot water 18250 9.8
Total, Facility district 122171 65.9
Total 131497 70.9
Equipment, tenant 10027 5.4
Lighting, tenant 21924 11.8
Total, Tenant electric 31951 17.2
Grand total 163448 88.2
34
v. Evaluating the Integrity of the model
To evaluate the reliability of the model the actual consumption can be compared with the simulated results.
Of course there are normal variations due to climatic deviation and other construction unknowns.
Below are the statistics provided by Kumla Bostäder for Electricity and District heating.
ELFÖRBRUKNING NORRA KUNGSVÄGEN 20 KWH/MÅN
År Jan Feb Mars April Maj Juni Juli Aug Sep Okt Nov Dec 2010-11 4252 3891 3920 3435 2334 2655 2725 2991 3487 3790 4306 4840
FJÄRRVÄRMEFÖRBRUKNING NORRA KUNGSVÄGEN 20-22 KWH/MÅN År Jan Feb Mars April Maj Juni Juli Aug Sep Okt Nov Dec 2010-11 24325 24040 17815 5670 4698 2824 0 2825 2825 12490 23025 31910
Table 1: Statistics of Energy Usage for Norra Kungsvägen Source (Kumla Bostäder) {Yellow Highlights=2011 Green Highlights=2010}
These statistics were compared with the result from the simulation done in the IDA program as mentioned before the outside temperature for the past extreme winter was very different as compared to the climate file for Stockholm Latitude (Close to Kumla) so the File for Umea was used which provides a better result as depicted by the excel charts below.
35
Figure 19: Simulated VS Measured Values (Kumla Bostäder & IDA Simulation)
The electrical consumption follows the measured values very closely due to the reasons of employing clever schedules (Occupancy, Light and Equipment) to depict actual ground conditions.
The overall error in the simulated and measured data is less than 4 %, which is a remarkable value. As the bought electricity mainly comprises of HVAC equipment, lighting, and general equipment all of which are modeled according to the conditions prevalent especially the ventilation and lighting loads the result is pretty close to the actual value.
0 1000 2000 3000 4000 5000 6000
Jan Feb Mar Apr May Jun Jul Aug Sep Oct Nov Dec
KWH 's o f b o u gh t E LE C
Electrical Consumption
Measured Elec Data Simulated Elec Data
36
Figure 20: Simulated VS Measured Values (Kumla Bostäder & IDA Simulation)
The district heating simulation is much more difficult with a lot of unknown variables (Demand Heating difference due to outside temp, Contribution of Solar Heating, Actual Hot water consumption etc) which lead to bigger deviations between the perceived and actual consumption.
The overall error is around 20 % much of which is caused by the later months of 2010 (Oct, Nov and Dec) which were unusually cold as Sweden encountered the coldest winter in 100 years.
All in all we are satisfied by the simulation results within the constraints of limited data and modeling abilities of IDA.
0 5000 10000 15000 20000 25000 30000 35000
Jan Feb Mar Apr May Jun Jul Aug Sep Oct Nov Dec
KWH 's o f b o u gh t D is tri ct H ea t
District Heating Consumption
Measured Heating Consumption Simulated Heating Comsumption
37
vi.
Analysis of the Energy Simulation Reports
A number of conclusions can be drawn from the energy simulations. We would take each case separately.
a. Floor Heating Vs Radiator Heating (Energy Wise)
With all other factors constant (Electric Loads, Domestic Hot water etc) there an energy saving when utilizing the floor heating instead of a conventional system even with the thermostats at the same set point as per the simulation.
The Heating for the radiator case uses 103921 KWh while the BIH heating only consumes 96204 KWh, which translates into direct energy savings of 7717 KWh or about 7.5 % annual savings.
A Question of Thermostatic Set point
The savings are not that much but additional savings may be encountered by lowering the thermostatic set points by around 2 °C according to research conducted by ASHRAE for radiant heating systems providing the same level of thermal comfort.
On the contrary research by CMHC (Canada Mortgage and Housing Corporation) for 50 houses shows that the average temperature for radiant heating is around 20.4 C while for other type of heating was averaging at 19.8 C.
Thus we can conclude that people seldom tinker with the thermostats and the potential to save energy is not much unless externally regulated or automatic controls according to outside temperature are adopted.
Those may even have problems for BIH systems due to their large thermal inertia and very small response time (US DOE). Tracking systems on the other hand which can predict temperature and preempt settings may have saving potential.
Other potential energy savings:
Besides set point temperature there are other sometimes hidden savings potentials associated with BIH heating.
As the system is a low temperature system alternative form of energy primarily Solar can be utilized very effectively by this system. Despite its high latitude Sweden still receives a lot of solar gain throughout the year and low temp heating systems are ideally suited to utilizing that energy. Design of the Kumla Apartments also incorporates around 30 m2 of solar panels for hot water and heating purpose.
38
If heat is provided though a district heating connection then via a heat exchanger the incoming hot water can be brought down to lower temperature thus utilizing lesser energy. If a boiler is used the lower temperature requirement would directly translate into energy savings.
The third prospect for energy savings is that radiant-floor systems do not increase the rate of air infiltration. Standard forced-air heating systems can considerably increase or decrease air pressure in different parts of a building, which in turn can increase air infiltration/ exfiltration rates—at least in a conservative, leaky building.
b. Floor Heating Vs Radiator Heating (Thermal Comfort)
Thermal Comfort is difficult to gauge theoretically as there are numerous factors at play which can cause localized comfort/discomfort levels.
The zoning is alright for energy analysis point of view but in terms of thermal comfort analysis it is much too big. The reading from IDA can be at best taken as generalized levels of comfort over the complete floor as there is a single zone per floor.
Also IDA uses a very simplified way to calculate thermal comfort as compared to sophisticated programs or sensor based measurement which takes into account a lot of factors.
As a sample case we can take Zone 5 which is in the center of the building. Figure below shows the Operative temperature ranges for the whole year for Zone 5.We can see the heating is on from Sep-April as per the schedule and the temperature rises to around 28 degrees in peak summer conditions.
39
Figure 21: Main Temperatures Zone 5 BIH Heating.
To study the comfort level in more detail we can take a particular month let’s say January for the BIH heating.
Figure 22: Thermal Comfort Zone 5 BIH Heating (Adjustable Clothing 0.85±0.45 Clo)
The graph shows that the system meets the demand for heating quite aptly and is able to keep the operative temperature within the band of optimum comfort.
40
Below is the same graph for the month of January for the radiator system. As per the figures it is very difficult to draw any kind of conclusion about which system provides better comfort.
Figure 23: Thermal Comfort Zone 5 Radiator Heating (Adjustable Clothing 0.85±0.45 Clo)
As IDA adopts a very simplified procedure to calculate thermal comfort, furthermore the considered zone is quite big; it is difficult to estimate the effect.
As referred in the literature study there are several documented research papers about the positive impact of BIH Heating on thermal comfort (reducing infiltration, better distribution of heat, no cold spots, ability to walk bare foot in winter, etc) some of which cannot be gauged by simulation analysis.
The summer season is irrelevant for this discussion as the heating is switched off.
Actual Measurements & Surveys would therefore be the best judge for determining the thermal comfort.
The following chapters would introduce the measurements and survey mechanism.
In conclusion we would bring together results from all three analyses to evaluate the system in detail.
vii.
Ground Level Heat Loss
A case was observed during the simulation that even with considerable amount of heating being supplied to the ground level the heating set point was not achieved for the coldest months. Investigating the contributions we saw that there was a lot of heat loss to the ground even with decent insulation (250mm) being in place. This loss also effected the heat
41
balance of the First Floor since the zones are thermally connected causing some amount of discomfort.
Figure 24: Minimum Operative Temperatures for each zone.
When we were conducting our survey we also found out that the person living on the ground level had complained about the heating system and had after evaluation additional radiators installed in her apartment by the building owner.
This can be further studied in detail and the system optimized with perhaps additional insulation or other mechanisms.
42
Thermal Comfort
Human thermal comfort is the state of mind that expresses satisfaction with the surrounding environment (ASHRAE Standard 55). Achieving thermal comfort for most occupants of buildings or other enclosures is a goal of HVAC design engineers. Indoor air quality is not part of thermal comfort, but is also a key concern of HVAC designers. Although there are many factors to take into account, thermal comfort is fundamentally all about how people interact with their thermal environment.
When people talk about feeling hot or cold, draughty or stuffy, what they are really doing is responding to the transfer of heat from their body to the surroundings, and to the quality of the air within the space.
A lot of empirical data has been collected on how these parameters are defined. The factors that have relevant influence on the thermal comfort of occupant’s spaces can be divided in environmental and personal factors.
Environmental factors: Temperature Thermal radiation Humidity Air speed Personal factors:
Personal activity and condition Clothing
Considering these factors climate systems can be made more apt to the needs of users on one hand, but also more efficient on the other hand. And if such a system is using energy only if it is really needed – energy consumption may be reduced.
Personal Factors: Sensitivity of the environmental conditions and the feeling of comfort are related to metabolic heat production, its transfer to the environment, and the resulting adjustments of body temperature.
For defining a comfort zone of external parameters it is important to know the activity of an individual person: Are people sitting and working in an office, are they doing sports in a gym, are they sick in a hospital or are they hiking somewhere outdoor.
43
Figure 25: Thermal comfort conditions, Source ASHRAE 55-2004
A second parameter is clothing – through its insulating properties it is an important parameter of body heat conservation or loss and hence for feeling thermal comfort. Clothing is changing to a great extent by the season and outdoor weather conditions. The values of the insulation level attained with various clothing are normally expressed in units “clo”.
Figure 26: Graph showing the optimal thermal conditions, based on ISO 7730 and ASHRAE STD 55, Clothing values of 0.5 to 1.0 clo and PMV limits of 0.5.Source ASHRAE 55-2004
44
i.
Local Thermal Discomfort Factors
A certain percentage of people are usually dissatisfied by a factor other than thermal sensation, such as draft or radiant asymmetry. These factors as per the ISO standard are
Radiant temperature Asymmetry Vertical air temperature difference Floor surface temperature
Temperature variation with time
Cyclic variations in operative temperature Drifts or ramps
Draft (in winter)
ii.
Basic Definitions
The basic definitions about the quantities can be found in standard texts such as ASHRAE. The sources are listed at the end in the reference chapter.
Operative temperature Is a combined value of air temperature and mean radiant temperature. At low air velocities (< 0.1 m/s) the heat transfer coefficients by convection and radiation of the human body are roughly the same and that is why the operative temperature often can be estimated as the average of air temperature and mean radiant temperature.
Mean radiant temperature Is principally a weighted average of the temperatures of surrounding surfaces. The mean radiant temperature is defined as the uniform surface temperature in an imaginary room with black surfaces (emissivity = 1), which will result in the same heat exchange by radiation from a person as in the actual, non–uniform, environment.
Mean radiant temperature, as well as operative and equivalent temperatures, are thus defined in relation to a person, why the person’s build, posture and position in the room are of importance.
Air VelocityIn occupied zones, air velocities are usually small (0 to 0.5 m/s), but do affect thermal sensation. Because velocity fluctuates, the mean value should be measured over a suitable period, typically 3 min. Velocity fluctuations with frequencies up to 1 Hz significantly increase human discomfort caused by draft, which is a function of air temperature, mean air velocity, and turbulence.
Air velocity has a cooling effect on the human body. This effect is here quantified as the corresponding lowering of the equivalent temperature (constant air velocity, comparison with 0 m/s) See Table 1.0. The table shows the values for the air temperature and clothing of 20 °C and 0.8 clo respectively. Extracted from ISO 7730.
45
Table Effect of air velocity in terms of equivalent temperature. Source ISO 7730.
Air velocity, m/s 0.1 0.15 0.2 0.3 0.5 1.0
Cooling effect, °C 0 0.5 0.9 1.6 2.7 4.7
Activity level, metabolism, is given in the unit met, where 1.0 met = 58 W/m2 body surface is equal to the metabolism for a seated, resting person. The surface area of an average person is approximately 1.8 m2. Lowest activity is sleeping, 0.8 met, and very high activity is 4 met, corresponding to e. g. heavy work or fast walking (6.7 km/h). This can be estimated from tables in ISO 7730
.
Table 2.0. Activity in terms of met units. Source ISO 7730.
Activity Level Sleeping Seated at rest Standing Heavy Work or Fast walking
Met Units 0.8 1.0 1.2 4.0
PMV (Predicted Mean Vote) is an index that expresses the quality of the thermal environment as a mean value of the votes of a large group of persons on the ASHRAE seven-point thermal sensation scale.
iii.
ASHRAE Thermal Sensation Scale
Predicted Percentage of Dissatisfied (PPD) <10% Predicted Mean Vote (PMV) >-0.5 to <+0.5
Figure 27: ASHRAE Thermal Sensation Scale
PPD (Predicted Percentage Dissatisfied) is an index expressing the thermal comfort level as a percentage of thermally dissatisfied people, and is directly determined from PMV. The PPD index is based on the supposition that people voting ±2 or ±3 on the thermal sensation scale are dissatisfied, and the generalization that PPD is symmetric around a neutral PMV (=0).
Recommended thermal comfort requirements are given in annex A to ISO 7730. A general recommendation is:
46 –0.5 < PMV < +0.5, corresponding to PPD < 10
iv.
Input Parameters for Personal Factors
The use of the quantities PMV and PPD is based on a “model” for thermal comfort, Fanger (1970) that is also international standard; ISO 7730 from 1984. Methods of measurement are described in ISO 7726 from 1985.
The activity level for a human being inside a single family house can be assumed to be 1 met (seated/relaxed) and the clothing information as per the table shown below can be taken as 1.0 clo.
Clothing
Activity
1.0 met seated, relaxed 1.6 met shopping0.8 clo Summer clothing 26.7 °C 23.3 °C
1.0 clo Indoor winter clothing 23.8 °C 19.4 °C
1.5 clo Heavy traditional European business suit 20.9 °C 15.5 °C
2.0 clo Outdoor winter clothing 18.0 °C 11.6 °C
Table 2.0 Comfort temperatures with different clothing and activity. Source (Öman, Robert 1993)
47
Thermal Comfort Measurements
i.
Instrument & Software Setup
For the experiment the instrument was setup with an air velocity, humidity and an operative temperature sensor on a tripod stand. The Software Vivo Controller was installed on the machine and a trail run was taken to make sure that everything was in proper working order.
The standard template “PMV PPD Fast” was utilized for measuring the PMV and PPD values .The interval was 10 minutes.
ii.
Sensor Locations over the house
One of the critical decisions in the measurement process was where to place the sensors. The areas where they felt the most uncomfortable or where they spent the most amount of their time were regarded as good points.
In total 5 locations were decided upon, which can be seen marked by crosses in the layout below.
48
iii.
Measurements for the Kumla Buildings
For the PMV/PPD values we have taken the values of clo and met as under Activity = 1.0 met
Clothing = 0.8 clo
a. Location 1 (Kitchen Area)
The first measurement is taken at the Kitchen area. The Kitchen exhaust fan is not switched on. The humidity is around 29 % and the air velocity is 0.01 m/s.
The PMV is 0.35 and corresponding PPD is around 8 %.
Figure 29: Variation of operative temperature in kitchen area
b. Location 2 (Living Area)
The humidity is around 28 % and the air velocity is 0.02 m/s. The PMV is 0.5 and corresponding PPD is around 10 %.
49
Figure 30: Variation of operative temperature in living area
c. Location 3 (Central Area)
The humidity is around 27 % and the air velocity is 0.08 m/s. The PMV is 0.5 and corresponding PPD is around 10 %.
50
d. Location 4 (Sov)
The humidity is around 26 % and the air velocity is 0.1 m/s. The PMV is 0.45 and corresponding PPD is around 9 %.
Figure 32: Variation of operative temperature in small bedroom
e. Location 5 (Master Sov)
The humidity is around 24 % and the air velocity is 0.08 m/s. The PMV is 0.54 and corresponding PPD is around 11 %.
51
Figure 33: Variation of operative temperature in master bedroom
iv.
Results
As we can see from the measurements that the mean PMV is around 0.45 which corresponds to a PPD of around 10 % dissatisfied people, which are very good values on a relatively warm summer day in May. Thus we can conclude that the apartment buildings have no significant problem during the summer season.
It would have been ideal if we could have taken readings for buildings during the winter season but time does not permit that.
Therefore for the purpose of this study we would rely mostly on the findings of a comprehensive thermal comfort survey conducted from the residents to come up with a PMV value.
We also have simulated values of comfort from IDA which can be used to evaluate the level of comfort in comparison with the survey.
52
Thermal Comfort Survey
The questionnaire prepared for the survey was based on the guidelines of the two benchmark standards, ASHRAE standard 55-2004 and ISO 7730-2005. The survey addresses two of the most important parameters inside a building that affect human performance and health which are thermal comfort (temp variation, humidity and draft) and Indoor Air Quality (ventilation).
The survey consisted of questions pertaining to the satisfaction of the residents with the thermal comfort and indoor air quality during winter and summer and self reported productivity. To gauge the resident’s satisfaction level and self reported productivity, a 7 point differential scale (-3, -2, -1, 0, +1, +2, +3), ranging from very dissatisfied (-3) to very satisfied (+3), similar to the ASHRAE thermal sensation scale was used.
From this data, based on the resident’s opinions, a mean satisfaction value is obtained, which can be used to see how satisfied the residents are thermal comfort wise. The following questions were asked to be rated on the 7 point scale, in order to gauge the thermal comfort:
1. Please rate the overall thermal comfort in your home.
2. Please rate the thermal comfort in your home during warm or hot weather. 3. Please rate the thermal comfort in your home during cool or cold weather.
A few follow up questions were asked to know what the reasons could be, if at all they were dissatisfied.
The following questions were asked to be rated on the 7 point satisfaction scale, in order to gauge the indoor air quality.
1. How satisfied are you with the overall air quality in your home?
2. Overall, does the air quality enhance or interfere with your productivity?
A total of 19 filled survey forms were received from the residents of both the buildings, although we wish we could have more completed survey forms for better results and comprehensive analysis.
53
Figure 34: Distribution of votes for satisfaction with overall thermal comfort
The chart above shows the distribution of thermal comfort satisfaction for the filled surveys obtained. It can be seen that the majority of residents are satisfied with the overall thermal comfort in their homes.
The mean satisfaction vote for overall thermal comfort when calculated would be, Mean Vote = (1*(-3) + 2*(-2) + 4*(-1) + 1*(0) + 1*(1) + 8*(2) + 2*(3)) / 19 = 0.63
The Mean Vote obtained, which is 0.63 is in the positive range, i.e. in the satisfaction range and not in the dissatisfaction range. It goes to show that the overall thermal comfort is satisfactory. 0 1 2 3 4 5 6 7 8 9 -3 -2 -1 0 1 2 3 N o . o f Vo te s Very Dissatisfied
1. Please rate the overall thermal comfort
in your home
54
Figure 35: Distribution of votes for satisfaction with thermal comfort in hot weather
As one can see in the chart above, the number of votes on the thermal sensation scale for very hot is high during summer. The mean value when calculated is,
Mean Value = (1*(-1) + 4*(0) + 4*(1) + 2*(2) + 8*(3)) / 19 = 1.63
The mean value calculated is 1.63, which does not lie between the acceptable range of -0.5 and +0.5, showing that it is a bit hotter inside the building than desired for most of the residents.
(As per ASHRAE standard 55-2004 and ISO 7730-2005, those who vote outside -0.5 and +0.5 of the thermal sensation scale, should be counted as dissatisfied.)
0 1 2 3 4 5 6 7 8 9 -3 -2 -1 0 1 2 3 N o . o f V o tes Very Cold