I VTIra I rt
358A
1990
Reduction in the speed limit
from 110 km/h to .90 km/h
during summer 1989
Effects on personal injury accidents, injured
and speeds
Ge'ran Nilsson
Vag- 06/)
Statens veg- och trafikinstitut (VT/l - 58 1 o 1 Lin/taping
V
1.9.90
Reduction in the speed limit
from 110 km/h to .90 km/h
during summer 1989
Effects on personal injury ace/dents, injured
and speeds
Gb'ran Nilsson
Veg-och
Statens veg- och trafikinstitut (VTI/ - 581 0 1 Linképing
Publisher: Publication:VTI RAPPORT 3 5 8A
Published: Project. code: 1990 743 67-4
SW9diS/I 308dand Project." . .
- - ' The traffic safety
Situa-' Traffic ResearchInstitute
t ion during smer 1 989
Swedish Road and Traffic Research Institute 0 5-581 01 Linko'ping Sweden
Author: Sponsor:
Swedish Road Safety
Goran Nilsson
Office (TSV)
7%k: Reduction of the 110 km/h speed limit to 90 km/h during summer 1989.
Effects on personal injury accidents, injured and speeds.
Abstract (ba ckground,aims, methods, results) max 200 words:
On behalf of the Road Safety Office the Institute has analysed the
effect of the reduced speed limit during summer 1989. The reduction in
the 110 km/h speed limit to 90 km/h during summer 1989 (June 22
-August 20) on 5500 km of roads led to lower speeds than in 1988 not
only on the road sections involved but also on other main roads.
An estimate of the overall effect of the speed limit reduction has
been made for 110 km/h and 90 km/h roads by comparing the traffic
safety trend on roads which earlier had a 110 km/h speed limit and 90
km/h limit, respectively, with the traffic safety trend on 70 km/h
roads,
Earlier 110 km/h roads: Personal injury accidents -27%(-42%,-8%)
Killed and injured -21%(-34%,-5%)
90 km/h roads: Personal injury accidents -14%(-27%, 0%)
Killed and injured -11%(-22%,+l%)
The above is subject to the assumption that the situation on 70 km/h
roads was not influenced by the speed limit reduction on 110 km/h
roads. Since speeds on these roads have also fallen, the above effects
may in reality be somewhat larger than recorded. The confidence
intervals used imply a 95% probability that the "true" effect is
within the stated interval.
Summing up, the traffic safety situation on rural roads during summer
1989 improved in relation to the corresponding period in 1988. As
expected, the improvement was greatest on those roads where the speed
limit was reduced from 110 km/h to 90 km/h, particularly on motorways.
The reduction in speed was also greatest on motorways.
Keywords:
TABLE OF CONTENTS
Page
SUMMARY I
1 BACKGROUND 1
2 PERSONAL INJURY ACCIDENTS AND TRAFFIC CASUALTIES DURING THE SUMMER PERIODS,
1985-1989 2
2.1 The development of personal injury
accidents and casualties on main roads with different speed limits during the summer period each year from 1985 to
1989 3
2.2 Analysis of the change in the number
of personal injury accidents and the number of traffic casualties, incl. deaths, in the summer of 1989 as compared with the summer of 1988
Analysis of fatal accidents and deaths
Number of casualties (fatal) according
to roaduser category 9 N M . 5 0 0 004: .
3 PERSONAL INJURY ACCIDENTS AND INJURY
RISKS ON INTEREUROPEAN HIGHWAYS ll 4 CHANGES IN SPEED DURING THE SUMMER
PERIOD BETWEEN 1988 AND 1989 14 5 ASSESSMENT OF THE DEVELOPMENT OF
TRAFFIC SAFETY ON MAIN ROADS IN THE SUMMER OF 1989 AS COMPARED WITH THE SUMMER OF 1989 FROM THE VIEWPOINT OF
Reduction of the 110 km/h speed limit to 90 km/h during summer
1989. Effects on personal injury accidents, injured and speeds by Goran Nilsson
Swedish Road and Traffic Research Institute (VTI)
S-581 01 LINKoPING SWEDEN
SUMMARY
The reduction in the 110 km/h speed limit to 90 km/h during
sum-mer 1989 (June 22 - August 20) on 5500 km of roads led to lower
speeds than in 1988 not only on the road sections involved but
also on other main roads.
The median speed of passenger cars decreased by 14.4 km/h on
motorways and 11 km/h on two-lane roads during July, compared
with 1988 when the speed limit was 110 km/h. On road sections
subject to a 90 km/h speed limit during the summer periods of
both 1988 and 1989, the median speed decreased by 2.5 km/h and on road sections with a 70 km/h speed limit both summers the median speed decreased by 2.2 km/h.
The analysis of the change in the traffic safety situation is
based on the change in traffic safety on the earlier 110 km/h
sections between the summers of 1988 and 1989 in relation to the
change in traffic safety on the sections with a 90 km/h speed
limit both summers. This has made it possible to clarify the
effects of the reduction of the speed limit. The estimated
effect of the reduction on the number of personal injury
acci-dents is a reduction of 15 % and a reduction of 11 % in the
number of injured. These reductions are not statistically
signi-ficant. Information on personal injury accidents, as well as on
killed and injured, has been obtained from Statistics Sweden.
Various activities were carried out by the Road Safety Office
following the decision taken by the Government to reduce the
speed limit and together with the speed limit reduction itself,
the mass media, police surveillance etc. appear to have
favour-ably influenced speed behaviour and the traffic safety
II
An estimate of the overall effect of the speed limit reduction
has been made for 110 km/h and 90 hm/h roads by comparing the
traffic safety trend on roads which earlier had a 110 km/h speed
limit and 90 km/h speed limit, respectively, with the traffic safety trend on 70 hm/h roads,
Earlier 110 km/h roads: Personal injury accidents -27%(-42%,-8%)
Killed and injured -21%(-34%,-5%)
90 km/h roads: Personal injury accidents -14%(-27%, 0%)
Killed and injured -ll%(-22%,+1%)
The above is subject to the assumption that the situation on 70
km/h roads was not influenced by the speed limit reduction on
110 km/h roads. Since speeds on these roads have also fallen,
the above effects may in reality be somewhat larger than
record-ed. The confidence intervals used imply a 95 % probability that
the "true" effect is within the stated interval.
On European highways, the risk of a personal injury accident
(number of personal injury accidents in relation to vehicle
mileage) and the injury risk (number of injured in relation to
vehicle mileage) both decreased by 24 % between the summers of
1988 and 1989 on roads which earlier had a 110 km/h speed limit.
The corresponding decreases on the 90 km/h European highways are
2 and 8 % respectively. Information on accidents, killed and
injured and vehicle mileage has been obtained from the National
Road Administration.
A welfare economics assessment on the basis of the National Road
Administration's economic values of traffic casualties and
travel time, as well as vehicle costs, shows that personal
injury costs on the rural road network fell by SEK 370 million
between the summers of 1988 and 1989. The increase in travel
time costs is between SEK 260 and SEK 265 million, but the
reduction in vehicle costs was of the same order of size. The
cost of the measure itself - new signs, information activities
etc. - was less than SEK 15 million.
III
Neither the number of fatal accidents nor the number of
fatali-ties during summer 1989 on earlier 110 km/h sections has
decrea-sed. On the other hand, the total number of fatal accidents and
fatalities on rural roads during the summer was smaller than
du-ring the summers of 1986-1988. The reduction may quite simply be attributed to the 90 km/h roads, where a large decrease in these figures has occurred. Both the number of fatal accidents and the
number of fatalities are, however, relatively small, and random
factors may have a significant influence.
Summing up, the traffic safety situation on rural roads during
summer 1989 improved in relation to the corresponding period in
1988. As expected, the improvement was greatest on those roads
where the speed limit was reduced from 110 km/h to 90 km/h, par-ticularly on motorways. The reduction in speed was also greatest
on motorways.
According to the preliminary official traffic accident
statis-tics, the traffic safety trend generally in Sweden between 1988
and 1989 shows that the number of fatalities increased by 13 %.
The total number of killed and injured increased by 0.5 %. There
is, therefore, a general tendency indicating that the number of
fatalities has increased and the total number of killed and
in-jured is still increasing, despite the large number of injured
in 1988.
The traffic safety trend on rural roads during summer 1989
dif-fers from the overall traffic safety trend and has therefore
contributed, through the reduced speed limit during the summer,
to eliminating what would in all probability have been a further deterioration in traffic safety in 1989 compared with 1988.
1 BACKGROUND
For the period from June 22 to August 20, 1989 the Swedish
Government decided that the speed limit on roads with a limit of
110 km/h, totalling slightly more than 5,500 km, would be
reduced to 90 km/h. The reason for this decision was the greatly increased number of accidents resulting in personal injuries on
these roads in 1988 and the spring of 1989. At the request of
TSV (National Road Safety Office) and with the assistance of SCB
(Statistics Sweden) and the National Road Administration, VTI (Swedish Road and Traffic Research Institute) has studied the
effect of reducing the speed limit on the number of personal
injury accidents, the number of traffic casualties, and vehicle speeds.
2 PERSONAL INJURY ACCIDENTS AND TRAFFIC CASUALTIES DURING THE SUMMER PERIODS, 1985-1989
By way of introduction it may be of interest to report the
number of personal injury accidents and traffic casualties
occurring during a corresponding period in previous years. Table
1 shows the number of personal injury accidents and traffic
casualties reported by the police according to SCB, and the
number of casualties per personal injury accident from 1985 to
1989 throughout Swedenon main roads (not built-up areas) during
the- summer. The summer period begins in each year on the
Thursday before Midsummer.
Table 1. Number of personal injury accidents, number of
traffic casualties and number of casualties per
personal injury accident in Sweden on main roads
during the summer period.
NO. OF PERSONAL NO. OF CASUALTIES PER
YEAR (PERIOD) INJURY ACCIDENTS CASUALTIES PERSONAL INJURY
ACCIDENT 1985 (20/6-18/8) 1412 2206 1.56 1986 (19/6-16/8) 1564 2398 1.53 1987 (18/6-16/8) 1443 2265 1.57 1988 (23/6-21/8) 1514 2557 1.58 1989 (22/6-20/8) 1510 2292 1.52
The number of personal injury accidents occurring on main roads
during the summer period in question comprises barely 10% of the
total number of traffic accidents and about 10% of all traffic
casualties during a year. The increase in motor traffic has been roughly the same every year, between 4% and 5% according to the
National Road Administration. The number of personal injury
accidents and traffic casualties does not follow the annual
development of traffic volume from year to year. Every increase
from one year to the next has been followed by a decrease.
However, since every increase has been followed by a slight
decrease, the pattern during the years 1985-1989 showed an
increase in personal injury accidents and traffic casualties
which largely corresponds to the increase in traffic volume.
2.1 The development of personal injury accidents and
casualties on main roads with different speed limits
during the summer period each year from.l985 to 1989.
Table 2 shows the number of personal injury accidents, the
number of traffic casualties and the number of casualties per
personal injury accident on main roads with different speed
limits during the summer period each year from 1985 to 1989.
Table 2. Number of personal injury accidents (PO), number of
casualties (incl. deaths) (S) and number of
casualties per personal injury accident (S/PO) on
main roads with different speed limits during the
summer period each year from 1985 to 1989.
S P E E D L I M.I T
110 90 70 50
YEAR PO 3 S/PO P0 3 S/PO PO 5 S/PO P0 3 S/PO
1985 127 196 1.54 581 971 1.67 571 852 1.49 133 187 1.41 1986 195 328 1.68 626 1015 1.62 615 892 1.45 115 170 1.48 1987 168 268 1.59 635 1055 1.66 525 772 1.47 115 170 1.48 1988 222 378 1.70 676 1085 1.61 591 926 1.57 _125 168 1.34 1989 169 290 1.72 605 935 1.55 618 896 1.45 118 171 1.45 90
It is evident from the table that the number of accidents on
roads with a 110 km/h speed limit comprises slightly more than
10% of the summer period s personal injury accidents on main
roads. This means that these accidents comprise slightly more
than 1% of the total number of accidents occurring during a year
on Swedish roads. The direct effect of lowering the speed limit
accordingly affects slightly more than 1 (one) per cent of the
accidents occurring during a year.
It is also important to note that the 110 km/h roads increased
in extent from 1985 to 1989, which means that their proportion
of the total traffic mileage increased each year. A direct
comparison between 1989 and earlier years is therefore
irrelevant. However, it can be stated that the difference in the
number of 110 km/h roads from the summer of 1988 to the summer
of 1989 is marginal. In the analysis described below, only
comparisons with the summer of 1988 are therefore made.
Comparisons between the summer periods in 1988 and 1989 are
based on roads which had a speed limit of 110 km/h during the
summer period in 1988.
2.2 Analysis of the change in the number of personal
injury accidents and the number of traffic
casualties, incl. deaths, in the summer of 1989 as
compared with the summer of 1988.
The following two hypotheses have been taken as a starting point
for estimating the effect of the actual speed limit reduction
and also its total effect on the traffic safety situation.
Hypothesis 1: Lowering the speed limit on 110 km/h roads to 90 km/h during the summer period affects the traffic
safety situation on these roads only. By
compa-ring the change in the traffic safety situation
on these roads with the change in the traffic
safety situation on roads where the speed limit
was 90 km/h in both 1988 and 1989 (control
roads), the effect of reducing the speed limit can be estimated.
Hypothesis 2: Lowering the speed limit on 110 km/h roads to 90
km/h during the summer period also affects the
traffic safety situation on roads with a speed
limit of 90 km/h. By comparing the change in the
traffic safety situation on the earlier 110 km/h
roads and on 90 km/h roads with the change in the
traffic safety situation on roads where the speed
limit was 70 km/h in 1988 and 1989, the total
traffic safety effect can be estimated. The total
effect is accordingly understood to be all
informational measures, public discussion in the media, surveillance, etc. and the lowering of the
speed limit on 110 km/h roads.
The estimated effects on the basis of the two hypotheses are
shown in tables 3 and 4.
Table 3. Estimated effect on the number of personal injury
accidents and casualties occurring on 110 km/h roads
when the speed limit is reduced from 110 km/h to 90
km/h, obtained by a comparison with the traffic safety situation on 90 km/h roads. Confidence
interval for the level of significance: 5% 1). ROAD CHANGE IN CHANGE IN SPEED LIMIT PERSONAL INJURY ACCIDENTS CASUALTIES
% %
110 -- 90 -15.0 (-32.7, +6.8) 1) -ll.0 (-25.4, +6.2) 1)
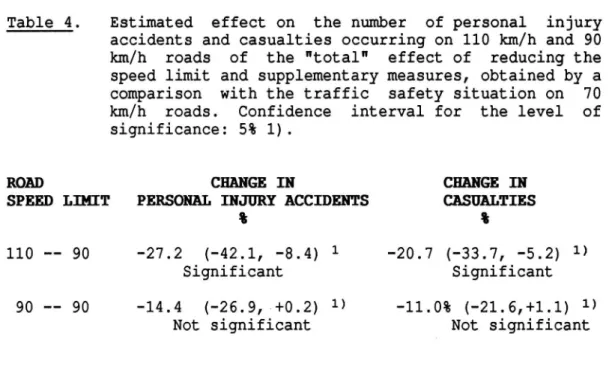
Table 4. Estimated effect on the number of personal injury accidents and casualties occurring on 110 km/h and 90
km/h roads of the "total" effect of reducing the
speed limit and supplementary measures, obtained by a
comparison with the traffic safety situation on 70
km/h roads. Confidence interval for the level of
significance: 5% 1).
ROAD CHANGE IN CHANGE IN SPEED LIMIT PERSONAL INJURY ACCIDENTS CASUALTIES
% %
110 -- 90 -27.2 (-42.1, -8.4) 1 -20.7 (-33.7, -5.2) 1
Significant Significant
9O -- 90 -14.4 (-26.9,-+O.2) 1) -ll.0% (-21.6,+1.l) 1)
Not significant Not significant
The effect on personal injury accidents and casualties differs
because the number of casualties per personal injury accident
decreased on the 90 km/h and 70 km/h roads between 1988 and 1989 at the same time as the number of_casualties per personal injury accident increased on the 110 km/h roads.
Table 5 shows the absolute changes in the number of personal
injury accidents and casualties on 110 km/h, 90 km/h, 70 km/h
and 50 km/h roads in the summer period of 1989 as compared with
the summer period in 1988.
l.Confidence intervals calculated according to Woolf s method.
(Case Control Studies, Oxford University Press 1982, James J.
Schlesselman.) VTI RAPPORT 358A
Table 5. Changes in the number of personal injury accidents (PO) and casualties (S) on roads with different speed
limits in the summer period of 1989 as compared with
the summer period of 1988. SPEED LIMIT 110 90 70 50 YEAR PO S PO S PO S PO S 1988 222 378 676 1085 591 926 125 168 1989 169 290 605 935 618 896 118 171 90 CHANGE Number -53 -88 -71 -150 +27 -30 -7 +3 Per cent -24% -23% -11% - 14% + 5% - 3% -6% +2%
From Table 5 it is evident that the reduction in personal injury accidents on 110 km/h roads where the speed limit was reduced to
90 km/h is less than on other 90 km/h roads. In regard to the
number of casualties, the reduction is appreciably greater on 90
km/h roads. Expressed as a percentage, on the other hand, the
reductions are greatest on the 110 km/h roads. Changes on the 70
km/h and 50 km/h roads are small.
Even though the number of personal injury accidents and
casualties is comparatively small on 110 km/h roads, it may be
of interest to see what changes took place on different types of road between 1988 and 1989.
Table 6. Changes in the number of personal injury accidents
(PO) and casualties (S) on motorways, arterial roads
and other roads with a speed limit of 110 km/h in the
summer period of 1989 as compared with the summer
period of 1988.
YEAR .MDTORHAY ARTERIAL ROAD OTHER
PO S P0 S» PO S 1988 (110) 109 181 31 65 82 132 1989 (90) 74 116 23 53 72 121 90 Change Number -35 -65 - 8 -12 -10 -11 Per cent -32% -36% -26% -18% -12% - 8%
In spite of the low accident and casualty rates it is obvious
that the biggest change has occurred on motorways. It is also on
these roads that the biggest speed limit reductions have been
made.
To sum up, the above description of changes in traffic safety
during the summer period in 1989 as compared with 1988 shows a
result which displays extremely good congruity with what was to
be expected on the basis of previous experience. However, it
must be admitted that the accident rates and casualty rates,
particularly on the 110 km/h roads studied, are low in
comparison with those on 90 km/h and 70 km/h roads. It is also
important to point out that the different groups of roads are of differing standard.
2.3 Analysis of fatal accidents and deaths
Table 7 shows the number of fatal accidents and deaths occurring
on stretches of main roads with different speed limits during
the summer periods each year from 1985 to 1989.
Table 7. Number of fatal accidents (DO) and number of deaths
(D) on stretches of main roads with different speed
limits during the summer periods each year from 1985
to 1989. SPEED LIMIT 110 90 70 50 TOTAL YEAR DO D DO D DO D DO D D0 D 1985 11 12 45 65 3O 31 - - 86 108 1986 15 19 57 68 34 34 5 5 111 126 1987 19 21 60 69 29 33 7 7 115 130 1988 14 16 61 69 3O 34 3 3 108 122 1989 15 23 35 42 31 36 5 5 86 106 90
Fatal accidents and deaths occurring on all main roads during
the summer period in 1989 were fewer in number than during the
corresponding period of time each year between 1986 and 1989.
The reduction is attributable solely to 90 km/h roads where the
number of fatal accidents decreased by more than 40%. It should
be noted that the number of fatal accidents on 110 km/h rOads
during the summer period increased from 14 in 1988 to 15 in 1989
while the number of deaths in fatal accidents increased from 16
to 23.
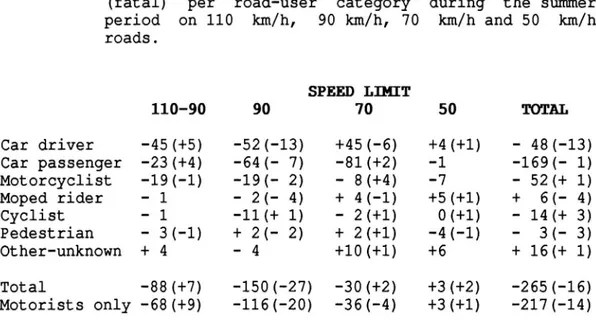
2.4 NUmber of casualties (fatal) according to roadruser category.
Table 8 summarizes the changes between 1988 and 1989 in the
number of casualties (fatal) occurring among different road-user
10
Table 8. Change between 1988 and 1989 in number of casualties
(fatal) per road-user category during the summer
period on 110 km/h, 90 km/h, 70 km/h and 50 km/h roads. SPEED LIMIT 110 90 90 70 50 TOTAL Car driver -45(+5) -52(-13) +45(-6) +4(+1) - 48(-13) Car passenger -23(+4) -64(- 7) -81(+2) -l -169(- 1) Motorcyclist -19(-1) -19(- 2) - 8(+4) -7 - 52(+ 1) Moped rider - 1 - 2(- 4) + 4(-1) +5(+1) + 6(- 4) Cyclist - 1 -11(+ 1) - 2(+1) O(+1) - 14(+ 3) Pedestrian - 3(-1) + 2(- 2) + 2(+1) -4(-1) - 3(- 3) Other-unknown + 4 - 4 +10(+1) +6 + 16(+ 1) Total -88(+7) -150(-27) -30(+2) +3(+2) -265(-16) Motorists only -68(+9) -ll6(-20) -36(-4) +3(+l) -217(-14)
Motorists and motorcyclists account for most of the reduction in casualties during the summer period in 1989 as compared with the
summer period in 1989. In regard to deaths, the number of
motorists killed increased on the earlier 110 km/h roads but decreased on the 70 km/h and 90 km/h roads.
11
3 PERSONAL INJURY ACCIDENTS AND INJURY RISKS ON INTERrEUROPEAN HIGHWAYS
Most of the traffic on the earlier 110 km/h roads consists of
traffic using Inter-European Highways. Traffic data for these
roads is available on an annual basis. The annual traffic
mileage on earlier 110 km/h roads and on 90 km/h stretches of
Inter-European Highways according to the National Road
Administration is shown in the table below. Changes in speed
limits and the annual increase in traffic volume have been taken
into account.
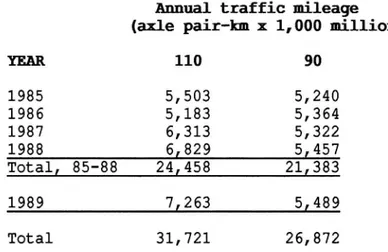
Table 9. Estimated traffic mileage on 110 km/h and 90 km/h
stretches of Inter-European Highways in the years
1985-1989. Source: National Road Administration. Annual traffic mileage
(axle pair-km.x 1,000 million)
YEAR 110 90 1985 5,503 5,240 1986 5,183 5,364 1987 6,313 5,322 1988 6,829 5,457 Total, 85-88 24,458 21,383 1989 7,263 5,489 Total 31,721 26,872
It will be evident from the table that the volume of traffic on
110 km/h roads has increased more than on '90 km/h roads in the
Inter-European Highway network. Note that the 1989 figures apply
to roads which before June 22 had a speed limit of 110 km/h.
The table below shows the number of personal injury accidents
and casualties on 110 km/h and 90 km/h sections of
Inter-European Highways occurring during the summer periods each year
from 1985 to 1989.
12
Table 10. Number of personal injury accidents and number of
casualties on 110 km/h and 90 km/h sections of
Inter-European Highways during the summer periods
each year from 1985 to 1989. Source: National Road
Administration.
YEAR NUMBER OF PERSONAL NUMBER OF CASUALTIES INJURY ACCIDENTS 110 90 110 90 1985 114 146 183 263 1986 139 161 225 289 1987 118 146 180 252 1988 174 154 297 259 Total 545 607 885 1063 1989 141 152 241 241
On the basis of the above tables, it is possible to calculate
the change in the risk of personal injury, the number of
personal injury accidents per traffic mileage, the risk of
injury, and the number of casualties per traffic mileage on 110
km/h and 90 km/h roads during the summer period in 1989 as
compared with the summer period in 1988 and also as compared
with the average for the summer period each year from 1985 to
1988.
Table 11. Change in risks during the summer in 1989 as compared
with the summer in 1988.
110 90 90-90
Personal injury accident risk -24% -2%
Injury risk -24% -8%
The personal injury accident risk and the injury risk both
decreased by 24% on earlier 110 km/h roads during the 1989
summer period as compared with the 1988 summer period. The
corresponding respective decrease on 90 km/h roads is 2% and 8%.
13
Table 12. Change in risks during the summer period in 1989 as
compared with the summer periods each year from 1985
to 1988.
110-90 90-90
Personal injury accident risk -13% - 2%
Injury risk - 8% -12%
Also when compared with the personal injury accident risk for
all summer periods from 1985 to 1989, the personalinjury risk
has decreased to a greater extent on the earlier 110 km/h roads
than on the 90 km/h roads. A corresponding comparison in respect
of the risk of injury shows that it decreased to a somewhat
greater extent on the 90 km/h roads. This is largely due to the
fact that the risk level on the earlier 110 km/h roads was low
in the summer of 1987.
Note that the above risk calculation is based on the estimated
annual traffic mileage and presupposes that the summer period s
proportion of the total annual traffic mileage is the same in
14
4 CHANGES IN SPEED DURING THE SUMMER PERIOD BETWEEN
1988 AND 1989
On the instructions of the National Road Safety Office, the Road and Traffic Research Institute has also followed the development of speeds on roads with different speed limits in 1988 and 1989.
The change in speed on roads where the speed limit was reduced
from 110 km/h to 90 km/h was of particular interest. The
measurements were carried out in both years at the same places
and at the same times in July.
Table 13. Estimated speed changes on different types of road
and on roads with different speed limits during July
in 1988 and 1989. Passenger cars.
SPEED LIMIT CHANGE IN MEAN SPEED
ROAD TYPE 1988 1989 70 -- 70 - 2.2 km/h + 1.1 km/h 90 -- 90 - 2.5 km/h + 0.6 km/h 110 -- 90 -11.1 km/h + 1.2 km/h Two-lane roads 110 -- 90 -14.4 km/h + 2.6 km/h Motorways
Vehicle speeds showed a reduction on all main roads in July 1989
as compared with July 1988. At the same time it is obvious that
the reduction in speed on roads where the limit was reduced from
110 km/h to 90 km/h was considerable, above all on motorways.
The reduction in speed was greater than expected. Compared with
a similar measure in 1979 when the 110 km/h limit was reduced to
90 km/h in order to save energy, the reduction in speed is even
slightly greater. This indicates that traffic safety arguments
may carry the same weight as energy saving arguments.
15
Table 14. Estimated changes in speed during the summer period
in 1979 and 1989 on motorways and two-lane roads when
the speed limit was reduced from 110 km/h to 90 km/h, and on two-lane roads with an unchanged speed limit
of 90 km/h.
110-90 90-90
MOTORHAI TWO-LANE ROAD Two LANE ROAD 1979 -12 km/h - 7 km/h -2 km/h
1989 -l4.4 km/h -ll.l km/h -2.5 km/h
The estimated changes are not fully comparable since the change
in speed during the summer of 19792 is based on measurements
taken immediately before the speed limit was reduced while the
speed change in 1989 is based on speed data from the summer
period in 1988. If this is taken into account, the changes in
speed will probably be of the same magnitude in both 1989 and
1979.
2.Reduction of the maximum permissible speed from 110 km/h to 90
km/h during the summer of 1979. Effect on speeds and fuel
consumption. VTI bulletin 190, 1980.
16
5 ASSESSMENT OF THE DEVELOPMENT OF TRAFFIC SAFETY ON MEIN ROADS IN THE SUMMER.OF 1989 AS COMPARED WITH THE SUMMER OF 1989 FROM THE 'VIEWPOINT OF WELFARE
ECONOMICS
On the basis of the National Road Administration's economic
values of deaths, serious injuries and slight injuries resulting
from road accidents, the change in the traffic safety situation
prevailing in the summer of 1989 as compared with the summer of
1988 can be described.
National Road Administration evaluation in respect of traffic
casualties in 1990: Am
Killed SEK 7,400,000
Seriously injured SEK 2,552,000
Slightly injured SEK 172,000
B.
Injured, regardless
of consequences of
injury SEK 1,390,000
Table 15. Change between the number of casualties of different
types and the estimated change in personal injury
costs in the summer of 1989 as compared with the
summer of 1988.
CHANGE IN NUMBER CHANGE IN INJURY COSTS
OF CASUALTIES (SEK MILLIONS)
AS IN AS IN
SPEED KILLED SERIOUSLY SLIGHTLY TOTAL A B
LLMIT INJURED INJURED INJURED
110-90 + 7 -28 - 67 - 88 - 31.2 -122.3
90-90 -27 -22 -101 -150 -273.3 -208.5
70-70 + 2 -42 + 10 - 30 - 90.7 - 41.7
50-50 + 2 + 2 - 4 + 3 + 26.9 + 4.2
Total -16 -87 -l62 -265 -368.3 -368.3
17
As will be evident from the above, the change in the number of
deaths is an important factor in assessing the change in injury
costs for different road environments. This applies above all to
110 km/h roads. To a certain extent, the type of injury
sustained is often due to purely fortuitous circumstances and it
is therefore reasonable to use the average cost per traffic
accident casualty. The total injury cost has decreased by SEK
370 million from the summer of 1988 to the summer of 1989.
The table below shows the increase in journey-time cost as a
result of the lower speeds on 110 km/h, 90 km/h and 70 km/h
roads. Journey-time cost per hour has been estimated at SEK 60,
as against the usual SEK 75 in 1990 prices, since the proportion
of business journeys, commercial journeys and trucks is much
lower during the summer period than the average for the year.
Increase in journey-time cost in the summer of 1989 as compared
with the summer of 1988 (1990 prices)
110 km/h roads SEK 100 million 90 km/h roads SEK 100-105 million 70 km/h roads SEK 60 million
Total SEK 260-265 million
The above values have been calculated on the basis of the
following traffic mileages during the summer period: 110 km/h roads: 1,400 million vehicle kilometres
90 km/h roads: 5,500 million vehicle kilometres 70 km/h roads: 3,000 million vehicle kilometres
which comprises 1/6th of the annual traffic mileage in these
road environments.
18
To sum up, the increase in journey-time costs is accordingly
much smaller than the reduction in injury costs. The decrease in
vehicle costs is of the same magnitude as the increase in
journey-time costs, which means that motorists on the whole
reduced their vehicle costs by the same amount as their
journey-time costs increased on account of the lower speeds.
The cost of the labour and materials involved in implementing
the measure itself - new signs, information activities, etc.
-is not likely to exceed SEK 15 million. From the viewpoint of
welfare economics, this means that the result of reducing the
speed limit in the summer of 1989 was highly favourable, taking the evaluations used in the calculations as a starting point.
It is important to note that the above calculations must of
necessity be stereotyped. The purpose is therefore primarily to
show the magnitude of different costs in the road transport
sector when assessingthe effect of speed-reducing measures from the viewpoint of welfare economics.