HYDROGEN – THE FUTURE
FUEL FOR CONSTRUCTION
EQUIPMENT?
A well to tank analysis of hydrogen powered machine applications at Volvo CE
ANDREAS SJÖDIN
ELIAS EKBERG
School of Business, Society and Engineering
Course: Degree project in energy engineering Course code: ERA402 and ERA403
Credits: 30
Supervisor MDH: Jakub Jurasz Supervisor Volvo CE: Johan Ask Examiner: Valentina Zaccaria Customer: Volvo CE Eskilstuna
ABSTRACT
As the world is moving towards a more sustainable energy perspective, construction equipment sees the requirement to change its current way of operation with fossil fuels to reduce its environmental impact. In order to pursue the electrification of construction equipment a dense power source is essential, where hydrogen powered fuel cells have the potential to be a sufficient energy source. This thesis work is carried out in order to find the least CO2 emissive pathway for hydrogen to various construction sites. This is done by
collecting state of the art data for production, processing and storage technologies. With the assembled data an optimization model was developed using mixed integer linear
programming.
The technologies found that showed promising adaptability for construction equipment in the state of art regarding production were steam methane reforming (SMR), proton exchange membrane electrolyser (PEMEC) and alkaline electrolyser. They showed promising
characteristics due to their high level of maturity and possibility for reducing the environmental impact compared to the current operation. To investigate the hydrogen pathway and its possibilities, four scenarios were created for four types of construction sites. The scenarios have different settings for distance, grid connection and share of renewables, where the operations have various energy profiles that is to be satisfied.
The optimal hydrogen pathway to reduce the CO2 emissions according to the model, were
either PEMEC on-site or gaseous delivery of SMR CCS produced hydrogen. The share of renewables in the energy mix showed to be an important factor to determine which of the hydrogen pathways that were chosen for the different scenarios. Moreover, in the long run PEMEC was considered to be a more sustainable solution due to SMR using natural gas as feedstock. It was therefore concluded that for a high share of renewables PEMEC was the optimal solution, where for a low share of renewables SMR CCS produced hydrogen was optimal as the energy mix would result in a more emissive operation when using PEMEC. Keywords: Hydrogen, Well to tank, Hydrogen storage, MILP
PREFACE
This master thesis has been exciting and insightful work within the area of study. We would like to extend our gratitude to our supervisors Jakub Jurasz and Johan Ask, who both provided valuable advice, constructive criticism and helpful contributions which lead to entertaining and interesting meetings.
CONTENT
1 INTRODUCTION ...1
1.1 Background ... 2
1.1.1 Hydrogen ... 3
1.1.2 Well to tank ... 3
1.1.3 Steam methane reforming ... 4
1.1.4 Partial Oxidation Reforming ... 5
1.1.5 Autothermal Reforming ... 6
1.1.6 Gasification ... 6
1.1.7 Alkaline electrolysis ... 6
1.1.8 Proton exchange membrane electrolysis... 7
1.1.9 Solid oxide electrolysis ... 8
1.1.10 Fuel cells ... 9
1.1.11 Compressed hydrogen gas ...10
1.1.12 Liquefied hydrogen ...11 1.2 Problem ...12 1.3 Purpose/Aim ...13 1.4 Research questions ...13 1.5 Delimitation ...14 2 METHOD ... 14 2.1 Selection of method ...14 2.2 Literature assemblage ...15 2.3 Modelling...16 3 THEORETICAL FRAMEWORK ... 17 3.1 Reforming methods ...17
3.1.1 Steam methane reforming ...18
3.1.2 Additional reforming technologies ...19
3.1.3 Gasification technologies ...20
3.2.2 Economic characteristics ...22
3.3 Pressurized hydrogen storage ...23
3.4 Cryogenic liquefied hydrogen ...26
3.5 Fuelling interface ...26
3.1 Field study – hydrogen pathways ...27
3.2 Summary literature review ...27
4 CURRENT STUDY ... 29 4.1 Scenario management ...29 4.1.1 Operations ...30 4.2 Input data ...32 4.2.1 Hydrogen demand ...33 4.3 Assumptions ...34 4.4 Optimization setup ...35 4.4.1 Cost equations ...37 5 RESULTS ... 39
5.1 Mine evaluation scenario 1-4 ...40
5.2 Light evaluation scenario 1-4 ...41
5.3 Road evaluation scenario 1-4 ...42
5.4 Quarry evaluation scenario 1-4 ...43
5.5 CO2 & Cost evaluation ...45
5.1 Sensitivity analysis ...46 6 DISCUSSION... 47 6.1 Site assessment ...47 6.2 Sensitivity analysis ...49 6.3 Method evaluation ...50 6.4 Assumptions discussion ...50 7 CONCLUSIONS ... 51
8 SUGGESTIONS FOR FURTHER WORK ... 52
9 REFERENCES ... 54
APPENDIX 1 REFERENCES 3.6 SUMMARY LITERATURE REVIEW APPENDIX 2 CODE
LIST OF FIGURES
Figure 1 Steam reforming process ... 4
Figure 2 Schematic of alkaline electrolyser... 7
Figure 3 Schematic of PEM electrolyser ... 8
Figure 4 Schematic of solid oxide electrolyser ... 9
Figure 5 Schematic PEM fuel cell ... 9
Figure 6 Cryo-compressed hydrogen storage schematic ... 11
Figure 7 Simplified schematic of liquefaction process ...12
Figure 8 Energy densities for various sources ... 13
Figure 9 Model schematic ... 15
Figure 10 Hydrogen production with natural gas as feedstock ...19
Figure 11 Presentation of type of pressure vessels ... 24
Figure 12 well to tank analysis ... 29
Figure 13 Flowsheet of energy profiling ... 34
Figure 14 Colours representing different production options ... 39
Figure 15 Total hydrogen demand for various sites ... 39
Figure 16 Top left: SE, 10 km; Top right PL, 10 km; Bottom left, EU28, 10 km; Bottom right; EU28, 500 km ... 40
Figure 17 Top left: SE, 10 km; Top right PL, 10 km; Bottom left, EU28, 10 km; Bottom right; EU28, 500 km ...41
Figure 18 Top left: SE, 10 km; Top right PL, 10 km; Bottom left, EU28, 10 km; Bottom right; EU28, 500 km ... 42
Figure 19 Top left: SE, 10 km; Top right PL, 10 km; Bottom left, EU28, 10 km; Bottom right; EU28, 500 km ... 43
Figure 20 scenario 3 without electrolyser ... 44
Figure 21 Top/Bottom left: Energy mix 57g CO2/kWh; Top/Bottom right, Energy mix 58g CO2/kWh ... 46
LIST OF TABLES
Table 1 Production characteristics ... 28Table 2 Machine nomenclature ... 30
Table 3 Scenario matrix ... 31
Table 4 Input data ... 33
Table 5 Emitted CO2 ... 45
NOMENCLATURE
Symbol Description Unit
Efficiency %
Bar Pressure N/m2
HHV Higher heating value MJ/kg
LHV Lower heating value MJ/kg
m0 Initial mass of tank kg
mmax Maximal capacity of tank kg
mmin Minimal mass in tank kg
P Power J/s Pa Pressure N/m2 Q Heat J W Work J
ABBREVIATIONS
Abbreviation Description AE Alkaline electrolyser AR Autothermal reforming BEV Battery electrical vehicle CAPEX Capital expenditures CcH2 Cryo-compressed hydrogenCCS Carbon capture and storage CH2 Compressed hydrogen
FCEV Fuel cell electric vehicle GHG Greenhouse gas
H2P Hydrogen density to power ratio HHV Higher heating value
HSS Hydrogen storage system LCA Life Cycle Assessment
MILP Mixed integer linear programming NG Natural gas
Abbreviation Description LH2 Liquid hydrogen
LHV Lower heating value OPEX Operational expenditures
PEMEC Proton-exchange membrane/Polymer electrolyte membrane electrolyser cell
PEM Proton-exchange membrane POX Partial oxidation reforming RES Renewable energy source SEC Specific energy consumption SMR Steam methane reforming SOC State of charge
SOEC Solid oxide electrolyser cell SR Steam reforming
WGS Water gas shift WTT Well to tank WTW Well to wheel
DEFINITIONS
Definition Description
Endothermic A chemical reaction that absorbs energy from the surroundings
Exothermic A chemical reaction that releases energy
Well to tank Analysis of emissions for the entire chain from well to tank for a fuel
1 INTRODUCTION
With today’s reliance on fossil fuel powered applications and increased awareness of climate impact, the advancement of emission free alternatives has shown promising development. The push of electrical vehicles and integration of energy storage capabilities has expanded greatly, where production and installation of storage systems attempts to satisfy the
increasing demand (Killer et al., 2020; Koohi-Fayegh & Rosen, 2020). Batteries have proven useful in several applications due to flexibility, cost and availability (Srinivasan, 2006, p.95). However, batteries struggle when it comes to high power intensive operations due to high discharging rates and charging need as it leads to a rapid reduction in overall lifetime (Araujo et al., 2017; Armenta-Deu et al., 2019), which provides possibilities for other technologies to emerge.
Hydrogen energy has matured during the latest years by seeing development in different areas such as transport, fuel cells and storage possibilities (Hirscher et al., 2019). As with other technologies there are some obstacles regarding storage, infrastructure and obtaining the hydrogen (Abdalla et al., 2018). Barriers for the hydrogen economy are its energy requirement for processing and costly materials, infrastructure readiness and sustainable production methods (Durbin & Malardier-Jugroot, 2013; Zheng et al., 2012)
This study will investigate the potential of a hydrogen powered construction equipment at various sites and its storage capabilities and ability to satisfy the construction equipment’s power demand. Construction equipment which consists of excavators, haulers, rollers, and loaders usually operates at peak power during processes where the need of a dense power source would be beneficial. The construction machines disadvantages are the difficulties regarding high emissions, low efficiency and high fuel consumption. Hence, the complete electrification with battery as storage equipment will provide obstacles in satisfying the energy intense operations of construction machinery in the aspects of charging, discharging and peak power potential (Durbin & Malardier-Jugroot, 2013; T. Li et al., 2018).
Currently Volvo CE has launched a campaign for its first zero-emissions battery based
compact excavators and wheel loaders, which is to be commercially available from mid-2020. Considering the obstacles with battery storage, the charging time for these machines are currently 1-2 hours to reach an 80 % charge for a 20 – 39 kWh capacity (Volvo CE, 2019). When comparing the aspect of charging with hydrogen as an energy carrier, the time for re-fuelling of heavy-duty vehicles according to current standards are mere minutes (7.2 kg/min or app. 240 kWh/min). (SAE International, 2014; Wen et al., 2020).
When considering electrification of heavy-duty vehicles, the usual challenge is to overcome range and weight. There are several technologies that are under rapid development to face these challenges such as hybrid vehicles, battery electric vehicles and range-extender electric
previously mentioned the electrification of construction equipment faces difficulties regarding high power outtakes under short periods of time and strained intervals for re-fuelling which makes batteries a less suitable option for these kinds of operations. With emission legislations becoming stricter it encourages manufacturers to further investigate electrification possibilities of their current business and determine its
compatibility (IEA, 2019a). The construction equipment investigated in this study are from Volvo CE which has a large variety in their equipment’s size, demand and applications. The study will then look at the entire hydrogen supply chain and through optimization methods determine the least emission intensive pathway of hydrogen for various construction sites.
1.1 Background
This section will present the relevant technological background for this thesis work. The background will contain hydrogen production technologies, hydrogen applications and storage methods. The technologies principle and way of operation will be described and provide fundamental knowledge about the subject.
The procedure of producing hydrogen can be based on several techniques. Hydrogen generation can be produced by reforming hydrocarbons, biomass/coal gasification or electrolysis of water. Reforming methods are based on converting hydrocarbons into a hydrogen-rich gas where the hydrogen later is separated and purified. The three major reforming processes are steam reforming (SR), partial oxidation (POX) and autothermal reforming (AR) (O’Hayre et al., 2006, p.295; Srinivasan, 2006, p.384). Gasification of biomass/coal is based on heating a fuel in a sub-stoichiometric environment to produce a hydrogen-rich syngas. Three common types of gasification technologies are steam
gasification, air gasification and oxygen gasification (Jeong et al., 2020; Srinivasan, 2006, p.383; Yaning Zhang et al., 2019). Production of hydrogen by electrolysis is done by applying a direct current to the cathode which enables the split of water molecules into hydrogen and oxygen. The most developed electrolysers are the proton exchange membrane (PEM), alkaline, and solid-oxide electrolysers (SOEC) (Srinivasan, 2006, p.402).
To utilize hydrogen in operations a proper storage of the fuel is necessary. Many different storage techniques have been investigated through the years which have resulted in many options with different key challenges, like boil off, low efficiency and high cost (Barthelemy et al., 2017; Moradi & Groth, 2019). The different storage systems can be divided in to two categories in how the hydrogen is stored, physical storage and material-based storage with additional subcategories of stationary and mobile storage. Physical storage includes compressed hydrogen gas and liquefied hydrogen. The material-based storage systems are based on storing hydrogen in metals and chemical compounds. The material based
techniques are not likely to be in use for commercial purposes in a close future and will not be discussed in this report (Moradi & Groth, 2019).
1.1.1 Hydrogen
Hydrogen is an abundant and well-known energy source which is considered both clean and renewable due to its emission only being water when combusted or used in fuel cell
applications. (Abdalla et al., 2018). Hydrogen is widely used as an energy carrier or to store energy with potential of substituting the depleting fossil-fuelled infrastructure today’s energy applications are dependent on. Hydrogen is also beneficial due to it being a dense power source with a lower heating value of 120 MJ/kg and a higher heating value of 142 MJ/kg (Wester, 2015). The abundance of hydrogen is not found in its useful state in nature even though its vast quantity is stored in sea water, where largest potential of hydrogen
attainability can be seen. Otherwise, hydrogen is usually found in hydrides (the anion of hydrogen, 𝐻−), gases or other compounds (Abdalla et al., 2018; Stern, 2018).
The use of hydrogen applications has increased in popularity during the 21st century which
can be seen in the first public instalment of a hydrogen fuel station in the UK 2011 and development of a hydrogen powered train in Germany 2018 (Din & Hillmansen, 2018). Furthermore, hydrogen is a hot topic and developments regarding material for storage, production, performance and storage techniques has seen promising development and presented key challenges for future research in the fields of transport, storage and
infrastructure (Koohi-Fayegh & Rosen, 2020; Sharaf & Orhan, 2014; Xueping et al., 2019). Hydrogen applications for heavy industry and construction equipment is a fairly unexplored area. Recently in March 2020, Hyundai construction equipment together with Hyundai motor group has begun development of hydrogen powered construction equipment (Fuel Cells Bulletin, 2020). According to the article there are limitations of lithium ion batteries regarding increase of battery capacity and structural issues for construction equipment. The development of hydrogen fuel cells however is showing promising technical aspects when examining the sizing of the total system capacity which makes them appealing for
construction equipment applications.
1.1.2 Well to tank
Well to wheel (WTW) analysis is a commonly used term in the automotive business which opts to analyse the entire energy flow for a fuel. The parameters that often are being analysed is greenhouse gas (GHG) emissions, energy efficiency and cost (Woo et al., 2017). A WTW analysis differs from a life cycle assessment (LCA) thus it only focuses on the emissions directly connected to the fuel, LCA is also taking construction of cars and end of lifetime in to consideration (European commission, 2016). A WTW chain differs between different fuels and applications. Fuels that are produced and used on site can have a shorter chain as no transportation is necessary. A typical WTW chain for hydrogen in electric vehicles is described in the following way (E. Yoo et al., 2018).
𝑈𝑝𝑠𝑡𝑟𝑒𝑎𝑚 → 𝐻2 𝑝𝑟𝑜𝑑𝑢𝑐𝑡𝑖𝑜𝑛 → 𝐶𝑜𝑚𝑝𝑟𝑒𝑠𝑠𝑖𝑜𝑛 & 𝑑𝑖𝑠𝑡𝑟𝑖𝑏𝑢𝑡𝑖𝑜𝑛 → 𝑉𝑒ℎ𝑖𝑐𝑙𝑒 𝑜𝑝𝑒𝑟𝑎𝑡𝑖𝑜𝑛 Upstream refers to the processes that is done before the hydrogen production is performed.
reforming is used to produce hydrogen the extraction, treatment and transportation of natural gas must be considered.
Well to wheel can be divided in two parts, well to tank and tank to wheel (TTW). Well to tank is referring to the parts in the chain between the well and the final storage, i.e. the processes after the storage is excluded. TTW refers to the steps between the storage tank and the consumption in the vehicle (European commission, 2016)
1.1.3 Steam methane reforming
Steam methane reforming (SMR) is a widely used method for large-scale hydrogen
production (Sharma et al., 2019), meeting approximately 50 % of global demand (Dincer & Acar, 2015a). The concept of steam methane reforming is the reaction of steam and methane to eliminate impurities from the natural gas which usually is the feedstock. The catalysts in the steam-reforming process are sensible to sulphur compounds which presents the need for desulphurization. The natural gas is then mixed with the steam in a reformer which contains a catalyst typically consisting of nickel or another non-precious metal, where a typical effectiveness of the catalyst is 5 % (Abdalla et al., 2018). In the reformer an endothermic reaction takes place where heat is added through combustion of a fuel e.g. natural gases. Operating temperature and pressure usually lie within the interval of 750 °C to 850 °C and 3-25 bar (Abdalla et al., 2018; Sharma et al., 2019; Srinivasan, 2006, p.384).
Figure 1 Steam reforming process inspired by (Sharma et al., 2019)
The endothermic reaction (1):
Equation 1
𝐶𝐻4(𝑔)+ 𝐻2𝑂(𝑔)+ 𝐻𝑒𝑎𝑡 ↔ 𝐶𝑂(𝑔)+ 3𝐻2(𝑔)
Additionally, the following reactions are taking place in the reformer (2), (3) and (4):
Equation 2
𝐶𝑂(𝑔)+ 𝐻2𝑂(𝑔)↔ 𝐶𝑂2(𝑔)+ 𝐻2(𝑔)+ 𝐻𝑒𝑎𝑡
Equation 3
Equation 4
2𝐶𝑂(𝑔)↔ 𝐶𝑂2(𝑔)+ 𝐶(𝑠)+ 𝐻𝑒𝑎𝑡
Reaction (3) and (4) results in coke solids on the catalyst which is reduced by excess steam in the reformer to further encourage reaction (1) and (2) and prevent coke deposition (Sharma et al., 2019). The outlet of the reformer is syngas which consists of 𝐶𝑂, 𝐶𝑂2, 𝐻2, 𝐻2𝑂 and 𝐶𝐻4 that has not been reformed. Furthermore, to increase the 𝐻2 yield the 𝐶𝑂 can be shifted by the exothermic reaction (2) which is a water-gas shift reaction. To further purify the
hydrogen a pressure swing adsorption (PSA) unit is installed where the shifted hydrogen-rich gas is produced with a purity of 𝐻2>99.99% by mole. (O’Hayre et al., 2006, p.306).
Advantages of steam reforming is the highest methane yield but requirements of thermal management to provide heat for the reactions. Also, the process is sensible to the type of fuel used (O’Hayre et al., 2006, p.295).
1.1.4 Partial Oxidation Reforming
Partial oxidation reforming (POX) is an exothermic reaction that undergoes the mixture of oxygen to partially oxidize/combust fuels containing hydrocarbons into 𝐶𝑂 and 𝐻2
(Srinivasan, 2006, p.389). In POX the fuel is combusted with less than the stoichiometric amount of 𝑂2 needed for complete combustion providing the desired product of 𝐻2 and other gases like 𝐶𝑂 as a by-product. In reactions (5), (6) and (7) examples of complete and
incomplete combustion of propane are shown:
Equation 5
𝐶3𝐻8+ 5𝑂2↔ 3𝐶𝑂2+ 4𝐻2𝑂 The incomplete combustion that obtains 𝐻2 and 𝐶𝑂:
Equation 6
𝐶3𝐻8+ 𝑥𝑂2 ↔ 𝑦𝐶𝑂 + 𝑧𝐻2 Balancing according to the law of conservation of mass:
Equation 7
𝐶3𝐻8+ 1.5𝑂2↔ 3𝐶𝑂 + 4𝐻2
Comparing reaction (5) and (7) the stoichiometric need of 𝑂2 is 5 mol 𝑂2 / mol 𝐶3𝐻8, which in reaction (7) the quantity of 𝑂2 is less than the required amount for complete combustion. Benefits with POX is quick response time due to exothermic reactions and the disadvantage is a fairly low 𝐻2 production and high emissions (O’Hayre et al., 2006, p.295). The 𝐻2 yield could be increased with the same procedure as the SMR method, by the water-gas reaction shifting of the 𝐶𝑂 according to reaction (2) (Srinivasan, 2006, p.389).
1.1.5 Autothermal Reforming
Autothermal reforming (AR) is the combination of SMR reaction, POX reaction and water-gas shifting (WGS) in a single process. The process combines the reactions from AR such that they proceed in the same chemical reactor and the SMR and WGS required heat
(endothermic) is provided by the exothermic POX reaction (O’Hayre et al., 2006, p.299; Srinivasan, 2006, p.390). The AR integrates the methods from SMR by using steam as a reactant and by using sub-stoichiometric amount of 𝑂2 it includes the POX methodology. (O’Hayre et al., 2006, p.299). The general reaction for autothermal reforming is:
Equation 8 𝐶𝑥𝐻𝑦+ 𝑧𝐻2𝑂 + (𝑥 − 1 2𝑧) 𝑂2↔ 𝑥𝐶𝑂2+ (𝑧 + 1 2𝑦) 𝐻2=> 𝐶𝑂, 𝐶𝑂2, 𝐻2, 𝐻2𝑂
Reaction (8) should be energy neutral i.e. neither endothermic nor exothermic. Where the steam to carbon ratio should be chosen as z/x so that the reaction become energy neutral. Advantages of AR is simplification of thermal management by combining SMR’s endothermic reactions with POX’s exothermic reactions. Disadvantages is low hydrogen yield and careful balancing of exothermic and endothermic reactions.
1.1.6 Gasification
Hydrogen can be produced by gasification processes which are based on different principles. The process takes biomass or other feedstock and converts it to a combustible gas. The gasification can be initiated by different methods such as oxygen gasification, air gasification and steam gasification (Yaning Zhang et al., 2019). The most efficient conversion method for biomass according to studies is steam gasification due to other agents provides a lower heating value due to dilution with nitrogen (air gasification) and consumption of combustible gases during the process (oxygen gasification) (Baratieri et al., 2008; Gao et al., 2008;
Hosseini et al., 2012; Zhang et al., 2019).
To produce hydrogen through gasification the process can use biofuels, coals and coke. Biofuels has become a hot topic for producing hydrogen with the increased awareness of climate change, carbon neutral processes has become more attractive (Baratieri et al., 2008; Udomsirichakorn & Salam, 2014; Yao et al., 2017). The principle of gasification is to heat the fuel in a sub-stoichiometric environment to produce a combustible gas containing hydrogen. Depending on the method and agent (steam, oxygen or air) the produced gas composition will differ. Notably steam gasification seems to be favourable for a high hydrogen yield in the syngas composition (Fremaux et al., 2015; Jeong et al., 2020; Nipattummakul et al., 2010).
1.1.7 Alkaline electrolysis
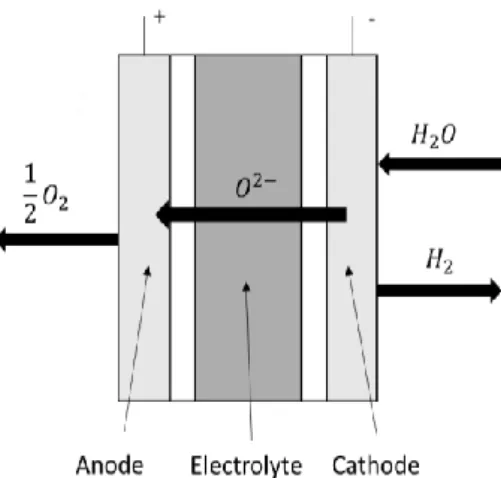
Electrolysis is a method which contains an anode, cathode, electricity supply and an
electrolyte. Electrolysis is producing hydrogen by applying a direct current to sustain electron flow and electricity balance to the cathode where electrons are consumed by hydrogen ions to form hydrogen. By maintaining the electrical balance the hydroxide ions are transferred
through the electrolyte to the anode and thereby giving away their electrons (Zeng & Zhang, 2010). This procedure is a simple and well-known technology and also the reverse reaction of a fuel cell (Srinivasan, 2006, p.400). Electricity required to start this process can be e.g. be used by renewable energy sources e(RES) or other power production plants. The theoretical water requirement for water splitting via electrolysis can be derived from the chemical composition of water. The molar mass of oxygen is 16, and hydrogen 1 which yields a water requirement of 18 g water per gram hydrogen (Wester, 2015,p.295).
The production of hydrogen with alkaline electrolysis (AE) is the most commercialized and well-established technology introduced 1789 by Troostwijk and Diemann (Shiva Kumar & Himabindu, 2019; Srinivasan, 2006, p.402). The principle of the alkaline water electrolysis process is initially started with electrifying water at the cathode where the alkaline solution of two molecules is reduced to one molecule of 𝐻2 and additionally two hydroxyl ions 𝑂𝐻−. The hydroxyl ions then transfer to the anode through a porous diaphragm and is discharged to ½ O2 and one molecule of H2O. Operating temperatures is within 30 – 80 ºC with an electrolyte
concentration of 20 – 30 %. (Shiva Kumar & Himabindu, 2019). Reaction (9), (10) and (11) presents the alkaline electrolysis procedure:
Equation 9 Cathode: 2𝐻2𝑂 + 2𝑒−→ 𝐻2+ 2𝑂𝐻− Equation 10 Anode: 2𝑂𝐻−→ 𝐻 2𝑂 + 1 2𝑂2+ 2𝑒 − Equation 11
Overall cell reaction: 𝐻2𝑂 → 𝐻2+ 1 2𝑂2
The disadvantages with the alkaline electrolyser are the limited current densities 0.4 A/cm2,
low operating pressures and a low efficiency. (Srinivasan, 2006, p.402; Zeng & Zhang, 2010).
1.1.8 Proton exchange membrane electrolysis
Proton exchange membrane electrolyser cells or polymer electrolyte membrane electrolyser cells (PEMEC) are based on the principle of splitting the water molecule into hydrogen and oxygen. A PEMEC is using a solid proton exchanging membrane usually Nafion while the alkaline electrolyser is using an alkaline solution (Carmo et al., 2013). The solid membrane gives the PEMEC various good characteristics. Compared to the liquid electrolyte used in AE
Figure 2 Schematic of alkaline electrolyser, own interpretation inspired by (Shiva Kumar & Himabindu, 2019)
range 20-300 µm (Shiva Kumar & Himabindu, 2019). This makes the proton transport in the electrolyte shorter which makes the PEMEC able to produce hydrogen with a lower power input and start-up time. The start-up time for AE is slower than PEMEC due to the inertia in the liquid electrolyte. This has shown great importance when electrolysis is used with
intermittent RES (Clarke et al., 2009). The PEMEC can achieve current densities up to 2 A/cm2 compared to AE´s 0.4 A/cm2 which reduces the operational cost for a PEMEC (Carmo
et al., 2013; Shiva Kumar & Himabindu, 2019).
The reactions in a PEMEC differs from the other electrolysers as the proton conducting membrane is used instead of an electrolyte. The reactions in a PEMEC is the following (Shiva Kumar & Himabindu, 2019):
Equation 12 Anode: 𝐻2𝑂 → 2𝐻++12𝑂2+ 2𝑒− Equation 13 Cathode: 2𝐻++ 2𝑒−→ 𝐻 2 Equation 14
Overall cell reaction: 𝐻2𝑂 → 𝐻2+ 1 2𝑂2
1.1.9 Solid oxide electrolysis
Solid oxide electrolysis cell (SOEC) has shown promising development and interest due to its ultra-pure hydrogen production and high efficiency. One of the main differences with SOEC from PEMEC and AE is the operating temperature, a SOEC is usually operated at 500-850 ºC which contributes to high efficiency. The electrolyte used in a SOEC is a dense ionic
conducting material, usually made of zirconia. (Shiva Kumar & Himabindu, 2019). The overall reaction in a SOEC is the same as PEMEC and AE, although the anode and cathode reaction differs. An electric current is added to the cathode together with water and the water reacts with the cathode and produces hydrogen and oxygen ions. At the anode the oxygen ions react and oxygen is created (Shiva Kumar & Himabindu, 2019).
Figure 3 Schematic of PEM electrolyser, own interpretation inspired by (Shiva Kumar & Himabindu, 2019)
Equation 15 Cathode: 𝐻2𝑂 + 2𝑒−→ 𝐻2+ 𝑂2− Equation 16 Anode: 𝑂2−→1 2𝑂2+ 2𝑒 − Equation 17
Overall cell reaction: 𝐻2𝑂 → 𝐻2+ 1 2𝑂2
Although this technique is not yet in commercial use due to challenges with material stability as the operating temperature in a solid oxide electrolyse cell is high (Buttler & Spliethoff, 2018).
1.1.10 Fuel cells
A fuel cell is a device that converts the chemical energy from a fuel in to electricity using an electrochemical process (Sharaf & Orhan, 2014). The electrochemical process is divided in two simultaneous reactions oxidation and reduction. Oxidation is the process that is
occurring when the fuel is reacting with the anode and electrons leaves the fuels molecule. In a PEM fuel cell, which is one of the most commonly used fuel cells the reaction would be the
following:
Equation 18
𝐻2=> 2𝐻++ 2𝑒−
The other reaction is reduction which occurs at the cathode when electrons is received from the cathode to the oxidation medium, the oxidation medium in PEM fuel cells is air (Srinivasan, 2006). Equation 19 1 2𝑂2+ 2𝐻 ++ 2𝑒−=> 𝐻 2𝑂
Between the anode and cathode, the electrolyte made of a proton conducting material is placed. Thus, the protons can pass through the electrolyte the electrons have to pass through
Figure 4 Schematic of solid oxide electrolyser, own interpretation inspired by (Shiva Kumar & Himabindu, 2019)
Figure 5 Schematic PEM fuel cell, own interpretation inspired by (Sharaf & Orhan, 2014)
another material which gives an electric current that can be used. The total reaction in the fuel cell results in water, electric work and heat in the following way. (Sharaf & Orhan, 2014).
Equation 20
𝐻2+ 1
2𝑂2 => 𝐻2𝑂 + 𝑊𝑒𝑙𝑒𝑐𝑡𝑟𝑖𝑐+ 𝑄ℎ𝑒𝑎𝑡
The applications for fuel cells have increased the past years due to the low emissions and they are widely used including propulsion systems, backup systems and portable systems. It exists various kinds of fuel cells, what varies between the fuel cells is mainly the different materials used in the cathode, anode and electrolyte. The efficiencies for the most common fuel cells are the following: PEM fuel cells is in the range 50 – 60 %, alkaline fuel cells ~60% and solid oxide fuel cells ~60 % (Sharaf & Orhan, 2014; US DOE, 2015).
1.1.11 Compressed hydrogen gas
Gas phased storage is most commonly done in high pressure tanks at 350-700 bar at room temperature (Guney & Tepe, 2017; Sun et al., 2018). For stationary large-scale hydrogen storage, a unit can contain up 175 000 to 250 000 litres of hydrogen. According to literature this kind of storage is modular and thereby the economy linear (Srinivasan, 2006, p.421). With compressed hydrogen storage being the most commercially available and mature storage method, it is advantageous regarding costs, fast refuelling and simple methodology. The disadvantages is the low volumetric density as it doesn’t increase with the pressure, having high pressures also compromises safety (Yanxing et al., 2019).
Another pressurised storage possibility is cryo-compressed hydrogen. This technology is based on cryo-compressed hydrogen vessel with temperatures low as 20 K and high
pressures around 250 up to 700 bar (Aceves et al., 2013; Moreno-Blanco et al., 2019; Yanxing et al., 2019). The main benefits are less evaporation losses and lower power consumption. Furthermore, the storage system is capable of thermal and pressure management by internal or external heat exchangers and self-cooling due to discharging by isentropic expansion. The disadvantage being thermal leakage (self-pressurization) which can be resolved with venting (Aceves et al., 2013; Stolten et al., 2016, p.163). Additionally, the volume of cryo-compressed gas is lower than ordinary compressed storage and some cost reduction in material can be obtained (Ahluwalia et al., 2018). In the figure below a schematic of a cryo-compressed hydrogen gas is presented.
Figure 6 Cryo-compressed hydrogen storage schematic – inspired by (Yanxing et al., 2019)
1.1.12 Liquefied hydrogen
Hydrogen has a higher heating value (HHV) of 142 MJ/kg (Srinivasan, 2006, p.428) which is greater than the HHV of gasoline (47.3 MJ/kg). Although hydrogen is the lightest fuel with a density of 0.089 kg/m3 at normal conditions which yields a low energy content per volume
unit 12.638 MJ/m3 compared to gasolines ~35 475 MJ/m3 (Di Profio et al., 2009; Srinivasan,
2006). Through liquefaction of hydrogen the energy content per volume unit can be greatly increased. Hydrogen at -253ºC has a mass density of 70.9 kg/m3 which gives an energy
content per volume unit of 10 067.8 MJ/m3 (Srinivasan, 2006, p.428).
Liquid hydrogen is attractive due to the capability of transporting high amount of energy. Transport trucks for hydrogen are designed with a capacity greater than 60 000 litres
(Barthelemy et al., 2017), to transport liquid hydrogen. The drawback of liquefied hydrogen is the work required to cool the hydrogen and the boil off (Hammad & Dincer, 2018) .
Hydrogen liquefaction can be classified into two major groups Linde-Hampson liquefaction and Claude liquefaction. The major difference between the two groups is how the gas is expanded, Linde-Hampson utilizes valves while Claude utilizes expanders (Sadaghiani & Mehrpooya, 2017). The process of liquefying hydrogen is usually divided in to three steps, the first step is compression, the second step is cooling through multiple nitrogen heat
exchangers and the third is expansion through a valve which causes partial liquefaction. The gases that doesn’t change phase is cycled back to the compressor (Boudellal, 2018).
Figure 7 Simplified schematic of liquefaction process – inspired by (Boudellal, 2018)
1.2 Problem
Construction equipment is in front of a future electrification as emission legislations is becoming stricter and efficiency is increased. Due to the size of Volvos machines a complete electrification with batteries is hard to achieve due to the energy density, machine power need and lack of peak power availability that battery electric vehicle (BEV) would require for quick charging. Therefore, hydrogen fuel cells could have great potential with its higher energy density. Handling hydrogen is challenging and the creation and storage of it is
important in order to industrialize the technology. Furthermore, the pathway of diesel fuelled construction equipment yields high quantities of CO2 and according to a WTT report by the
European commission Edwards et al. ( 2014) the emission balance for diesel is 87 g CO2eq/MJfinal fuel.
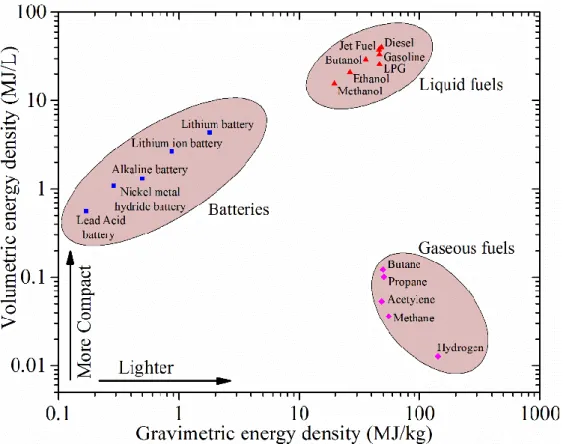
In the figure below the gravimetric energy density of various energy carriers are displayed, which puts further emphasis on the difficulties regarding already heavy equipment and the potential of other carriers. In the figure the gravimetric density is the energy content per kilogram of carrier, it is in relation to the volumetric energy density which is the energy content per litre of carrier. Worth noticing is the potential weight reduction and that an increase in tank storage on the equipment will be needed. However, with the machines large size and stationery move set a larger hydrogen tank compared to a battery would not be of significant issue.
Additionally, the operation time on various sites using construction equipment can be long without breaks which makes it necessary to be able to charge equipment fast. In this aspect hydrogen is preferable to batteries due to the low charging time for hydrogen while batteries lacks the possibility of rapid charging (Thomas, 2009).
Figure 8 Energy densities for various sources - Retrieved from (Conor et al., 2017)
1.3 Purpose/Aim
The purpose with this thesis work is to determine the most suitable way to produce, store, distribute, process and transport hydrogen to construction equipment sites. This is done with regards to efficiency, CO2 emissions and economic viability. The proposed option should
satisfy the energy demand of various types of construction sites which is characterized by availability of energy, existing distribution grid and energy profile of operation.
1.4 Research questions
This thesis work will be carried out in order to answer the following research questions. • What is the most suitable pathway for production, processing and transportation of
hydrogen at construction site, with regards to size, consumption and sustainability? • How can hydrogen be produced and distributed in an energy efficient way to
minimize the CO2 emissions and satisfy the energy demand of the construction
equipment at site?
• How will the environmental impact be compared to present operation of construction equipment and how will a future hydrogen pathway be resembled?
1.5 Delimitation
This work aims to present the overall efficiency of a construction site where the equipment is fuelled with hydrogen. As the operations varies at different sites and how the machines are used, the performance of the machine will not be evaluated because of design uncertainties of construction equipment. Therefore, a well to tank analysis is performed and the steps
between the site tank and usage is neglected.
Regarding the upstream processes e.g. the extraction and processing of resources will not be evaluated as the scope of the work would be too substantial. The emissions connected to the production of electricity will be involved to give better credibility. The study will strive to be constrained within using technologies that are economically viable, efficient and sustainable.
2 METHOD
The current section is going to present the methodology of developing a model for evaluation of a well to tank analysis for hydrogen powered construction equipment at site. The
upcoming section (2.1) will present the methodology of the literature study where the
procedure of deciding on knowledge to obtain and technological aspects relevant for the WTT analysis is presented. The second section (2.2) will present the methodology for model development which is to represent the supply chain from hydrogen production to storage and distribution.
To achieve the objectives of the study, various scenarios were created with the customer and academy. These scenarios are based on two-dimensions considering the conditions of the construction site with variating kind of operation. The operating conditions of the
construction equipment machines will be provided by Volvo CE and with the raw energy-data the study will evaluate the performance of a hydrogen energy system. The conditions of the scenarios are created to represent locations with different possibilities regarding grid-connection, length of transport and limitations of power supply.
2.1 Selection of method
With the current thesis work being a research project, the methodology can either be quantitative or qualitative. In a case research of the scientific method by Ketokivi & Choi (2014) they provide two definitions for the research method:
• Qualitative – “Research approach that examines concepts in terms of their meaning and
interpretation in specific contexts of inquiry”.
• Quantitative – “Research approach that examines concepts in terms of amount, intensity or
The current project is being supplied with empirical data about energy usage, construction equipment and site location. The raw data of energy profiles and efficiencies is to be
converted into meaningful data to provide evidence to prove the research questions. Hence, the research project is based on quantitative data analysis due to the model that is being developed is numerical based on empirical data (Dudovskiy, 2018).
2.2 Literature assemblage
To develop further knowledge in the area of hydrogen production, storage and distribution an in-depth literature study was performed. The basis of the study is founded in the flow-sheet below, explaining the concept of the system that is to be modelled. Hence, the study was conducted to satisfy the knowledge requirements regarding production, processing, transportation storage and distribution.
Figure 9 Model schematic
Regarding hydrogen production different technologies were evaluated for their performance, CO2 emissions and production costs. The technologies reviewed was natural gas-based steam
reforming, biomass gasification, autothermal reforming, partial oxidation and electrolysers as they all differ in the previously mentioned aspects. Operating conditions for the
production technologies are also gathered to later be used for modelling inputs. Additionally, the production possibilities were investigated for centralized or decentralized hydrogen production to satisfy the power demand of the construction equipment. As the construction equipment at site vary, different scenarios will be considered and strive to improve overall efficiency of the total system for the WTT analysis.
Processing of the produced hydrogen is also taken into consideration where conventional compression storage and cryogenic liquefaction storage is evaluated. These technologies are
work compared to compressed storage. However, the reason for considering liquefied hydrogen as a storage method is its energy density to volume and possibilities for long-distance transport.
Due to the different scenarios and constraints of construction sites, technology on both centralized and decentralized storage capabilities are obtained. Depending on the processing step this storage will either be based on pressurized or liquefied storage.
The literature used is primarily collected from databases and journals where the main
research is peer-reviewed articles within the field. For this degree project articles earlier than 2010 are discarded or critically reviewed because of the rapid developments within different fields.
2.3 Modelling
The program used to construct the model was MATLAB R2018b, MS Excel was used in order to arrange and store data which later on was exported to MATLAB. The model is a numerical model based on input given by Volvo CE from existing construction sites, the parameter given is the energy profile of different construction equipment. Due to confidentiality the energy profile of each machine won’t be displayed but instead the collective average is used which is seen as a black box with an output of an energy demand that is to be satisfied. Other input data in the model is conditions for each site e.g. power supply, distribution settings and distance from power supply. The outputs of the model are the total power consumption, cost and CO2 emissions.
The first step of the modelling was to create grey box models of every component in the system i.e. models based on theoretical structure combined with empirical data. The models of each component are written as a function. The next step was to build a main script where all components from well to tank were included and a result could be acquired. When this step was done the main program was designed to be able to find the most suitable way of operation using optimization methods.
The nature of the modelling will be linear because of the absence of production profiles to provide variation in price, efficiency and production limits. The specific costs, emissions and production rates are then used most commonly in per kg produced hydrogen to determine CO2 rates and costs. To optimize the hydrogen pathway, mixed integer linear programming
(MILP) is chosen as the most suitable method for the system due to the constraints being linear and able to minimize either cost or CO2 depending on the site conditions.
3 THEORETICAL FRAMEWORK
In the following section the most relevant parameters and operating conditions for the techniques to be used in the model are presented. The presented data is based on books and scientific reports from journals within each area. All costs presented in the following chapters are presented in $ (USD) for the source year, if the cost in a report is presented in another currency the cost is calculated with exchange rate for the source’s year.
3.1 Reforming methods
The developments of hydrogen powered fuel cells and vehicle applications both stationary and mobile continuously increases the demand for hydrogen. When producing hydrogen several methods can be used, methane/natural gas reforming, electrolysers and gasification methods. According to Zhu et al. (2019) Steam methane reforming (SMR) is one of the main sources of industrial hydrogen production due to its accessibility, high hydrogen to carbon ratio and liquefaction possibilities. SMR or SR is mainly using natural gas as source for hydrogen production due to its abundancy (J. Yoo et al., 2017).
In the study by Bej et al. (2013) hydrogen production by reforming methane was done. The study investigated SR catalyst over a NiO-SiO2 supported by alumina which showed promising conversion of methane at 95.7 % at optimal conditions (700 ºC). In mole equivalents the hydrogen yield was approximately 3.8 moles of hydrogen per mole of
methane reformed. Furthermore, in some studies by (Hufschmidt et al., 2010; Maluf & Assaf, 2009) nickel/aluminium catalyst variations has been investigated where it could be observed to have a good stability and reaching high steam/methane ratios.
Reforming methods also consist of partial oxidation (POX) and autothermal reforming (AR) technologies. The highest efficiency of the three is considered to be steam reforming with a commercial conversion efficiency of 70-85 %. Partial oxidation with a commercial efficiency of 60-75 % and autothermal efficiencies of 60-75 % but not completely commercialized yet. (Abdalla et al., 2018). Other sources also verifies that the order of most efficient processes are SR > AR > POX (Ersöz, 2008; Saeidi et al., 2017).
Regarding operational parameters for the steam reforming process, the rate of hydrogen production depends on the operating temperature and pressure. Because of the process being endothermic a high tube wall temperature should encourage hydrogen production. However, excessive temperature could lead to carbon formation on the catalysts, preventing further reforming reactions (Ersöz, 2008; Lao et al., 2016). The operating temperature differs where some literatures suggest a temperature range of 700 – 1000 ºC (O’Hayre et al., 2006;
Srinivasan, 2006) and other studies suggest 700 - 850 ºC to ensure the thermal durability of commercial catalysts which usually operates < 800 ºC (Bej et al., 2013; Ersöz, 2008;
Verbeeck et al., 2018).
Srinivasan, 2006, p.384), where in some studies the operating pressure were set to 10 bar (Rosen, 1991; Simpson & Lutz, 2007) . In the study by Ersöz (2008) the aim was to investigate optimal operation parameters for hydrogen production, with the additional constraints of obtaining maximum hydrogen yield while decreasing CO and CH4 residues. In their simulation of different steam reforming techniques (SR, POX and AR) the hydrogen yield content of the product gases for SR resulted in 55.2 % mole fractions of the input gas. In literature the hydrogen mole fractions of the different techniques of hydrocarbon processing are SR 74 - 76%, POX 41 % and AR 47 – 50 %(O’Hayre et al., 2006, p.294; Srinivasan, 2006, p.384).
3.1.1 Steam methane reforming
Hydrogen production through reforming can additionally be enhanced by some components. The most commonly used applications for hydrogen enrichment after the reforming steps are usually water-gas shift (WGS) reaction to further reduce CO or H2 perm-selective membrane
reactor, which also contributes to a purer H2 production which is beneficial for fuel cell
applications (X. Li, 2006). Most commonly a pressure swing adsorption (PSA) unit is installed after reforming and separation to produce 99.9% pure hydrogen (Nikolaidis & Poullikkas, 2017, p.306; O’Hayre et al., 2006; Saeidi et al., 2017).
Many authors determine that SMR or SR technologies are the most efficient, well developed and dominant production procedure of hydrogen both in capacity and cost (Abdalla et al., 2018; LeValley et al., 2014; Nikolaidis & Poullikkas, 2017). However, the disadvantages are its production of CO2 emissions and use of fossil fuels. Some reference values obtained from
papers studying hydrogen reforming processes presented their carbon emissions with natural gas based production to be 7.7 kg CO2/kg H2 with no efficiency specified (Voldsund et al.,
2016), a reference SMR unit with a conversion efficiency of 70.58 % was specified with the specific emission of 9.57 kg CO2/kg H2 (Mastropasqua et al., 2020a). Additionally, typical
emissions produced from SMR plants in other reviews are approximately 9-11 kg CO2/kg H2
(Khojasteh Salkuyeh et al., 2017).
To reduce environmental impact of SMR plants the reduction could be done with carbon capture storage (CCS) systems. Nowadays, CCS systems are currently implemented in approximately 1 800 MW of today’s hydrogen production plants (less than 0.5 % from SMR production) (IEA, 2019b; Mastropasqua et al., 2020a). In an techno-economic evaluation by Collodi et al. (2017) a study was conducted to evaluate and demonstrate CCS from an SMR plant. In the study different cases where the base case of a modern SMR plant supplied with feedstock, reforming, WGS and a PSA unit conducted tests with and without CCS. The results presented a capture from 53 – 90 % depending on fuel composition and syngas production differences. The main findings were that CO2 could be captured from shifted syngas, PSA tail
gas and SMR flue gas. Furthermore, the levelized cost of hydrogen (LCOH) comparing to the scenario without CCS and scenarios with CCS resulted in an increase by 2.37 to 5.87 c$/Nm3
(from 12.8 c$/Nm3). Another evaluation of hydrogen selling price with and without CCS for
SMR applications resulted in $1.11/kg H2 to $2.16/kg H2 (lowest selling price is conducted as
Additional techno-economical reviews regarding hydrogen production presents different production costs of hydrogen depending on assumptions and year. In an evaluation of
hydrogen production methods by Dincer and Acar (2015) the fossil fuel reforming (NG) of H2
was presented as $0.75/kg H2. Another review by Khojasteh Salkuyeh et al. (2017) also
suggests that the fossil fuel reforming has the lowest production costs at $1 - $1.3 /kg H2 for
large-scale production. Furthermore, in another assessment of SR economical aspects it is considered to be most beneficial to apply large-scale SMR production, where the study presented technical and input data of different scale of feedstock input and total costs for each type. The result from the study was that conventional large-scale production had a higher overall efficiency of approximately 10 % with the same annual load as the small-scale plant (Mueller-Langer et al., 2007). Additionally, in the study by Murthy Konda et al. (2011) an investigation of implementing large-scale SR compared to small and medium-scale. The study showed that the process efficiency increases with the scale, small-scale had an
efficiency of 68 %, medium scale 72 % and large-scale 76 %.
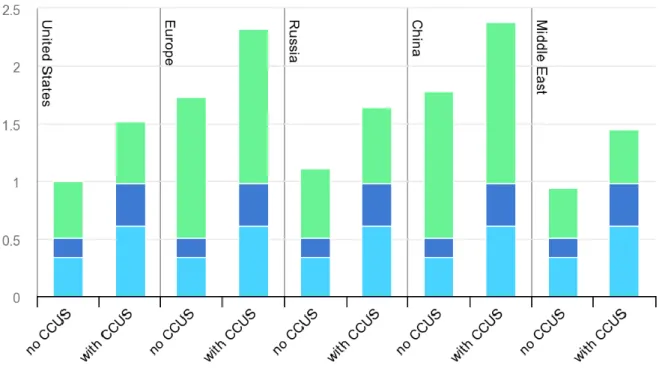
According to IEA (2019a) in an outlook for hydrogen energy, it shows in the figure below the operational cost for producing hydrogen at different locations. The green bar represents the natural gas cost, dark blue is operational expenditures (OPEX) and light blue capital
expenditures (CAPEX) in $/kg H2. The operational costs in the US is approximately $1
without CCS and $1.5 with CCS. The production costs is fairly low compared to other studies due to the cheap natural gas price.
Figure 10 Hydrogen production with natural gas as feedstock – Retrieved from (IEA, 2019a)
3.1.2 Additional reforming technologies
Depending on the upstream processes the cost of producing H2 varies. AR has seen some
reforming plant based on biogas as feedstock and performed a techno-economic evaluation of green hydrogen production. The plant was built with CCS and a capacity of 8.9 kg H2/h. The
production cost for that size resulted in 5.29 $/kg H2, which is within the range of other
studies’ prices per kg of biogas feedstock for hydrogen production costs at 5.29 to 8.04 $/kg H2 depending on pressure (Di Marcoberardino et al., 2019; Rau et al., 2019). Additional
information on scaling were available from Montenegro Camacho et al. (2017) from 8.9 to 62.3 kg H2/h the production cost saw a reduction from 6.02 to 3.05 $/kg H2. For AR with
natural gas the price is lower due to cheap feedstock which yields production costs with CCS to 1.59 – 2.1 $/kg H2 (Khojasteh Salkuyeh et al., 2017; Nikolaidis & Poullikkas, 2017), where
Nikolaidis presents the production cost without CCS as 1.47 $/kg H2. According to (Salkuyeh
et al., 2018) techno economic assessment the AR production pathway has seen promising results regarding costs and CO2 emissions. However, it is limited in its use in todays’ industry
due to the inexperience of the technology.
Partial oxidation is also commercially used and is mainly used for reforming hydrocarbons, fuel oil and coal with a commercial efficiency of 60-75 % with methane as fuel (IEA, 2019a; Kalamaras & Efstathiou, 2013). The production costs according to (IEA, 2014) technology system analysis programme was considered to be $1.09 – 2.34 /kg H2 for POX. In a life cycle
assessment by (Hajjaji et al., 2013) the environmental load of CO2 emissions resulted in 8.69
kg CO2/kg H2 at a process efficiency of 71 .83 %. Additionally, in an evaluation of hydrogen
production methods by Pilavachi et al. (2009) the emissions produced was evaluated to 12.35 kg CO2/kg H2.
3.1.3 Gasification technologies
In an exergy analysis of hydrogen production through steam gasification by Zhang et al. (2019) different types of biomass feedstock were evaluated and gathered to compare them for their hydrogen yield potential. For this study’s purposes some biomass alternatives are not considered due to relevancy. Fremaux et al. (2015) studied wood residues which underwent the gasification process in three temperatures 700, 800 and 900 ºC at different retention times of 20 to 40 minutes with 5 minutes increasing interval. This provided a hydrogen yield of 25.78 mol/Kg (12.79 g/kg) at 40 minutes and 700 ºC, 25,68 mol/kg (12.74 g/kg) at 40 minutes and 800 ºC, 29.69 mol/kg (14.73 g/kg) at 40 minutes and 900 ºC. Additional feedstock were also investigated by Yang Zhang et al. (2014) which investigated
demineralized tobacco which provided a hydrogen yield of 57.64 mol/kg (28.59 g/kg). The main conclusions of the study by Zhang et al. (2019) were that the exergy energy is largely influenced by the hydrogen yield of the biomass. Furthermore, steam gasification is sensitive to change in parameters like temperature, flow rate and retention time which effects hydrogen yield. Further conclusions were that a higher gasification temperature was
beneficial for exergy efficiency and thereby hydrogen production which other studies also confirm (Fremaux et al., 2015; Gao et al., 2008; Yang Zhang et al., 2014).
In a techno-economic evaluation by Yao et al.(2017) three technologies were simulated in ASPEN plus for being CO2-neutral production methods able to supply a demand of 90 kg
steam reforming and an alkaline electrolyser. It was concluded from the results that the steam gasification almost had double the conversion rate compared to the steam reforming of biogas. However, considering the cost of the system the three technologies had similar NPV at around 33 million Euro. The order of profitability was steam reforming, alkaline
electrolyser and gasification but it was concluded that the three options showed similar economic feasibility. In a life cycle assessment by Salkuyeh et al. (2018) they compared biogas gasification processes to SMR to compare it to commercial hydrogen plants. The results indicate that fluidized bed steam and entrained flow gasification could play an
important role on the market for commercial hydrogen production. However, at the moment the prices of natural gas are too low at $1.92 to $2.65 /GJ (EIA, 2020; IEA, 2019c) where a biomass price must be $60/tonne with CCS and $40/tonne without or even lower to compete with conventional SMR hydrogen production. Hydrogen costs would result in approximately > $3.5 /kg H2 with CCS for steam gasification and below $2.2 /kg H2 for SMR with CCS.
Additionally, the entrained flow gasification which can be used for coal and coke gasification, the process can either be air or oxygen based. Air gasification is not considered commercially viable due to dilation of the syngas produced. However, for gasification of biofuels with entrained flow would need high purity oxygen for partial combustion operating at high temperatures >1200 ºC (Qin et al., 2012; Salkuyeh et al., 2018). The production cost in the same evaluation by Salkuyeh et al. (2018) indicates that even with a higher efficiency than other gasification technologies, entrained flow had a minimum hydrogen production cost $0.07 to $0.33 higher than fluidized bed equipped with CCS. Hydrogen conversion efficiency for biomass gasification ranges between 30 - 50 % in reviews of hydrogen production
techniques (El Shafie et al., 2019; IEA, 2014; Nikolaidis & Poullikkas, 2017).
Gasification of coal is an additional fossil-fuelled based conversion method for hydrogen. According to (IEA, 2014) in a technical system analysis program for hydrogen production by the conversion efficiency for gasification is 50-70%, which also seems to be the general range in other reviews (Biagini et al., 2008; Y. Li et al., 2010; Ramsden et al., 2013) .
In a techno-economic assessment of production pathways for hydrogen by (Ewan & Allen, 2005) the production cost resulted in $1.62/kg H2 without CCS and $3.1/kg H2 with CCS,
where similar costs were modelled for underground gasification by Olateju & Kumar (2013) at $1.78 without and $2.16-2.77/kg H2 with CCS. In the previous mentioned report by (IEA,
2014) the production costs for non-implemented CCS was assumed to be the same as for SMR at $0.78 – 1.56/kg H2, where numerous papers presented costs within that range
(Lemus & Martínez Duart, 2010; Y. Li et al., 2010; Mason, 2007; Nikolaidis & Poullikkas, 2017; Ramsden et al., 2013).
In a life cycle assessment of hydrogen production by (Salkuyeh et al., 2018) they conducted a production of 11.3 kg CO2/kg H2 with coal gasification, where (Cetinkaya et al., 2012) had
similar result in their life cycle assessment at 11.29 kg CO2/kg H2. Other studies have seen
higher CO2 emissions of 18 kg CO2/kg H2 when investigating underground coal gasification
(Verma & Kumar, 2015) and 26.2 kg CO2/kg H2 due to low efficiency at 59 % (Ewan & Allen,
3.2 Electrolysis
The most commonly used electrolysers for commercial uses are proton exchange membrane electrolysers cell (PEMEC) and alkaline electrolysers (AE) which operates in similar way, the major difference between the techniques is the electrolyte. Other electrolysing techniques is emerging but many of them are still in the laboratory stage and has not yet been
commercialized. One of the most emerging techniques is the solid oxide electrolyse cell (SOEC) which can operate with an efficiency up to 90% at voltage down to 1,07 V (Carmo et al., 2013).
3.2.1 Energy characteristics
The efficiencies for different electrolysers are described in various articles and the values has differed between sources. In an article written by Lamy & Millet (2020) they discuss how efficiency in electrolysers are described. In a vast majority of literature, the efficiency is described from the theoretical work needed to split water and the actual electricity added. The theoretical work needed to split a kg of water into hydrogen is 39.5 kWh derived from the HHV of hydrogen 142 MJ/kg. Expressed in kWh/Nm3 this is 3.54 (Koponen et al., 2017).
Discrepancy have been found in how efficiency is described in industrial and research purposes. Thus the discrepancy in efficiency much literature present the specific energy for produced hydrogen in energy used per normal cubic meter kWh/Nm3(Lamy & Millet, 2020).
The specific energy consumption (SEC) and efficiency for the two types of electrolysers is discussed in various articles although discrepancy between the sources is found. For the alkaline electrolyser efficiency, Chi & Yu (2018) writes that the efficiency is in the span 59-70% and the SEC 4.5 - 5.5 kWh/Nm3 while other literature says 62-82% and 4.5-7 kWh/Nm3
(Carmo et al., 2013; Dincer & Acar, 2015a).
For PEMEC the efficiency is usually higher. The efficiency according to Carmo et al. (2013) is 67-82% and a SEC of 4.2 – 5.6 kWh/Nm3 which is strengthened by Clarke et al. (2010) who
says the efficiency is approximately 80 %. In a study by Sarno & Ponticorvo (2019) new materials as catalyst in PEMEC was studied with molybdenum disulphide and ruthenium sulphide. The study showed great results as an efficiency of 93% was achieved, although this experiment was performed in small scale.
Regarding SOEC the efficiency is varying in different literature as the technique is not yet mature. According to Dawood et al. (2020) the efficiency of a SOEC is 75-90 % although he says that the technique is far from commercialized. Based on LHV this would give a SEC of 3.89 – 4.67 kWh/Nm3. Chi & Yu, (2018) strengthens this and says that the SOEC can have an
efficiency greater than 90% due to the high operating temperature in the cell.
3.2.2 Economic characteristics
According to a review from 2019 about the cost of electrolysis the investment cost for AE is 840-1 344 $/kW while the cost for PEMEC is 1 344-2 240 $/kW (Parra et al., 2019). In a report written for IRENA (2018) the authors strengthen this and says the investment cost is
840 $/kW for AE and 1 344 $/kW for PEMEC. The authors say in the same report that the operational cost is 2% of the capital cost each year. Regarding SOEC, IEA writes in the report “Future of hydrogen” (2019a) that the investment cost today is 2800 – 5600 $/kW, 500-1400 $/kW for AE and 1100 – 1800 $/kW for PEMEC. Furthermore, they say that SOEC will not economically be competitive against PEMEC and AE in a foreseeable future. The cost of producing hydrogen with electrolysis is strongly influenced of the price of electricity which makes it hard to give a production cost.
In a report written at the Institute of Energy and Climate Research by Saba et al. (2018) the cost development of electrolysis from the past 30 years has been evaluated. The writers have also collected projection from various literature how the cost will develop in the coming years. In the later years the investment cost for electrolysis has decreased as the technique has been commercialized, mass produced and the production is more automated. The
operational cost for hydrogen production has also reduced since the technique have matured and efficiencies increased (Dawood et al., 2020). In the report one of the key finding is that the PEMEC will reduce in price and approach the cost of an AE (Saba et al., 2018). Consensus prevails among researchers that the cost for producing hydrogen with electrolysis will reduce.
3.3 Pressurized hydrogen storage
In a paper by Barthelemy et al., (2017) an overview of materials for storage technologies were compared to what constraints these materials and methods have. In the paper the authors present four common types of pressure vessels for hydrogen storage presented as type 1 to type 4:
1. Fully metallic vessel – most conventional, cheap but the heaviest. Approximately 1.35 kg/L (Type 1).
2. Steel pressure vessel wrapped in fibre composite material – High tolerance to pressure and light weight, costs approx. 50 % more than the fully metallic vessel (Type 2).
3. Composite vessel with metal liner – Composite usually of carbon fibre with
aluminium liner for sealing. Able to safely store for pressures up to 700 bar and are expensive. The weight is approximately 0.35 – 0.45 kg/L (Type 3).
4. Fully composite – Usually composed of a polymer with carbon fibre composites for structural load. It is the lightest storage vessel available, able to stand up to pressures of 1000 bar but expensive (Type 4).
Figure 11 Presentation of type of pressure vessels - Barthelamy et al., (2017)
In a study by Aceves et al. (2010) BMW investigated cryo-compressed storage system for automotive applications. The study concluded that hydrogen can be stored cryo-compressed with high density and with lower evaporation losses than liquid hydrogen storage. The hydrogen density is approximately two times denser than conventional compressed storage (Aceves et al., 2013; Ahluwalia et al., 2018).
A thermodynamic analysis of critical parameters for hydrogen storage was done by Yanxing et al. (2019) where different storage methods were evaluated. The study’s result was that the optimization of the compression stage is essential for an energy efficient system because of the energy intensity of the compressor. It is recommended to divide the compression into multiple stages (two or more) to lower the power consumption significantly. The power could approximately be reduced by 50 % compared to having five compressors instead of one. In the study the ratio between H2P = hydrogen density/power consumption was an important
parameter when comparing compressed hydrogen to cryo-compressed storage. Optimal storage conditions for both technologies were suggested as 300 K at 700 bars for compressed storage which yielded a H2P at 1.71 kg/m3, kW. Cryo-compressed storage conditions resulted
in 110 K at 700 bars with a H2P at 2.3 kg/m3, kW.
Another study by Ahluwalia et al. (2018) examined storage performance for cryo-compressed and compressed hydrogen storage for vehicles where operating conditions, gravimetric capacity and volumetric capacity were some of the key parameters. In the study the operating conditions which yielded the highest gravimetric and volumetric capacity for
capacity of 8.4 % and a volumetric capacity of 50.8 g/L. Regarding compressed storage the conditions were for the same vehicle at 288k at 350 bars which yielded a gravimetric capacity of 4.4 % and volumetric capacity at 18.5 g/L. The paper concludes that compared to baseline conventional hydrogen storage, improvement in gravimetric capacity can be up to 91 % and 175 % improved volumetric capacity. Additional savings can be obtained in the need of less composite material due to the volume being lower. Other studies has also confirmed that the gravimetric and volumetric capacity can be enhanced by cryo-compressed storage (Durbin & Malardier-Jugroot, 2013; Moreno-Blanco et al., 2019).
However, as many studies and authors suggest, cryo-compressed hydrogen storage compared to conventional gaseous storage are most suitable for mobile or large vehicles with long distance requirements (Aceves et al., 2013; Ahluwalia et al., 2018; Moreno-Blanco et al., 2019; Stolten et al., 2016; Yanxing et al., 2019). In a well to wheel analysis of
cryo-compressed, liquefied hydrogen and compressed hydrogen storage for mobile applications by (Paster et al., 2011), these technologies were compared in efficiency, CO2 emissions and
volumetric efficiency. The cryo-compressed storage was considered to have the highest energy use, CO2 emissions and hydrogen cost. On the other hand, the analysis showed that it
had the lowest system cost because of it being able to operate at lower pressures (<700 bar) and smaller tank due to its high volumetric efficiency. Di Profio et al. (2009) has gathered relevant parameters regarding energy requirements for gas compressed storage for the pressures 200, 350 and 700 bar. The energy requirements are respectively 2.86, 3.4 and 4.13 kWh/kg H2, where (Zheng et al., 2012) states that for 350 and 700 bar storage an
approximate of 5 % to 20 % of LHV is appropriate for compression work (1.6 to 6.6 kWh/kg). Additional cooling requirements are needed for refuelling purposes where the gas should be cooled to -40 ºC before compression according to hydrogen gas companies, where precooling is considered to be an additional 0.18 kWh/kg H2 (DOE, 2009; Zheng et al., 2012). The
insulated cryo-compressed storage tanks are flexible to the properties of the incoming hydrogen. The compatibility for gases and liquids are available at cryogenic liquid temperatures and ambient gaseous refuelling.
Gaseous hydrogen can be distributed and transported using pipelines. The technique is used today and the vast majority of the existing hydrogen pipelines are placed in USA and most of the pipelines are owned by hydrogen producers for chemical and refinery purposes (Shell, 2017). Pipelines are a good way to transport gas with low operational costs and emissions, the main drawbacks are the capital cost of the pipelines and the legislation. Even though the capital cost can be paid back in a few year pipelines is constrained following legislations regarding construction of pipelines (IEA, 2019a). The most commonly used way to transport gaseous hydrogen is by tube trailers. The amount of hydrogen to be transported is limited due to legal pressure constraints by DOT which constrains the trailers to carry approximately 300 kg with a maximum pressure of 250 bar (REDDI 2018). The cost to transport hydrogen by tube trailers according to IEA (2014) is 0.798 $/kg, 100 km. The cost associated with the compression to 250 bars is not included in the cost.