Institutional repository of
Jönköping University
http://www.publ.hj.se/diva
This is the published peer-reviewed version of an article published in Journal of Human
Subjectivity.
Citation for the published article:
Fristedt, S., Wretstrand, A., Björklund, A., Corr, S., & Falkmer, T. (2012). Viewpoints
on community mobility and participation in older age. Journal of Human Subjectivity,
10(1), 103-123.
Published with permission from: DBpia
http://www.dbpia.co.kr/Journal/IssueList/1622
Viewpoints on community mobility and participation
in older age
1)
Sofi Fristedt
PhD student, School of Health Sciences, J nk ping Universityö ö
Anders Wretstrand
Assistant Professor, Faculty of Engineering, Lund University
Anita Bj rklundö
Professor, School of Health Sciences, J nk ping Universityö ö
Susan Corr
Professor, Occupational Science, School of Health, The University of Northampton
Torbj rn Falkmerö
Professor, School of Occupational Therapy and Social Work, Curtin University
Abstract
Background/Aim: Community mobility supports participation in activities. However, knowledge
about issues that influence community mobility and, hence, participation in activities outside the home is limited. Since participation and community mobility are subjectively defined phenomena, further knowledge from an insider’s perspective is needed. The aim of this study was to identify and describe viewpoints on community mobility and participation in older age. Methods: A Q-methodology study was conducted with 36 male and female participants, including drivers and non-drivers. Participants sorted 45 Q-statements along a most to least continuum, indicating their current habitual situation of mobility and participation in activities outside their homes.
Key words: Activity, Q methodology, Sweden, Northern Europe
* Correspondence concerning this article should be addressed to : Sofi Fristedt
School of Health Sciences, J nk ping University,ö ö SE 551 11 J nk ping, Sweden.öš öš
Telephone: +46-36-101269. E-mail: sofi.fristedt@hhj.hj.se Received Dec. 11, 2011 Revised May 20, 2012 Accepted June 10, 2012
Results: Three viewpoints were found and assigned content-describing denominations; “Prefer
being mobile by car, “Prefer being mobile by public transport” and “Prefer flexible mobility”.
Conclusions: All participants were satisfied with their actual participation in activities outside
their homes. However, those who preferred to use public transport were less satisfied with their opportunities and possibilities to participate in activities outside their homes. The existing demand-responsive Special Transportation System was not considered to be an attractive enough alternative by any of the participants. Intermediate community mobility options are thus needed for those who can no longer drive or use public transport.
I. Introduction
Participation in activities that provides meaning, purpose and belonging from the individual’s perspective is health promoting (Wilcock, 2006). Participation in such activities is dependent on personal involvement and is more than performing something per se (Whiteford & Pereira, 2012). Moreover, frequency of doing an activity cannot distinguish performance from participation (Hammel et al., 2008). A variety of activities may be individually defined as participation and no group of activities seems more important than others from this perspective (Magasi, Hammel, Heinemann, Whiteneck, & Bogner, 2009). Values generated from participation e.g. social inclusion and freedom may be possible to attain from different activities (Hammel, et al., 2008; Law, 2002). Thus, to capture an inner perspective is essential to determine if the individual experience an activity as participation or merely as a performance (Hammel, et al., 2008).
Participation in health promoting activities outside of home requires mobility (Stalvey, Owsley, Sloane, & Ball, 1999). Mobility could be described as an activity by itself, but is also as an activity supporting participation in activities in the community. Consequently, community mobility, defined as “moving self in the community and using public or private transportation” (American Occupational Therapy Association, 2002, p. 620),is an important attribute to human life (Stalvey, et al., 1999). Individual community mobility choices and community mobility in itself may be influenced by environmental factors1) including barriers
and facilitators, and personal factors2) (Hammel, et al., 2008; Law, 2002). Individual choices
may affect community mobility and participation in activities, as well as the subjective sense
1) “The physical, social and attitudinal environment in which people live and conduct their lives (WHO, 2001).
2) “Features of the individual that are not part of a health condition or health state. These factors may include gender, age,…lifestyle,…social background,…past and current experience (WHO, 2001)”.
of control in these situations.
Furthermore, restricted community mobility has been described as the most common participation restriction in older adults (Wilkie, Peat, Thomas, & Croft, 2006). Community mobility is more than travel from A to B, and may be represented by a variety of individual and shared meanings (Cresswell, 2010). For example, access to a car may be a source of independence and freedom, and a crucial facilitator to be able to live a social life (Classen, Winter, & Lopez, 2009). Consequently, driving cessation has been associated with decreased participation and quality of life in older age (Davey, 2007). However, public transport may potentially satisfy the community mobility needs of older people. Large groups of older people are, in fact, dependent on public transport (Broome, McKenna, Fleming, & Worrall, 2009; Wretstrand, Svensson, Fristedt, & Falkmer, 2009). Still, research concerning factors that are positive for community mobility, and thereby participation in older age, tends to emphasize car accessibility over public transport solutions.
Since participation and community mobility are subjectively apprehended and defined phenomena (Cresswell, 2010; Gustavsson, 2004; Hammel, et al., 2008), further knowledge from an insider’s perspective is needed. The aim of this study was thus to identify and describe older people’s viewpoints on community mobility and participation in older age.
II. Research Methods and Design
Q-methodology was used in this study to identify and analyse viewpoints (Brown, 1980) in a group of older people. This method has previously been used with respect to transportation and modal choice (van Exel, de Graaf, & Rietveld, 2004).
In Q-methodology, each participant’s viewpoints on a certain topic are identified by doing a Q-sort, namely by sorting a sample of statements in an order that is significant to that particular individual. The variables are the sorts made by the participants and the statements are the equivalent to subjects or participants in other studies. As part of Q-methodology these individual viewpoints are correlated by factor-analysis, resulting in identification of a set of common viewpoints including the diversity between them. “Finite diversity” is assumed, (Barry & Proops, 1999) which means that only a limited number of viewpoints usually emerge. Consequently, only a limited number of participants is needed for this methodology (Brown, 1996). Furthermore, the objective is to identify and describe viewpoints related to a certain topic in a group of people, rather than identifying the share of individuals who holds a certain viewpoint (Corr, 2006).
1. Selection and Description of Participants
To identify a relevant sample of viewpoints within the target population (Brown, 1980) a gender balanced subset among participants in a previous study (Wretstrand, et al., 2009) who were either drivers or non-drivers were approached for inclusion. The participants were recruited from three municipalities in the south of Sweden; Karlskrona (64,000 inh.), Bor s (100,000 inh.) and Helsingborg (123,000 inh.). In all three municipalities all operatingå vehicles were low-floor or low-entrance buses. In accordance with Swedish legislation, the three municipalities had also made accessibility improvements in the built public environment. This represents a context similar to other Northern European countries.
The participants received a letter with information about ethical aspects and the data collection procedures for the present study. Further information was given in a phone call before the participants gave their informed consent.
Altogether 36 participants, 16 women (mean age 81.0; sd. 3.5; range 13) and 20 men (mean age 81.7; sd. 3.6; range 12), were included. Among the participating women, three were still driving their private car, while 13 did not have access to a car. The participating men were all driving their car. We were unable to recruit any men who had ceased to drive, since all potential participants in this particular target group who were approached declined, due to health problems. Moreover, in these generations it is common that women cease to drive at better health than men do (Siren, Hakamies-Blomqvist, & Lindeman, 2004). All participants were able to transport themselves to the hotel or the university in each municipality especially chosen for data collection.
2. Data Collection
Q-methodology involves four stages; developing statements for the Q-sort pack, administering the Q-sort pack, statistical analysis and interpretation (Brown, 1980). However, prior to writing the statements for a Q-methodology study, the so-called concourse or “universe of opinions” related to the area of interest has to be identified (Brown, 1980, p. 61). In the present study, a broad selection of scientific articles and reports were used to establish the concourse. Findings from the previously conducted survey were also included in the concourse (Wretstrand, et al., 2009). Elements of the concourse are summarised in the introduction section of the present article. More than one hundred statements aiming at capturing viewpoints on community mobility and participation were initially developed. Then the statements were compared and discussed by the authors and statements covering
similar issues were collapsed, rephrased or removed. As a consequence, further statements were excluded or rephrased until a pilot Q-sort pack including 44 statements, was established.
After pilot-testing, one of the 44 statements was considered to be redundant and thus removed. Eight statements were reformulated, either by adding words (statements 9, 39, 40) or changing words (statements 18, 25, 26, 27, 44). Furthermore, two statements were added (statements 10, 45) to reflect opinions given by informants in the pilot focus group. The final version of the Q sort pack thus comprised 45 statements, a common amount in Q-– methodology (Brown, 1980).
The Q-sort pack was delivered to the participants as cards packed in random order, with one statement on each card. The participants were instructed to sort one card in each position on a provided grid, shown in Figure 1. In this grid the columns represent values ranging from -5 to +5. The rows of the grid restrict the number of statements that are allowed to be sorted in each column. The participants were instructed to sort cards that to their opinion fitted their current habitual situation of community mobility and participation in activities outside the home the most (+5) to the right, neutral in the middle, and the least (-5) to the left onto the grid.
The participants were asked to focus only on habitual trips, defined as trips within their neighbourhood, town or municipality made as a pedestrian or by different modes of transport such as a bicycle, private car, public transport or Special Transportation Services (STS). STS is a demand-responsive mode of transport provided by the municipalities to persons that have been certified as eligible to use it, due to a pre-defined degree of functional mobility limitations. Examples of activities outside the home, such as going for a walk, visit relatives or friends, shopping, visit care- or service facilities, work voluntarily or to participate in club meetings were also given.
Most participants managed to perform their Q-sorts within a reasonable period of time, on average 15 minutes. Each Q-sort was documented together with the participant, making it possible to ask additional questions if needed and for the participants to comment on it. At the same time their age, gender, civil state and most commonly used mode of transport were recorded. The Q sorts were made after focus groups sessions with the same participants. Consequently, findings from these interviews were also available for complementary information.
3. Data Analysis
Each participant’s Q-sort, representing that person’s individual point of view, was then entered into a free software package, PQMethod 2.11 (Schmolck, 2002). The software correlates each Q-sort with every other Q-sort, identifying similar and diverse patterns of perspectives across participants that results in factors or clusters of participants essentially sharing the same viewpoints (Brown, 1980). PQMethod 2.11 was used for the analysis, including Principal Component Analysis (PCA) and Varimax rotation. The default alternative provided by the PQ method (Schmolck, 2002) was used to flag Q-sorts’ high loadings. Eight factors were first extracted, which all had eigenvalues exceeding 1.00 (from 1.31 to 11.34). However, only four factors met the criterion of having at least two Q-sorts that loaded highly on a particular factor both negative and positive (2.58/ ) prior to rotation (Brown, 1980); in this study representing a minimum loading of ± 0.38 on one factor.
However, when deciding how many factors to keep, statistics provides no absolute standards and should therefore only be used for guidance. Instead, theory and judgement with respect to for example simplicity and which solution makes most sense can be used to guide the final decision (Brown, 1980; Webler, Danielson, & Tuler, 2009). In the present study the three factor solution was chosen, based on being more simple, making more sense and thus facilitating understanding of the different viewpoints.
Factor loadings indicating the degree of correlation between an individual Q sort and each factor are shown in Table 1. In Table 1 correlations between factors score are also
Table 1. Factor loadings (Bold numbers indicate sorts loading highly on each factor)
Q sort No.*
Characteristics with respect to gender, driving and age
Factor 1 2 3 1 Female driver, 80 0.74 -0.06 0.16 3 Female driver, 77 0.55 0.35 0.28 4 Male driver, 82 0.72 0.25 -0.07 5 Male driver, 78 0.58 0.13 0.19 6 Male driver, 78 0.48 0.28 0.02 7 Male driver, 79 0.64 0.42 -0.18 8 Male driver, 81 0.77 -0.20 0.26 9 Male driver, 77 0.55 0.49 0.19 13 Male driver, 88 0.56 0.10 0.37 23 Male driver, 82 0.77 -0.19 0.24 24 Male driver, 81 0.42 0.33 0.03 25 Male driver, 78 0.62 0.09 0.36 26 Male driver, 80 0.55 -0.07 -0.04 28 Female non-driver, 78 0.48 0.33 0.21 29 Female non-driver, 87 0.60 0.40 -0.00 34 Male driver, 82 0.65 0.27 0.41 10 Female non-driver, 76 0.08 0.65 0.33 11 Female non-driver, 78 0.12 0.71 0.11 12 Female non-driver, 81 0.31 0.66 0.25 14 Male driver, 88 0.11 -0.44 0.35 16 Male driver, 81 0.11 0.72 0.34 19 Female non-driver, 83 0.08 0.63 -0.33 31 Female non-driver, 83 0.14 0.57 0.17 32 Female non-driver, 89 0.10 0.69 -0.06 36 Female non-driver, 81 0.09 0.75 0.18 2 Female driver, 82 0.48 -0.09 0.71 15 Male driver, 80 0.12 0.25 0.80 20 Female non-driver, 79 0.09 0.47 0.72 22 Male driver, 82 0.32 0.36 0.68 27 Male driver, 85 0.11 -0.05 0.59 30 Female non-driver, 83 -0,09 0.28 0.51 33 Male driver, 89 0,51 -0.27 0.58 17 Male driver, 78 0.51 0.42 0.43 18 Female non-driver, 78 0.03 0.26 0.11 21 Female, non-driver, 81 -0.22 0.25 -0.02 35 Male driver, 85 0.44 0.30 0.46 % Explained variance Number of defining variables
21 16 17 9 14 7 Factor Score Correlations Factor 1
Factor 2 Factor 3 1.00 -0.37 1.00 -0.53 0.41 1.00 *Q sorts rearranged according to factors
shown indicating how similar pairs of factors are (Webler, et al., 2009).
Key elements in the three factors, henceforth called viewpoints, were identified based on normalized factor scores (z-scores) provided by PQMethod. These scores show the ranking of each statement within the viewpoint (Webler, et al., 2009). When identifying key elements, attention was first paid to statements at the high and low ends that characterize the viewpoints (Brown, 1980). Eventually also statements to the neutral area in the middle of the grid were considered. These key elements were interpreted and used to create a description of the core beliefs that signified the viewpoints. Consensus statements, namely statements that were not ranked significantly differently (P >.05 or P>.01) by any viewpoints, and distinguishing statements, namely statements that were ranked significantly differently (P<.05 or P<.01) in a certain viewpoint compared to the other viewpoints (Webler, et al., 2009) were also provided by PQmethod 2.11. Distinguishing statements, pointing to the unique features of a viewpoint, and consensus statement high-lighting the agreement between viewpoints, were used to interpret the results.
III. Results
The three viewpoints were denominated; “Prefer being mobile by car (Viewpoint 1)”, “Prefer being mobile by public transport (Viewpoint 2)” and “Prefer flexible community mobility (Viewpoint 3)”. Thirty-two Q-sorts were defining variables on one single viewpoint. The established viewpoints explained 21 % (Viewpoint 1), 17 % (Viewpoint 2) and 14 % (Viewpoint 3), in total 52% of the variance in the Q-sorts. There were no significant (p < .05) age or gender differences between the three Viewpoints. Factor arrays for the viewpoints are found in Table 2.
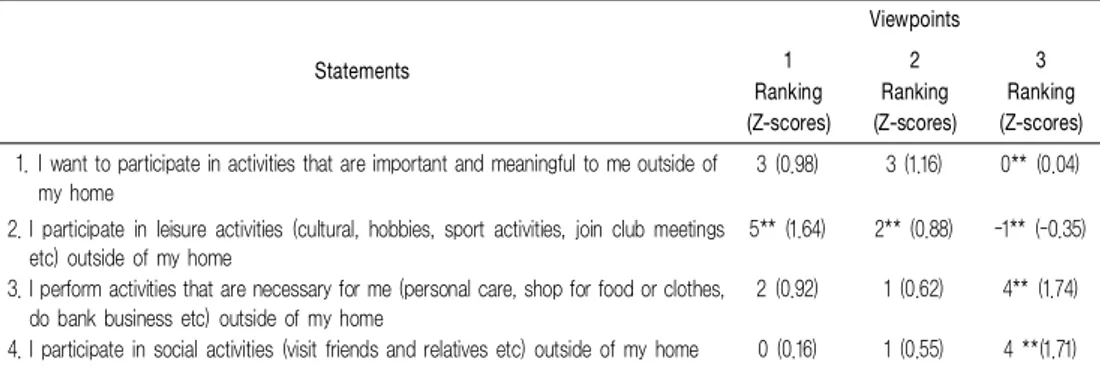
Table 2. Factor arrays for the viewpoints including ranking and normalized factor scores (Z-scores)
Statements Viewpoints 1 Ranking (Z-scores) 2 Ranking (Z-scores) 3 Ranking (Z-scores) 1. I want to participate in activities that are important and meaningful to me outside of
my home
3 (0.98) 3 (1.16) 0** (0.04) 2. I participate in leisure activities (cultural, hobbies, sport activities, join club meetings
etc) outside of my home
5** (1.64) 2** (0.88) -1** (-0.35) 3. I perform activities that are necessary for me (personal care, shop for food or clothes,
do bank business etc) outside of my home
2 (0.92) 1 (0.62) 4** (1.74) 4. I participate in social activities (visit friends and relatives etc) outside of my home 0 (0.16) 1 (0.55) 4 **(1.71)
1. Viewpoint 1: “Prefer being Mobile by Car”
The four women and twelve men who shared this viewpoint, clearly preferred
5. I perform activities outside of my home without the help from someone 1** (0.29) 3 (1.05) 3 (1.12) 6. I prefer someone to join me when travelling outside of my home -2* (-0.90) -4* (-1.31) 1** (0.06)
7. I usually travel alone -1 (-0.47) 3** (1.02) -2 (-0.77)
8. I have someone to ask for help regarding travelling, if I need to -4** (-1.45) 0* (0.08) 2* (0.65) 9. I have no need to do “ordinary” trips, to participate in activities outside of my home -4** (-1.30) -1 (-0.54) -2 (-0.53) 10. I sometimes refrain from travel because it is too complicated to do the trip (have to
change bus several times, too far to walk etc) b
-1(-0.48) -1(-0.31) -1 (-0.44) 11. I refrain from some “ordinary” trips because it is too expensive to travel a -3 (-1.20) -2 (-1.01) -2 (-0.64) 12. I don’t feel comfortable about leaving my home a -4 (-1.36) -2 (-0.85) -3 (-1.05) 13. I feel secure when I travel outside of my home 0 (0.11) 0 (-0.01) 4** (1.57) 14. I travel where I want to 0* (0.25) -1* (-0.16) 3** (1.35)
15. I travel when I want to 1 (0.46) 1 (0.50) 5** (1.85)
16. I travel how I want to 1 (0.33)1 1 (0.55) 5** (2.01)
17. It is important (for me) to be able to transport/move myself outside of my home 4* (1.53) 2* (1.01) 1** (0.10) 18. Being able to travel is important for my autonomy b 2 (0.55) 2 (0.82) 2 (0.60) 19. I prefer driving my own car 3** (1.28) -5** (-1.85) 1** (0.39) 20. I prefer going by private car 5** (1.57) -5** (-1.93) 1 ** (0.41) 21. I prefer to transport myself by bus -3** (-0.95) 5** (1.44) 0** (-0.24) 22. I prefer to transport myself by STS. -5** (-2.54) -4 (-1.49) -5 (1.48) 23. I prefer to transport myself by walking 3 (1.10) 4 (1.31) 1** (0.51) 24. I prefer to transport myself by bicycle -2 (-0.67) -3*(-1.20) -1 (-0.52) 25. I find the local public transport accessible for me 0 (0.20) 4** (1.21) 0 (-0.05) 26. I find the local public transport usable for me 1** (0.36) 5** (1.61) -1** (-0.55) 27. I find the local public transport comfortable -2** (-0.85) 4** (1.40) 0** (-0.05) 28. I feel safe in the local public transport a 0 (-0.00) 0* (0.43) 0 (-0.20) 29. I feel secure in the local public transport 0* (0.20) 3** (1.16) 0* (-0.30) 30. I am satisfied with my participation in activities out of my home b 2 (0.95) 2 (0.89) 3 (0.94) 31. My participation in activities outside of my home has decreased b -3 (-1.09) -2 (-0.95) -3 (-0.8) 32. My quality of life is good due to my travel possibilities 3*(1.26) 0*(0.21) 2*(0.73) 33. My quality of life is good due to my ability to transport myself outside of my home b 2 (0.49) 1 (0.52) 2 (0.71) 34. My quality of life is good due to my possibilities to participate in activities outside of
my home
4*(1.44) 0** (0.01) 2*(0.90) 35. I am satisfied with my possibilities to participate in activities outside of my home. 2 (0.83) 0** (-0.03) 3 (1.11) 36. I use public transport less than before b -3 (-0.95) -1 (-0.54) -2(-0.77) 37. I use my own car less than before 1** (0.29)* -4** (-1.54) -2** (-0.72) 38. I travel outside of my home less than before b -1(-0.48) -2 (-0.65) -1 (-0.52) 39. The nearest bus stop is too far from where I want to go 0** (0.08) -3 (-1.14) -4 (-1.44) 40. The nearest bus stop is too far from where I live -1 (-0.20) 0 (-0.14) -4** (-1.41) 41. The time table is difficult to read a -2 (-0.74) -2 (-0.81) -3 (-1.25) 42. It is difficult to get on and off the bus -2 (-0.89) -1** (-0.30) -3 (-1.28) 43. The public transport buses runs too seldom -1** (-0.49) -3* (-1.27) -5* (-1.77) 44. It is important for my feeling of participation in social life that I can participate in
activities outside of my home
4** (1.35) 2** (0.80) 0** (-0.25) 45. My participation in activities outside of my home has decreased since I no longer
have access to a car a
-5 (-1.64) -3(-1.19) -4 (-1.28) Note. *Distinguishing statements significant at P<.05. ** Distinguishing statement at P>.01a
Consensus statements non-significant at P>.01bConsensus statements non-significant at P>.05.
transportation by car (20, +5 [statement 20 ranked +5]) compared with going by bus (21, -3) or by STS (22, -5). Driving their own car (19, +3) and walking (23, +3) were ranked rather high. Being mobile outside of the home was considered important (17, +4) and their community mobility possibilities contributed to their quality of life (32, +3). Participation in leisure activities characterized their current situation (2, +5), and they wanted to take part in important and meaningful activities outside the home (1, +3). This was important for their feeling of participation in social life (44, +4) further contributing to their quality of life (34, +4). Limitations or community mobility transitions, using public transport less or having ceased to drive, potentially decreasing participation in activities outside the home, were not part of their current situation (11, -3; 31, -3; 36, -3; 8, -4; 9, -4; 12, -4; 45, -5). Notably, two of the women did not have access to a car. Data from focus groups interviews indicate that one of them had previously owned a car but sold it due to costs. She participated in activities outside home daily, and considered it problematic to be dependent on PT-timetables or other persons driving her. The other woman had a driving licence, but claimed she had never driven for eco-sustainable reasons. Due to reduced physical capacity she could no longer go by bike and found it too demanding to go by bus. Consequently, she found it problematic to travel for example to her summer house.
2. Viewpoint 2: “Prefer being Mobile by Public Transport”
Seven women and one man shared this viewpoint. They preferred public transport (21, +5) and walking (23, +4), compared with going by STS (22, -4), bicycle (24, -3) or by car (20, -5; 19, -5). Public transport was highly valued, considered usable (26, +5), accessible (25, +4), comfortable (27, +4) and rather secure (29, +3). Potential flaws in the public transport system were not identified (39, -3; 43, -3). This group usually travelled alone (7, +3) and preferred doing so (6, -4). They independently performed activities outside of home (5, +3), and wanted to participate in activities they considered important and meaningful (1, +3). They did not experience decreased participation in activities (31, -2). They did not consider their continued participation to be influenced by access to a car (45, -3). They did not use their car less than before (37, -4), but had mostly managed without the car for quite some time. The man who shared this viewpoint was still driving a car. In the focus groups interview, he claimed to avoid car use when possible arguing for eco-sustainability. Lastly, as shown in Table 1, another man loaded negatively on this viewpoint.
3. Viewpoint 3: “Prefer Flexible Community Mobility”
Three women and four men shared this viewpoint. They acknowledged that they travelled when (15, +5), how (16, +5) and where they wanted to (14, +3), and they felt secure in doing so (13, +4). They participated in necessary (3, +4), as well as social activities (4, +4). This viewpoint was neutral towards all modes of transport except STS (22, -5). Most of the participants sharing this viewpoint combined car and public transport usage. Difficulties related to using buses (42, -3; 41, -3; 40, -4; 39, -4; 43, -5) were not reported. They were rather satisfied with their participation (30, +3) and their possibilities to participate (35, +3). They also felt comfortable about leaving their home (12, -3), and independently performed activities outside their home (5, +3). Similar to Viewpoint 2 they neither reported decreased participation in activities outside the home (31, -3), nor considered their continued participation to be influenced by access to a car (45, -4).
4. Comparing the Viewpoints
As shown in Table 2, twelve statements emerged as consensus statements. The participants of the different viewpoints expressed being comfortable about leaving their home (12 [statement number 12]), and that their community mobility somewhat contributed to their quality of life (33) and was important for their autonomy (18). They neither decreased their community mobility (36) irrespective of which their main mode of transport was (38, 45), nor did they refrain from doing trips due to costs (11), or because it was too complicated to plan or accomplish (41, 10). They participated in activities outside the home as before (31) and were satisfied in doing so (30). Even if it did not qualify as a consensus statement, the participants agreed that STS was something they did not prefer to use (22). Viewpoint 1 and 3 also agreed on that participation in the different areas of activities (leisure, necessary or social) clearly applied to their current situation.
As shown in Table 3, different kinds of activities were distinguishing for the different viewpoints. Viewpoint 1 found, for example, participation in activities outside the home to be more important for participation in social life (44) compared with the other two viewpoints. With respect to community mobility, several statements appeared as distinguishing in all three viewpoints (6, 8, 17, 19, 20, 21, 26, 27, 29, 32, 37, 43).
VI. Discussion
This study identified three viewpoints with respect to community mobility and participation in activities outside the home in older age. The preferred mode of transport was of vital importance for the composition of these three viewpoints and included community mobility by car, by public transport and flexible community mobility. The presence of a viewpoint preferring public transport as the mode of transport that enables participation is inconsistent with other studies (Bowling & Gabriel, 2007; Classen, et al., 2009; Hjorthol, Levin, & Siren, 2010; Mann, McCarthy, Wu, & Tomita, 2005), suggesting driving to be of older people’s preference. Indeed, car driving seems to increase among older people, indicating that an increasing share of older people also prefer to drive (Golob & Hensher, 2007; Newbold, Scott, Spinney, Kanaroglou, & P ez, 2005; Siren & Hakamies -á Blomqvist, 2006). In line with the design of the present study the existence of different preferences can be established, but not the share of individuals in the general population that holds this viewpoint.
Previous studies stress the importance of the car as the best facilitator for participation in activities outside the home, and as a means to increase older peoples’ quality of life (Bowling & Gabriel, 2007). Moreover, having a car and driving it has been described as clearly beneficial, since access to different occupational arenas is facilitated (Bowling & Gabriel, 2007), autonomy maintained (Broome, et al., 2009; Whitehead, Howie, & Lovell, 2006) and decreased walking ability compensated for (Mollenkopf et al., 2002). The present study found that autonomy and having access to activity arenas did not only apply to just to car users, but also to users of public transport. Furthermore, the ability to fulfil more than primary, utilitarian travel needs, by for example travelling where one wants, which has been described as one major advantage of driving car (Musselwhite & Haddad, 2010), did also apply to public transport users in the present study. This might be due to the fact that the participants’ home municipalities, including their surrounding regions, all had a well-recognised accessibility standard in their public transport systems (Wretstrand, et al., 2009). This assumption is supported by the fact that barriers identified in other studies, including for example safety and security issues, travel costs, lack of motivation, complexity, lacking company when travelling or having no place to go, was not acknowledged by the participants in our study (Broome, Worrall, McKenna, & Boldy, 2010; McCluskey, Thurtell, Clemson, & Kendig, 2010).
Women dominated Viewpoint 2, however, not significantly. On the other hand no non-driving men participated. Nevertheless, the women on Viewpoint 2 did not experience
it as disadvantageous to lack access to a car. They seemed to have gained their own experiences and from them constructed their personal values (Krekula, 2007). Consequently, they seemed to be in control of their situation with respect to participation as well as community mobility and more or less considered it to be a result of their choice (Hammel, et al., 2008; Law, 2002). According to another recent study including both men and women (Musselwhite & Haddad, 2010), women handled the situation of ceasing to drive more efficiently, since they managed to distance themselves and their identity from being mobile by car.
On the other hand, the two women pertaining to Viewpoint 1 seemed less satisfied with PT than those on Viewpoint 2. Difficulty to satisfy their travel needs were their common perspective, even if one of them was very active and the other experienced activity limitations due to reduced physical capacity.
To solely, or mostly, be car-dependent, as most of the participants sharing Viewpoint 1 were, may currently be advantageous, but could possibly be disadvantageous in case of an unwanted driving cessation (Broome, et al., 2009). Car users were, in fact, the ones who considered it most important to stay mobile. When driving is no longer an available choice the sense of control obtained from community mobility and participation in activities (Hammel, et al., 2008; Law, 2002) may potentially be reduced. Hence, to combine car use with other modes of transport, as indicated by Viewpoint 3, may be an efficient way to maintain community mobility and participation during possible community mobility transitions across the aging process.
The preferred modes of transport were for most of the participants the ones they had current access to. This may be due to adaptation during their ageing processes, where strategies to negotiate the environment to perform activities outside the home have been adopted (Burnett & Lucas, 2010). All viewpoints did not see themselves affiliated with STS mode of transport support, probably associating with being dependent and losing autonomy. Autonomy, defined as a sense of independence obtained through choice of activity, ability to make own decisions, and community mobility, is an important aspect of quality of life (Howell & Cleary, 2007). Being confined to STS has also been described as negatively affecting social participation outside the home (Broome, et al., 2009). STS has also been identified as an inconvenient mode of transport (Cannon Hendricksson & Mann, 2005), suitable for others rather than for oneself (Reinholdt Hagebeck & Waara, 2007).
These findings highlight the need for occupational therapy interventions to overarch the gap between what the individual wishes to do, actually chooses as well as have the possibility to do and finally does. More specifically occupational therapists need to focus on
interventions that enable continuing participation in activities outside the home from the individual persons’ perspective. To meet the needs of retired drivers will be especially challenging. Intermediate solutions between mainstream public transport and individual demand-responsive transport are also needed for those who no longer can drive or use the mainstream alternative. The STS was not considered to be an attractive enough alternative by any of the participants.
Walking was something that Viewpoint 1 and 2 valued. Findings from a focus group study (Fristedt, Bj rklund, Wretstrand, & Falkmer, 2011) acknowledged that walking was anö activity individuals preferred to engage in to stay healthy and active. Such experiences of exercise that benefits from everyday community mobility have been reported by other research (Metz, 2000). According to a recent study, walking was the most frequently used mode of transport (McCluskey, et al., 2010). Consequently, walking is clearly an activity that occupational therapists working with older people need to consider.
Mainly in Viewpoint 1, but more or less in all viewpoints, quality of life was linked to participation in activities. However, focusing on statements related to what they actually did, some differences were revealed. Even if Viewpoint 1 and 2 showed similar desire to participate in activities outside the home and with equal satisfaction in doing so, people representing Viewpoint 1 (mainly drivers), were more satisfied with their possibilities to participate, than those of Viewpoint 2. Participants on Viewpoint 1 also, based on their ranking of statements, seemed to participate more frequently in activities outside the home and considered it most important to be able to transport themselves. According to their Q sorts, people representing Viewpoint 3 participated more frequently in activities outside the home, and were more satisfied with their possibilities to participate than people sharing Viewpoint 2. Viewpoint 3 also indicated less dependence on travelling by car compared with Viewpoint 1. Those sharing Viewpoint 2 showed satisfaction with less frequent activities outside the home. A recent study indicates that women participate significantly less in activities out of home (McCluskey, et al., 2010). However, this cannot be confirmed by our findings, since no significant gender differences were found with respect to the viewpoints. However, it is important to note that this reasoning is based upon the statements considering participation in comparison to other statements used for the purpose of this study. Consequently, no absolute measurements were used.
Furthermore, no single group of activities can be said to be more beneficial than others (Hammel, et al., 2008), as long as they satisfy the individual needs related to doing, being, becoming and belonging (Wilcock, 2006). Social participation, among other things providing belonging, has been previously described, and is clearly beneficial at older age
(Dahan-Oliel, G linas, & Mazer, 2008; Wilcock, 2006). However, social participation isé probably included in statements concerning both leisure activities and social activities in this study. Thus this is something people on all viewpoints seemed to engage themselves in more or less. The findings of this study suggest that having a sufficient and adequate mode of transport was considered important to enable the participants to engage in social activities.
By using Q-methodology additional information from a subjective perspective was added compared to the previously conducted survey (Wretstrand, et al., 2009) and the focus groups conducted at the same occasion (Fristedt, et al., 2011) as the Q sorts. Through the Q-sorts we were able to identify the importance of each statement related to other statements. This was particularly useful related to preference of mode of transport in the present study. These findings have potential implications for societal planning directed towards older peoples’ community mobility. Furthermore, using the Q sorts rather than survey questions helped us to identify more than travel habits since drivers pertained to viewpoint “prefer being mobile by PT” and vice versa. As it turned out preference for the car or PT and declined use of STS characterized at least two of the viewpoints. The possibility to identify the relevance of other statements related to these preferences was yet another advantage obtained through the use of Q-methodology.
Q-methodology seemed to work well in our sample of older people. All participants also performed their Q-sorts in a way that indicates that they understood the task and reflected on the choices they made doing their Q-sort. Some limitations in this study concern the statements that were used. Without having additional information as a reference it would have been difficult to interpret some of the statements. For example, statements 37 and 45 concerned car use and were not applicable to everyone. Furthermore, a statement about participation in important and meaningful activities was missing, but would have been useful. Finally, statement 2-5 may be interpreted as factual (Ellingsen, Storksen, & Stephens, 2010). However, in line with the theoretical assumptions in the present study participation is based on self-reference. Nevertheless, to avoid that statements are interpreted as factual it would have been beneficial to start these statements (2-4) with “I am satisfied with my participation in…” or “Participation in … activities are important for me”.
As noted before, the perspective of male non-drivers are also lacking in this study. However, this reflects not only the sample but also this cohort (Siren, et al., 2004). Non-driving males is an area for future research.
One limitation pertaining to the design is that Q-methodology cannot provide information on the strength or share of a certain viewpoint in the general population (Brown, 1980).
However, these viewpoints provide valuable insights to reasons why different modes of transport are preferred and how these modes facilitate community mobility and participation in activities outside the home for a group of older people. Occupational therapists need to consider the impact of modes of transport when enabling individuals to participate in activities outside the home. Particular consideration needs to be given to those who can no longer drive or use public transport.
References
American Occupational Therapy Association. (2002). Occupational therapy practice framework: Domain and process. American Journal of Occupational Therapy 56, 609-639.
Barry, J., & Proops, J. (1999). Seeking sustainability discourses with Q methodology.Ecological Economics, 28, 337-345.
Bowling, A., & Gabriel, Z. (2007). Lay theories of quality of life in older age. Ageing and Society, 27, 827-848.
Broome, K., McKenna, K., Fleming, J., & Worrall, L. (2009). Bus use and older people: A literature review applying the Person-Environment-Occupation model in macro practice. Scandinavian Journal of Occupational Therapy., 16, 3-12.
Broome, K., Worrall, L., McKenna, K., & Boldy, D. (2010). Priorities for an Age-Friendly Bus System. Canadian Journal on Aging, 29(3), 435-444. doi: 10.1017/SO71490810000425 Brown, S. R. (1980). Political Subjectivity. Application of Q Methodology in Political Science.
New Haven: Yale University Press.
____________ (1996). Q methodology and Qualitative Research. Qualitative Health Research, 6(4), 561-567.
Burnett, P., & Lucas, S. (2010). Talking, walking, riding and driving: The mobilities of older adults. Journal of Transport Geography, 18, 596-602. doi: 10.1016/ j.jtrangeo. 2010.05.006
Cannon Hendricksson, C., & Mann, W. C. (2005). Changes Over Time in Community Mobility of Elders with Disabilities. Physical & Occupational Therapy In Geriatrics, 23(2/3), 75-89.
Classen, S., Winter, S., & Lopez, E. D. S. (2009). Meta-syntesis of Qualitative Studies on Older Driver Safety and Mobility. OTJR: Occupation, Participation and Health, 29(1), 24-31. Corr, S. (2006). Exploring Perceptions About Services Using Q Methodology. In G. Kielhofner (Ed.), Reseach in Occupational Therapy. Methods of Inquiry for Enhancing Practice. Philadelphia: F.A. Davis Company.
Cresswell, T. (2010). Towards a politics of mobility.Environment and Planning D: Society and Space, 28, 17-31.
Dahan-Oliel, N., G linas, I., & Mazer, B. (2008). Social Participation in the Elderly: What doesé the Literature Tell Us? Clinical Reviews in Physical and Rehabilitation Medicine, 20(2), 159-176.
27, 49-65.
Ellingsen, I. T., Storksen, I., & Stephens, P. (2010). Q methodology in social work research. International Journal of Social Research Methodology, 13(5), 395-409.
Fristedt, S., Bj rklund, A., Wretstrand, A., & Falkmer, T. (2011). Continuing Mobility andö Occupational Participation Outside the Home in Old Age Is an Act of Negotiation. Activities, Adaptation & Aging, 35(4), 275-297. doi: 10.1080/01924788.2011.625213 Golob, T. F., & Hensher, D. A. (2007). The trip chaining activity of Sydney residents: A cross-section assessment by age group with a focus on seniors.Journal of Transport Geography, 15, 298-312. doi: 10.1016.jtrangeo.2006.09.005
Gustavsson, A. (2004). Inledning [Introduction]. In A. Gustavsson (Ed.),Delaktighetens spr kå [The Language of Participation]. Lund: Studentlitteratur.
Hammel, J., Magasi, S., Heinemann, A., Whiteneck, G., Bogner, J., & Rodr guez, E. (2008).í What does participation mean? An insider perspective from people with disabilities. Disability and Rehabilitation, 30(19), 1445-1460.
Hjorthol, R. J., Levin, L., & Siren, A. (2010). Mobility in different generations of older persons. The development of daily travel in different cohorts in Denmark, Norway and Sweden. Journal of Transport Geography, 18(5), 624-633. doi: 10.1016/j.jtrangeo. 2010.03.011
Howell, D. M., & Cleary, K. K. (2007). Rural Seniors’ Perceptions of Quality of Life. Physical and Occupational Therapy in Geriatrics., 25(4), 55-77. doi: 10.1300/J148v25n04_04 Krekula, C. (2007). The Intersection of Age and Gender: Reworking Gender Theory and Social
Gerontology. Current Sociology, 55, 155-171. doi: 10.1177/0011392107073299 Law, M. (2002). Participation in the Occupations of Everyday Life. American Journal of
Occupational Therapy, 56(6), 640-649.
Magasi, S., Hammel, J., Heinemann, A., Whiteneck, G., & Bogner, J. (2009). Participation: a comparative analysis of multiple rehabiltation stakeholders’ perspectives. Journal of Rehabiltation Medicine, 41, 936-944.
Mann, W. C., McCarthy, D. P., Wu, S. S., & Tomita, M. (2005). Relationship of Health Status, Functional Status, and Psychosocial Status to driving Among Elderly with Disabilities. Physical and Occupational Therapy in Geriatrics., 23(2/3), 1-24. doi: 10.1300/ J148v23n02_01
McCluskey, A., Thurtell, A., Clemson, L., & Kendig, H. (2010). A study investigating the travel habits and preferences of older Australian adults with a fall risk.Australasian Journal on Ageing. doi: 10.1111/j.1741-6612.2010.00480.x
Mollenkopf, H., Marcellini, F., Ruoppila, I., Sz man, Z., Tacken, M., Kaspar, R., & Wahl, H.é (2002). The Role of Driving in Maintaining Mobility in Later Life: A European View. Gerontechnology, 1(4), 231-250.
Musselwhite, C., & Haddad, H. (2010). Mobility, accessibility and quality of later life. Quality in Ageing and Older Adults, 11(1). doi: 10.0.5042/qiaoa.2010.0153
Newbold, K. B., Scott, D. M., Spinney, J. E. L., Kanaroglou, P., & P ez, A. (2005). Travelá behavior within Canada’s older population: a cohort analysis. Journal of Transport Geography, 13, 340-351. doi: 10.1016/j.trangeo.2004.07.007
Reinholdt Hagebeck, C., & Waara, N. (2007). Attitudes toward public transport among elderly in a sparsely populated municipality. Paper presented at the TRANSED COMOTRED, Montreal, Canada.
Schmolck, P. (2002). PQ method. Muenchen. Retrieved from www.lrz-muenchen.de/ ~schmolck/pqmethod/pqmanual.htm
Siren, A., Hakamies-Blomqvist, L., & Lindeman, M. (2004). Driving Cessation and Health in Older Women. Journal of Applied Gerontology, 23(1), 58-69.
_______ & ____________________ (2006). Does gendered driving create gendered mobility? Community related mobility in Finnish women and men aged 65 +.Transportation Research Part F, 9, 374-382. doi: 10.1016/j.trf.2006.06.010
Stalvey, B. T., Owsley, C., Sloane, M. E., & Ball, K. (1999). The Life Space Questionnaire: A Measure of the Extent of Mobility of Older Adults. The Journal of Applied Gerontology, 18(4), 460-478.
van Exel, J., de Graaf, G., & Rietveld, P. (2004). Getting from A to B: Operant Approaches to Travel Decision Making. Operant Subjectivity, 27(4), 194-216.
Webler, T., Danielson, S., & Tuler, S. (2009). Using Q method to Reveal Social Perspectives in Environmental Research. Retrieved from www.ser-us.org/pubs/Qprimer.pdf Whiteford, G. E., & Pereira, R. B. (2012). Occuaption, inclusion and participation. In G. E.
Whiteford & C. Hocking (Eds.), Occuaptional Science Society, Inclusion, Participation. Chichester: Wiley-Blackwell.
Whitehead, B., J., Howie, L., & Lovell, R., K. (2006). Older people’s experience of driver licence cancellation: A phenomenological study. Australian Occupational Therapy Journal, 53, 1-8. doi: 10.1111/j.1440-1630.2006.00564.x
WHO. (2001). International Classification of Functioning, Disability and Health. Geneva: World Health Organization
Wilcock, A. A. (2006). An Occupational Perspective of Health. Thorofare: SLACK Incorporated. Wilkie, R., Peat, G., Thomas, E., & Croft, P. (2006). The prevalence of person-perceived
participation restriction in community-dwelling adults. Quality of Life Research, 15, 1471-1479.
Wretstrand, A., Svensson, H., Fristedt, S., & Falkmer, T. (2009). Older People and Local Public Transit: Mobility Effects of Accessibility Improvements in Sweden. Journal of Transport and Land Use, 2(2), 49-65.
국문초록
노인의 지역사회 유동성과 참여에 대한 시각
Sofi Fristedt
PhD student, School of Health Sciences, J nk ping Universityö ö
Anders Wretstrand
Assistant Professor, Faculty of Engineering, Lund University
Anita Bj rklundö
Professor, School of Health Sciences, J nk ping Universityö ö
Susan Corr
Professor, Occupational Science, School of Health, The University of Northampton
Torbj rn Falkmerö
Professor, School of Occupational Therapy and Social Work, Curtin University
배경 목표 지역사회의 유동성은 여러 활동의 참여에 영향을 미친다 그러나 지역사회 유동성에 영/ : . 향을 미치는 지식과 집 밖에서의 활동 참가는 매우 제한적이다 참가와 지역사회 유동성이 주관적. 으로 판단되는 현상이기 때문에 내부인의 견해가 반영된 더 많은 지식이 요구된다 이 연구의 목표, . 는 지역사회의 유동성과 참여에 대한 노인들의 견해를 조사하는 것이다 방법. : 36명의 남녀 참가자 가 Q 방법론을 통해 연구에 참가하였고 참가자 중에는 운전자와 비운전자가 포함되어있다 참가자, . 는 45가지의 Q 진술로 분류하였고 그 진술은 그들의 유동성에 대한 현재의 습관적 상황과 집 밖에, 서의 활동에 대한 참여를 반영하고 있다. 주제어 활동성: , Q방법론 스웨덴 북유럽, ,