?
Realigning railways
in track renewals
- methods and objectives
* Paper presented at the 1:st International Conference
Railway Engineering -98, July 10, 1998, Brunel
University, Uxbridge, West London, United Kingdom
oo
05
05
Flno
6
m
X 0 >. h H h B (I)Björn Kufver
, ,' Hw lww wl ' MN WW ' , w Mul lll wll MUN wwww wwwl wwww wwwA , , , ll lw wwww llww wwwl ll ' " Wi ll i" " ,,l
llwi
Swedish National oadand
* , if d
VTI särtryck 303 ' 1998
Realigning railways
in track renewals
methods and objectives
Paper presented at the 1:st International Conference
Railway Engineering -98, July 10, 1998, Brunel
University, Uxbridge, West London, United Kingdom
Björn Kufver
Cover illustration: VTI archives. Down lines N2 and N1 of the Southern Main Line (the two tracks to the left) at the station Älvsjö were renewed during the summer 1998. For down line N2, the platform constitutes a binding obstacle where minimum and maximum accepteable gap between train and platform de nes a very narrow terrain
corridor. The terrain corridor for down line
N1 is wider, permitting longertransition
; .. 45553 .. curves and an increased design speed SWé ish 33333! Hägg ååå (130 km/h for conventional trains and ISSN 1102-626X ____ Ha S g i gtityfe 160 km/h fortilting trains respectively).
REALIGNING RAILWAYS IN TRACK RENEWALS
- METHODS AND OBJECTIVES
Björn Kufver VTI Railway Systems SE-581 95 Linköping
Sweden
KEYWORDS: Alignment, Curvature, Slew, Track irregularity, Track standards, Regression analysis ABSTRACT
Track renewals offer cost-effective opportunities for improvements in alignment. Careful planning of alignment is always recommended. With the use of curvature and slew diagrams, small changes in lateral position are easily analysed. Obstacles may define boundary conditions for equally costly alignment alternatives, and since there are several possible alignments at each cost level, the alternative permitting the highest possible train speed may be chosen.
INTRODUCTION
The horizontal alignment is often a binding constraint for permissible train speeds, even though modern trains (tilting trains) may compensate for certain shortcomings in this respect. The alignment has a high degree of permanence, since changes will affect various technical subsystems such as substructure, superstructure, catenary systems, etc. Hence, improvements in the alignment are usually associated with high costs.
However, track renewals offer relatively cost-effective opportunities for improvements in alignment, since the old superstructure is replaced by a new one. Hence, careful planning of the horizontal alignment is always recommended before track renewal.
DATA ACQUISITION
Although it is preferable to survey the track with geodetic methods, less expensive versine measurements with track recording
cars may also be considered, since versines may be transformed into a set of local coordinates [Kufver, 1995]. Using a
symmetric chord, the following formulas may be used to generate the local coordinates:
2-1),-1/1,- 2 WM + 2 - arcsin( L ) (1) L
xi+l z xi + 2 COSGVi)
(2)
L . Yi+1 = Yi ""E' srn(w,-) (3)where 1/1,- = direction from point i to point i+1,
v,- : versine measured at point i [m], and L = chord length [m]
However, there are certain drawbacks with local coordinates derived from versine measurements: They are less accurate than surveyed coordinates. Slew values based on local coordinates may be used in the next lining operation (but not subsequently), and there is no direct connection between the alignment and adjacent obstacles. Catenary masts, platform edges, etc. must be dealt with separately.
ALIGNMENT CALCULATIONS Slew and curvature diagrams
Alignment and corresponding slew calculations may be performed with standard road and/or railway design software [Kufver, l997a]. The specific problem with alignment calculations for maintenance and track renewal lies in analysing slew values with small magnitudes. Ordinary maps (showing the horizontal x-y plane) are of little use, and should be replaced by curvature and slew diagrams. Analysis of curvature and slew diagrams indicates clearly the consequences arising when transition lengths and radii are changed, and when single curves are replaced by compound curves.
Interpretation of the results
The graphic interpretation is based on Taylor expansions and small angle approximations of the surveyed existing track and the calculated track, which are possible when using a local coordinate system in which the track centre line runs in approximately the x-direction.
On circular curves, the y-coordinate of the calculated track may be approximated by
2
S
yc(S) yc0+vlc0'S+5 _?
C
where s = stationing [m], yd) : y-coordinate at s=0 [m], 1/ch : direction at s=O [rad] and RC : radius [m] Similarly, the y-coordinate of the existing track may be approximated by
2
S
ye(S) :=; yeO + l eO 'S+5 _E+ yirr(S)
where yir,(s) : lateral irregularities [m]
The slew is approximately the difference between the y coordinates, which gives 1
1 2
Slewz(y60_yc0)+(WeO WCO)°S+( j._yirr(s)
ReR
C
(4)
(5)
(6)
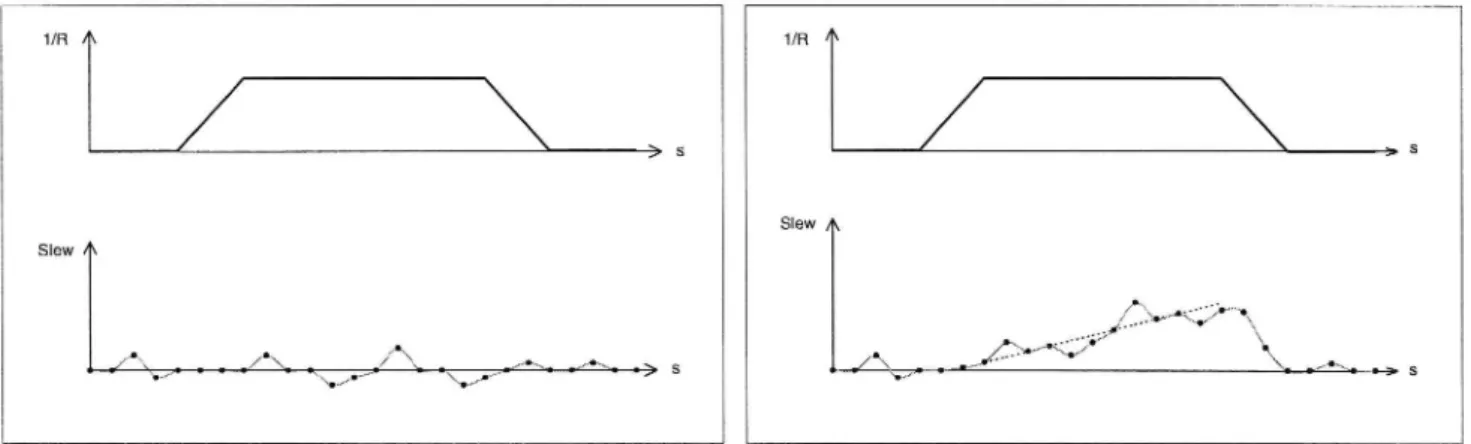
If the calculated alignment has the same radii and transition lengths as the existing track, the first three terms in Equation (6) will be zero and the slew diagram will consist of a random scatter around the zero-level, see Figure la. However, in old track, magnitudes of radii and transition lengths are often not known with sufficient accuracy. If there are differences in the alignment of the existing and calculated track, the resulting slew values will be systematically non-zero. The pattern of the resulting slew values will show the type of changes that have been introduced. If the slew in the circular portion of the curve
forms a scatter around a linear trend, as in Figures lb and 1c, the sz-term will obviously be zero, indicating that the calculated
radius RC equals the existing radius in the track Re. If the slew in the circular portion forms a second degree parabola, as in Figure 1d, RC will not equal Re. If there is more than one parabola in an element which has been assumed to have a constant
radius, the curve will contain several circular portions.
1/R
/
/S Slew1/R Slew
a. no changes in the alignment b. changed length of run-out transition
1/R
/
\
Slew1/R
/
Slewc. changed transition lengths
Figure 1. Curvature and slew diagrams
Equally costly alignment alternatives
So far, this discussion has focused on the track itself. However, in track renewal the existing superstructure is replaced with a new one, and 100 mm of slew is normally not significantly more expensive than 20 mm of slew. What really affects the cost is whether or not existing installations (catenary masts, platform edges, etc.) have to be replaced. Indeed, we may state that all alignment alternatives passing the same set of obstacles are equally costly to build.
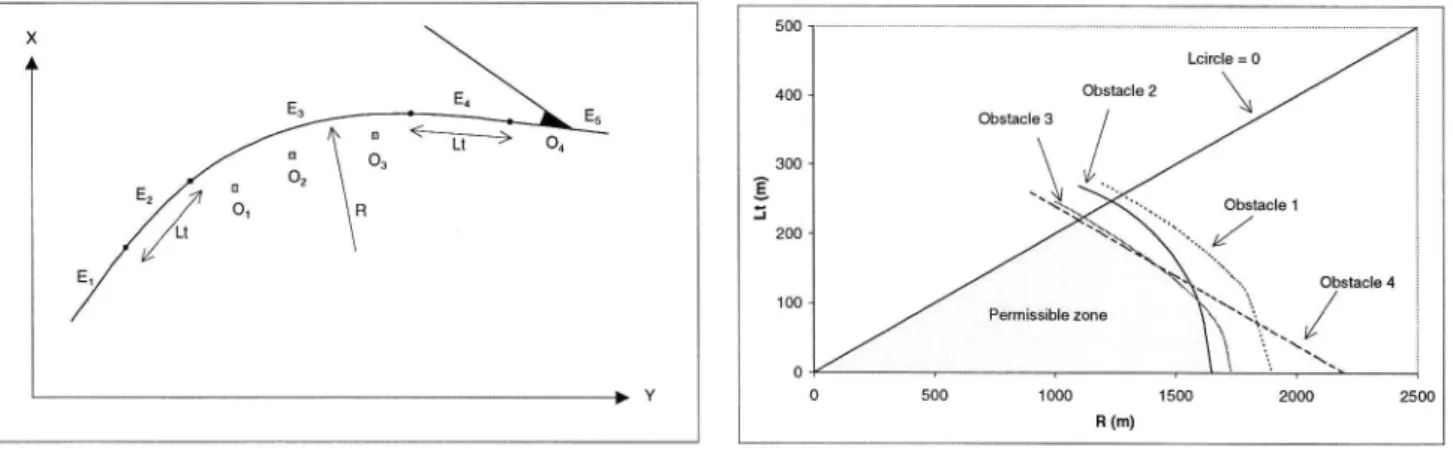
The concept of equally costly alignments alternatives is illustrated with a clothoid - circle - clothoid combination, which corresponds to the most frequent case in a design process. If the two transition curves are equally long, the curve layout may be described with two variables: radius (R) and transition length (Lt). The figures below show the curve and four obstacles in the x-y plane and a corresponding R Lt plane. The four obstacles consist of three catenary masts and a turnout, which should preferably remain straight.
500
A Lcircle = 0 400 _ Obstacle 2 Obstacle 3 300 -..- * x "" Obstacle 1 _| * & -. 200 isxx
\
\\7 x --._ Obstac|e 4 100 Permussnble zone_ . xx \ ;b~\3. -.\
o * \\ > Y O 500 1000 1500 2000 2500 R (m)a. x-y plane b. R-Lt plane
Figure 2. A clothoid - circle - clothoid combination with obstacles
The objective should now be to choose the best combination of radius R and lengths of the transition curves Lt. These two variables define the axes in Figure 2b. Some conditions are shown in the R-Lt plane. The diagonal through the origin defines the transition length where the length of the remaining circular part is zero. The R axis defines the zero lengths of the transition curves. The length chosen for the transition curves must be within the sector defined by these two border lines. In Figure 2b, also inequalities, which are defined by the obstacles, are illustrated. In reality, there is at least one binding constraint (otherwise there would be no curve at all). In Figure 5, the obstacle 01 is never binding and may be disregarded in the analysis. It should be noted that it is necessary to make distinctions between obstacles and fixed points (points which the track centre line is forced to pass at pre-defined distances), since the obstacles normally define inequalities.
We may expect the best alignment to be found on the border defined by the obstacles, since an R-Lt combination within the permissible zone may be improved by larger radius and/or longer transition curves. At the border, increased lengths of the transition curves always result in a smaller radius.
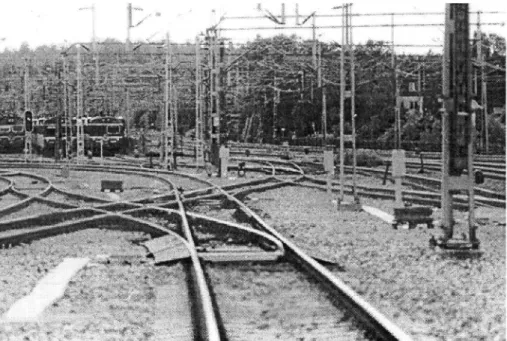
Figure 3. A double slip as a (binding) longitudinal obstacle in the up line of the Nynäs Line, Älvsjö.
Obiect functions
A regional track engineer or an external consultant may use the permissible train speed according to the track standards as the object function. A graphic representation of such an approach is shown below.
In Figure 4, the permissible speed for conventional non-tilting trains (according to the limits in Table 1) is illustrated in the R-Lt plane, where each R-Lt combination has a cant maximising the permissible train speed. The best solution will be R=1365 m and Lt=153 m or slightly more, which permits train speeds of 170 km/h. Combinations permitting train speeds of 175 km/h and higher are outside the permissible zone (equally costly zone) since they require at least obstacles 03 and 04 to be removed. 500 Lcircle : 0 400 _ Obstacle 2 Obstacle 3 300 E 170 km/h : 200 _ Obstacle 1 50 km/h Obstacle 4 100 130 km/h Cant 150 mm Permissible zone . . Cant deficiency 100 mm 0 r | 7 | 0 500 1000 1500 2000 2500 Rate Of cant 46 mm/s
R (m) Rate of cant deficiency 46 mm/s
Figure 4. Permissible speed in the R-Lt plane. Table 1. Limits applicable for conventional trains in Sweden.
A common problem when increasing the permissible train speeds is short transition curves [Baluch, 1982, 1983; Kufver,
1997c]. Even though tilting trains may run faster than conventional trains on small curve radii, it is still necessary to deal with short transition curves. Hence, a common measure in track renewals consists of a combination of increased transition lengths and reduced curve radii. The resulting slew at the longitudinal positions of the obstacles is preferably analysed with the slew diagrams in Figures 2b 2d.
For the track engineer at the central planning department, who is responsible for track standards, and the researcher, the question is whether or not the R-Lt combination permitting the highest possible train speed is the combination which gives the most favourable vehicle reactions in terms of wheel/rail forces and passenger comfort. Such investigations are currently being conducted at VTI Railway Systems [Kufver, 1997b d, 1998].
Regression analysis as an automatic procedure for alignment calculations
Least-squares fits of the alignment (choosing the transition lengths and curve radii in order to minimise the sum of the squared slew values) has recently been marketed as an automatic procedure for alignment calculations, However, such a method does not provide reasonable results [Kufver, 1997a]. The least squares method generally gives a result where the track is not fully adjusted in large misalignments and where the track is shifted laterally also in the case of no misalignments. This will also have an in uence on the determination of the radius. Another shortcoming of the least-squares method is that no attention is paid either to obstacles or to design speed and passenger comfort.
CONCLUSIONS
Even though existing structures present many obstacles along the alignment, there are certain degrees of freedom which should be taken into account in track renewals. The track should preferably be surveyed with geodetic methods or alternatively with a track recording car.
Even though tilting trains may run faster than conventional trains on circular curves with small radii, short transition curves remain to be dealt with by the track engineers. The obstacles along the route define boundary conditions which must be considered when comparing alignments associated with the same construction cost. Slew diagrams are very efficient when analysing changes of small magnitudes.
ACKNOWLEDGEMENTS
This paper is based on results from a research project on alignments financed by Adtranz Sweden, the Swedish National Rail Administration (B anverket), the Swedish Transport and Communications Research Board (KFB), the Swedish State Railways (SJ), and the Swedish National Road and Transport Research Institute (VTI).
REFERENCES
Baluch, H. (1982). Optimation of transition length increase. Rail International, Vol. 13, No. 10, 12 19.
Baluch, H. (1983). Increasing the lengths of the transition curves by a reduction of the main curve radius. Rail International, Vol. 14, No. 1, 10-15.
Kufver, B. (1995). Koordinatbaserad baxberäkning av pilhöjdsmätta spår (Slew calculations based on local coordinates derived from versine measurements of railway tracks, published in Swedish only). VTI Meddelande 754. Linköping: VTI. Kufver, B. (1997a). Mathematical description of railway alignments and some preliminary comparative studies. VTI Rapport 420A. Linköping: VTI.
Kufver, B. (1997b). Methods for evaluation of ride comfort as a function of vehicle reactions caused by railway alignment. VTI Rapport 421A. Linköping: VTI.
Kufver, B. (1997c). Optimisation of single horizontal curves in railway alignments. VTI Rapport 424A. Linköping: VTI. Kufver, B. (1997d). Variables and criteria for evaluation of vehicle reactions caused by railway alignment. VTI Notat 43-97. Linköping: VTI.
Kufver, B. (1998). High speed railways: Alignment optimisation with vehicle reactions taken into consideration. Nordic