VTI rapport 675A Published 2010
www.vti.se/publications
Evaluation of the LTL-M
Mobile measurement of road marking
Publisher: Publication:
VTI rapport 675A
Published: 2010 Project code: 40793 Dnr: 2007/0553-28
SE-581 95 Linköping Sweden Project:
Evaluation of the MR
Author: Sponsor:
Sven-Olof Lundkvist Danish Road Directorate
Norwegian Public Roads Administration Swedish Road Administration, SRA
Title:
Evaluation of the LTL-M – Mobile measurement of road marking
Abstract (background, aim, method, result) max 200 words:
An equipment for mobile measurement of road marking retroreflectivity, the LTL-M, has been
developed by DELTA Light & Optics in Denmark. This instrument uses a different optical principle than the mobile instrument commonly used until now, the Ecodyn 30. The optical system used by the LTL-M might lead to better accuracy and repeatability.
By simultaneous measurements using the two mobile instruments and, as the reference, the hand-held LTL-2000, the accuracy and repeatability of the LTL-M and Ecodyn 30 were estimated. Measurements were carried out in the laboratory on road marking samples and in the field on continuous and broken edge lines.
The conclusion of the study is that the LTL-M measures with less systematic and random errors
compared to the Ecodyn 30. Furthermore, the repeatability of the LTL-M is better than the repeatability of the Ecodyn 30.
Keywords:
mobile measurement, reflectometer, retroreflectivity, road marking
Utgivare: Publikation:
VTI rapport 675A
Utgivningsår: 2010 Projektnummer: 40793 Dnr: 2007/0553-28 581 95 Linköping Projektnamn:
Utvärdering av mobil reflektometer av typ MR
Författare: Uppdragsgivare:
Sven-Olof Lundkvist Vejdirektoratet Vegdirektoratet Vägverket
Titel:
Utvärdering av LTL-M – mobil mätning av vägmarkeringar
Referat (bakgrund, syfte, metod, resultat) max 200 ord:
DELTA Lys & Optik i Danmark har utvecklat ett instrument för mobil mätning av vägmarkeringars retroreflexion, LTL-M. Detta instrument använder en annan optisk princip än det instrument som vanligen har använts hittills, Ecodyn 30. LTL-M:s optiska system skulle kunna innebära att mätfelen reduceras.
Genom samtidig mätning med LTL-M, Ecodyn 30 och, som referens det handhållna instrumentet LTL-2000, har de mobila instrumentens validitet och repeterbarhet skattats. Mätningar gjordes i labora-toriet på vägmarkeringssampel och i fält på heldragna och intermittenta kantlinjer.
Slutsatsen från studien är att LTL-M mäter med mindre systematiska och slumpmässiga fel än Ecodyn 30. LTL-M har även bättre repeterbarhet än Ecodyn 30.
Nyckelord:
mobil mätning, reflektometer, retroreflexion, vägmarkering
ISSN: Språk: Antal sidor:
Preface
This project was undertaken within NMF – the Nordic Meeting for Improved Road Equipment. The study was financed by road authorities in Denmark, Norway and Sweden, where the following persons were responsible:
Denmark, Danish Road Directorate Peter J Andersen Norway, Norwegian Public Roads Administration Bjørn Skaar Sweden, Swedish Road Administration Hans G Holmén
The hand-held measurements were carried out by Lars Eriksson, VTI, and the author, the LTL-M measurements by Kai Sørensen and Asbjørn Mejnertsen, DELTA Light & Optics, and the Ecodyn 30 measurements by Peter Lövmo, Ramböll RST.
Analysis and documentation have been carried out by the author.
Linköping, January 2010
Quality review
Internal peer review was performed on January 18th 2010 by Sara Nygårdhs, VTI. Sven-Olof Lundkvist has made alterations to the final manuscript of the report. The research director of the project manager, Jan Andersson, examined and approved the report for publication on January 28th 2010.
Kvalitetsgranskning
Intern peer review har genomförts 2010-01-18 av Sara Nygårdhs, VTI. Sven-Olof Lundkvist har genomfört justeringar av slutligt rapportmanus. Projektledarens närmaste chef, Jan Andersson, VTI, har därefter granskat och godkänt publikationen för
publicering 2010-01-28.
Table of contents
Summary ... 5
Sammanfattning ... 7
1 Background and aim of the study ... 9
2 Instrument information ... 10
2.1 The hand-held instrument ... 12
3 Method... 13 3.1 Laboratory measurements ... 13 3.2 Field measurements ... 13 4 Results... 16 4.1 Definitions ... 16 4.2 Laboratory study ... 16 4.3 Field study ... 17 5 Discussion ... 22 6 Conclusion ... 23 References ... 24 Appendix A Appendix B
Evaluation of the LTL-M – Mobile measurement of road marking
by Sven-Olof Lundkvist
VTI (Swedish National Road and Transport Research) SE-581 95 Linköping Sweden
Summary
As traffic flow levels increase, there is a growing demand for mobile measurement methods. On busy roads, it is not safe to use hand-held instruments as measurement staff must work on the road. Instead, both for the safety of staff and drivers, mobile measurements in traffic speed are preferred. This study presents an evaluation of a mobile reflectometer, the LTL-M, developed by DELTA Light & Optics in Denmark. In practice, a vehicle based retroreflectometer will have some tilt or lift relative to the road marking surface caused by movements of the vehicle or camber of the road. This leads to changes of the actual distance, either randomly or systematically, and thereby changes of the measured RL value because of the distance law of illumination. The
LTL-M uses an optical system, which may be described as a simulation of the defocused system, refer to section 2. This optical system should make measurement reliable, meaning only small systematic and random errors. In the first phase of the study, the two optical principles (focused and defocused) were tested and compared in the laboratory by varying length, height and measurement angles.
Thereafter, a field study, involving measurements of several types of road markings in Denmark and Sweden was carried out. In this second phase, the two mobile instru-ments, the LTL-M and Ecodyn 30, were used and the reference instrument was the hand-held LTL-2000. Furthermore, repeatability was studied by measuring each test section twice.
The result of the laboratory study showed that readings using the focused optical system (Ecodyn 30) may suffer from large measurement errors due to changes in measurement geometry. Contrary, the readings of the LTL-M, using the defocused system, were almost independent of the measurement geometry. Consequently, the laboratory meas-urements clearly indicated that the defocused optical system is preferable on a mobile reflectometer.
In the field study, the readings of the LTL-2000 were seen as the key, although even these measurements suffer from errors. Furthermore, the readings are not entirely comparable as the LTL-2000 was used to measure only a small percentage of the road marking area, while the LTL-M measured virtually all of the area. However,
comparison of readings of the LTL-M and the Ecodyn 30 showed:
LTL-M Ecodyn 30
Systematic error 3.6% 10.6%
Random error 5.3% 12.5%
The conclusion from the laboratory and field measurements is that the LTL-M measures with less systematic and random errors compared to the Ecodyn 30. Furthermore, the repeatability of the LTL-M is better.
Finally, it is suggested that a larger field study is carried out. This study would include not only the LTL-M and Ecodyn 30, but also other mobile instruments on the market.
Utvärdering av LTL-M – mobil mätning av vägmarkeringar
av Sven-Olof Lundkvist VTI
581 95 Linköping
Sammanfattning
På högtrafikerade vägar är det inte lämpligt att göra mätningar med handhållna instru-ment eftersom detta innebär risker både för mätpersonal, som måste befinna sig på vägen, och för trafikanter. Istället är det önskvärt att i största möjliga utsträckning utföra funktionsmätningar med mobila mätmetoder i en hastighet som inte avviker mycket från övrig trafik. Föreliggande rapport dokumenterar en utvärdering av ett nyligen utvecklat mobilt instrument för mätning av vägmarkeringars retroreflexion. Instrumentet, som benämns LTL-M, är utvecklat av DELTA Lys & Optik i Danmark.
Att en reflektometer är monterad på ett fordon innebär att mätvinklar och mäthöjd (över vägmarkeringsytan) kommer att variera under mätningens gång, vilket i sin tur leder till en förändring av det faktiska mätavståndet. Belysningsstyrkan vid instrumentet följer den kvadratiska belysningslagen, vilket innebär att det registrerade retroreflexionsvärdet kommer att bli felaktigt. Emellertid använder LTL-M en optik som simulerar ett de-fokuserat optiskt system, vilket är mindre känsligt för felaktig mätgeometri. Detta borde innebära att LTL-M mäter med mindre systematiska och slumpmässiga fel än instrument som använder fokuserat mätsystem. I den första fasen av projektet jämfördes de två optiska systemen – det defokuserade och det fokuserade – med avseende på
mätningarnas noggrannhet och precision genom att mätvinklar och mäthöjd i statiska laboratoriemätningar varierades systematiskt.
I studiens andra fas gjordes mobila fältmätningar på kantlinjer i Danmark och Sverige med LTL-M och Ecodyn 30, varav den sistnämnda använder ett fokuserat optiskt system. För att studera repeterbarheten gjordes två mätningar på varje mätsträcka. Som referens gjordes handhållna mätningar med LTL-2000, varvid resultat från mobila och handhållna mätningar jämfördes.
Laboratoriestudien visade att mätningar med ett fokuserat system (Ecodyn 30) kunde vara behäftade med stora fel. Däremot var LTL-M:s mätvärden så gott som oberoende av mätgeometrin. Således kunde laboratoriemätningarna bekräfta att ett defokuserat mät-system är att föredra vid mobil mätning av retroreflexionen.
I fältstudien ansågs de handhållna mätningarna vara facit, även om också dessa är behäftade med små systematiska och slumpmässiga mätfel. Vidare ska det påpekas att handhållna och mobila mätningar egentligen inte är helt jämförbara eftersom det hand-hållna instrumentet mäter på endast en liten del av den totala vägmarkeringsarean, medan de mobila mätningarna registrerar nästan hela arean. Ändå visade de jämförande mätningarna följande:
LTL-M Ecodyn 30
Systematiskt mätfel 3,6 % 10,6 %
Slumpmässigt mätfel 5,3 % 12,5 %
Repeterbarhet 3,3 % 7,0 %
Slutsatsen av studien är att LTL-M mäter med både mindre systematiska och slumpmässiga fel än Ecodyn 30. Jämfört med Ecodyn 30 har även LTL-M bättre repeterbarhet.
Slutligen föreslås en ytterligare fältstudie, i vilken även andra på marknaden förekom-mande instrument undersöks.
1
Background and aim of the study
As traffic flow levels increase, there is a growing demand for mobile measurement methods. On busy roads, it is not a good idea to use hand-held instruments as measuring staff must work on the road. Both for the safety of staff and drivers, mobile measure-ments in traffic speed are preferred.
Regarding road marking, mobile retroreflectivity measurement equipment has been used for almost 20 years. In Europe, the French Ecodyn has been in production since late 80’s and has been in use in the Nordic countries for more than ten years. The 30 metre
version of this instrument, the Ecodyn 30, was tested in Sweden in 1999 – documented in VTI Rapport 444A (Lundkvist, 1999). Since then, the instrument has been developed and measurement errors reduced, which for instance has been documented by Lundkvist (2009). However measurement errors are still too large for some applications, e.g. when using the results of a measurement to decide a dispute. Therefore, there is a need for an instrument that measures the performance of road markings even more accurately than the current Ecodyn 30.
A new mobile retroreflectometer, the LTL-M, has been developed by DELTA Light & Optics. This instrument, by using a somewhat different measurement technique than the Ecodyn 30, might increase the accuracy of mobile measurement. The aim of this study is to investigate and compare measurement errors of the LTL-M and Ecodyn 30.
The report focuses on the in-situ measurements which were carried out in order to investigate the reliability and validity of the LTL-M, and also to compare this new instrument with the Ecodyn 30. Furthermore, some results from the laboratory measurements, which were carried out with the purpose of testing the measuring principle, are presented.
2 Instrument
information
The LTL-M uses the 30 m standard measuring geometry according to EN-1436 (CEN, 2007) with a reduced scale of all dimensions so that the actual measuring distance is 6 m. The Ecodyn 30 is based on the same reduction of the scale of the 30 m geometry and this is the case for a few more mobile instruments that are available on the market, although the scale may be different.
In practice, a vehicle based retroreflectometer will have some tilt or lift relative to the road marking surface caused by movements of the vehicle or camber of the road. This leads to changes of the actual distance, either randomly or systematically, and thereby changes of the measured RL value because of the distance law of illumination. A lift
leads to changes of the ratio between the angles of illumination and measurement, and thereby changes of the measured RL value as this ratio is a factor inherent in the RL
value.
Similar changes might be expected with a portable retroreflectometer, as there will be some tilt or lift when placing it on a road marking surface. However, the LTL-X and the LTL-2000 handheld retroreflectometers provide a virtual infinite measuring distance by optical means. This eliminates the influence of small displacements of the illuminated field. Additionally, the fields are arranged according to method B described in EN 1426 (the measured field encloses the illuminated field) and this eliminates the influence of the ratio between the angles. All together, this may be called the defocused system and is sometimes referred to as collimating optics.
The defocused system cannot be used directly for vehicle based retroreflectometers as these need to have large widths of the measured field in order to allow for steering. However, the principles of the LTL-M include the effects of the defocused method and in the following, for short, the LTL-M is referred to as using the defocused system. The measurement errors, using the defocused system, were tested in the laboratory, see Chapter 3.
The light source is flash discharge lamp which is not of Type A according to the defini-tion in ISO/CIE 10526 (ISO/CIE, 1999). However, the spectral response of the pho-tometer is modified to provide a correct overall spectral response of illumination and measurement (this is permissible according to EN 1326).
The illuminated field on the road surface is approximately 1 m wide and 1 m long. The measured field is placed within the illuminated field, and is limited by gaps in broken road markings and by the widths of the markings. This allows for a fairly large error margin in steering. Double lines are measured simultaneously. Results actually include not only RL values, but also the road marking geometry (widths and punctuations of
broken lines) and even the relative geometry of measurement between the retroreflecto-meter and the road marking surface.
A portable retroreflectometer normally has a cover to reduce the signal from ambient light, in particular from direct sun. A vehicle based retroreflectometer cannot have a cover at the measured field out in front of the vehicle, and must therefore use some other method to provide the reduction.
The Ecodyn 30 uses modulated illumination in combination with selective amplification at the modulation frequency. The Laserlux uses selective reception in a narrow band of wavelengths that includes the wavelength of the laser. The LTL-M uses yet another method, which is exposure during the very short time interval of the flash, during which
the flash dominates over other light. None of these methods are quite sufficient in the case of direct sun, so that the signal from the ambient light has to be measured and subtracted. The LTL-M uses an effective method to do that for each measurement. The LTL-M is calibrated by means of a calibration block with a tilted white surface. Either of the types used for the LTL-X or the LTL-2000 can be used.
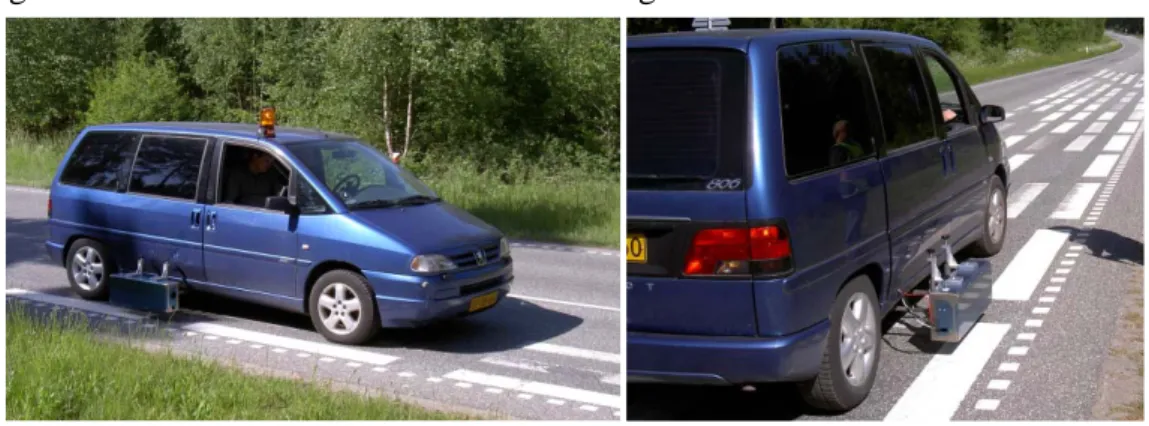
Figure 1 shows the LTL-M mounted on a Peugeot van.
Figure 1 The LTL-M mounted on a Peugeot van.
After the 2008 laboratory measurements, the LTL-M was modified in order to improve the repeatability of the instrument. Therefore, the instrument was not identical in the laboratory and field measurements.
The instrument tested in the field study in 2009 is the only one manufactured so far, and must be seen as a prototype. The development has been considerable and the actual prin-ciples are not likely to be modified. However, the practical application and software are still being improved.
As mentioned in the above, the Ecodyn 30 uses the same measurement geometry as the LTL-M. However, the system is focused, which may make the readings sensitive to changes in the geometry of the system. The Ecodyn 30 uses 14 photo-cells, each with a measurement width of 40 mm, and the reading is by choice the average of the one or two cells which show the highest value. In this way, the reading is an average of 40 or
80 mm of the road marking width, respectively. In this study, the 80 mm measurement width was used for field measurements. The light source is a halogen lamp giving
continuous light. However, in order to avoid influence from surrounding light, a chopper technique is used. The software has been adjusted for measurement of broken road marking, one metre in length. Figure 2 shows the Ecodyn 30.
Figure 2 The Ecodyn 30.
It should be stressed that the Ecodyn 30 used in this study has been modified for meas-urement of Swedish road marking design. Therefore, the results may not be comparable to results from older Swedish studies or other studies carried out in Europe or the US.
2.1 The
hand-held
instrument
The hand-held LTL-X and LTL-2000 were used as references in the laboratory and field measurements, respectively. The two instruments are identical regarding measurement geometry, both use a defocused optical system, and are in almost every other respect equivalent. Both instruments are well-known and measurement errors are known to be small, which has been reported by among others Bernstein (2000).
The instrument used in this study was recently calibrated in the laboratory.
3 Method
3.1 Laboratory
measurements
Using the mobile instruments, static measurements in the laboratory were performed on 12 samples of new road markings applied to metal panels. The purpose of these meas-urements was to compare the two measuring principles, the defocused (LTL-M) and the focused (Ecodyn 30). The following procedure was used:
In the first series of measurements, the instrument was mounted, calibrated and adjusted for measurement of the sample 6 metres ahead and two readings were registered. There-after, the instrument was dismounted and shut off, whereupon the procedure – mounting, calibrating and adjusting – was repeated. From those measurements, the repeatability and reproducibility was estimated.
The measurement reading of the LTL-M represented the average retroreflectivity of the entire sample area, while the Ecodyn 30 reading was an oval-shaped area with largest width of 40 mm located in the centre of the road marking. Thus, as the two mobile instruments did not measure on the same area and as the sample surfaces were not homogeneous, they should not read exactly the same value.
In the second step, on some of the 12 samples, the measurement geometry varied systematically in order to find the influence of measurement height and angles when using the two measuring principles.
Readings using the LTL-X were registered for all samples. On each sample almost the entire road surface area was measured.
3.2 Field
measurements
The field measurements were divided into two categories:
• Validation measurements on sections, approximately 200 metres of length • Production measurements on sections up to 12 km of length.
3.2.1 Validation measurements
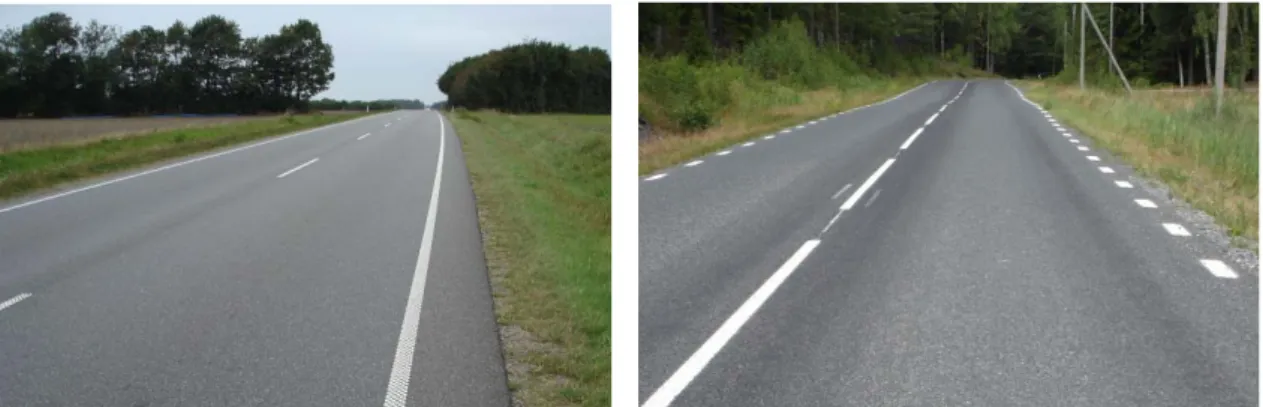
In order to check the validity and repeatability of the two mobile instruments, measure-ments were carried out on 28 sections of dry edge lines, each approximately 200 metres in length. In Denmark, 22 sections with continuous edge lines and in Sweden, 6 sections with broken edge lines were selected and measured. The road markings in Denmark were test markings, and were in most cases, profiled. However, they had an appearance like regular markings; only the recipe of the compound or the type of glass beads varied. All road markings were 100 mm wide. Figure 3 shows a typical Danish and Swedish test section.
Measurements with the two mobile instruments were carried out almost simultaneously (within 30 minutes). Furthermore, each test section was measured twice in order to esti-mate the repeatability of the instruments.
In Denmark, the hand-held measurements were completed within 30 minutes after the mobile ones. However, due to darkness, two test sections were measured the day after. This is believed to have no influence on the results as there was no precipitation during the night and the road markings were dry in both cases.
Using the LTL-2000, hand-held readings were recorded every 5th metre in Denmark and every 6th metre in Sweden along the entire section of approximately 200 metres. This resulted in between 30 and 40 readings on each test section.
Figure 3 Typical test sections in Denmark and Sweden with continuous (left) and broken (right) edge lines.
3.2.2 Production measurements
In order to investigate how the instruments perform during real conditions, when the length of an object might be up to 10 km, 32 sections were measured using the mobile units. The primary aim of these measurements was not to compare the results of the measurements, but to assess the reliability of the instruments. Could any specific problems be identified? It is one thing to carry out one single measurement on a short section of the road, but how do the instruments work when used 10 hours a day for several days?
3.2.3 Test sections
The test sections used in Denmark and Sweden are defined in Table 1. Three of the test sections in Sweden were located on high-trafficked roads. Due to the Swedish road work regulations, hand-held measurements were not carried out on these sections.
Table 1 Test roads in Denmark and Sweden. Each test road was divided into x number of sections, each with different types of road marking. Validation measurements were performed on ten of the roads, comprising of 28 test sections.
Country Road No. Test section No. Length of section (km) Length measured (km) Divided into x test sections Denmark 213 dk1 – dk4 1.4 5.6 4 E47* dk5 11.7 23.4 1 469 dk7 2.0 8.0 1 469 dk8-dk15 5.0 20.0 8 475 dk17-dk19 1.5 6.0 3 24 dk20-25 4.2 16.8 6 Sweden E6* s4 6.0 24.0 1 21 s10 4.5 18.0 1 24* s13 2.8 11.2 1 101 s18 0.2 0.8 1 104 s19 2.7 10.8 1 108 s20 3.1 12.4 1 108** s21 4.2 16.8 1 110 s22 4.3 17.2 1 115 s23 3.8 15.2 1 * Only production measurements were carried out on this test road.
** Excluded from the analysis.
On most of the test sections in Table 2, measurements were carried out twice on both sides of the road. Generally, this means that the measured length is four times of the length of the section.
Test road S21 was excluded from the analysis because of human error. By mistake, the results of the LTL-2000 were presented before DELTA carried out the analysis. This meant that it was possible (but not likely) for DELTA to adjust the LTL-M result to readings of the hand-held measurements. Therefore, to be absolutely fair, this test section was omitted.
All measurements were carried out on dry road markings, first in Denmark on roads 213 and E47 on Zealand, then on all Swedish test roads in Scania and finally on the Danish roads located in Jutland. In this way, all measurements were completed within three days.
4 Results
4.1 Definitions
In Sections 4.2, 4.3 and 4.4, the parameters shown in tables and figures are defined as follows:
The systematic measurement error, ε, has been defined as:
n LTLX R LTLX R mobile R n i Li Li Li
∑
= − = 1 ) ( / )) ( ) ( ( ε [1]where RLi(mobile) and RLi(LTLX) is the retroreflectivity of sample i when measured
using the mobile instrument and the hand-held LTL-X, respectively. n is the number of samples or test sections.
The random error, using the same denotations as above, is defined as:
n LTLX R LTLX R mobile R n i Li Li Li
∑
= − = 1 ) ( ) ( ) ( ε [2]Furthermore, the repeatability is the difference between two measuring rounds and is calculated as: n mobile R mobile R mobile R n i Li Li Li rep
∑
= − = 1 2 2 1( ) ( ) / ( ) ε [3]The reproducibility is also calculated using Equation [3], but in this case the instrument was re-calibrated between the two measurement rounds (laboratory measurements only).
4.2 Laboratory
study
In Table 2 the results of the laboratory test are summarized from a previously published report by Ramböll RST (Lundkvist, 2009).
Table 2 Measurement errors and influence on RL due to deviation from correct
measurement geometry. The figures are based on measurement of 12 samples.
Defocused (LTL-M) % Focused Parameter (Ecodyn 30 % systematic error +0.6 -3.0 random error ±7.7 ±7.5 repeatability ±1.8 ±0.3 reproducibility ±5.3 ±13.3
influence of measuring distance 1), deviation 20% 1–11 23–47 influence of measuring height 2), deviation 20% 2–14 9–67 influence of tilting instrument 3), tilting 2–5 degrees 1–7 4–11 influence of lateral measuring angle 4), dev. 2,5 degrees 1–5 1–17 Influence of lateral position 5), deviation 0,1–0,2 metres 1–4 0–16
1) by tilting the instrument forwards/backwards
2) by lifting/lowering the instrument and simultaneously tilting it forwards/backwards to keep the distance constant
3) by a sideward’s tilt
4) by aiming the instrument to the side and simultaneously moving it sideward’s to keep the sample in the centreline
5) by moving the instrument to the side without aiming, to bring the sample away from the centreline
The results of the laboratory test clearly show that all measurement errors, except random error and repeatability, are significantly smaller using the defocused measure-ment principle - especially so with the errors associated with changes of the measuring geometry. This is a strong indication that a mobile instrument should use this optical principle as the measuring geometry may vary due to the movements of the vehicle or camber of the road.
It must be stressed that two measuring principles, not two instruments, were tested. However, the LTL-M showed an undesirable random error, which probably affects repeatability. The source of this error was identified as poor control of zero-signal, which was improved in two steps with the last step introducing direct measurement of the zero-signal and compensation in each measurement.
4.3 Field
study
4.3.1 Validity and repeatability of the mobile instruments
In Section 4.1, Equations [1], [2] and [3] were used for estimation of measurement errors and repeatability of the two mobile instruments. In the field test, the readings of the hand-held instrument (LTL-2000) were considered as “the true RL values”. This means
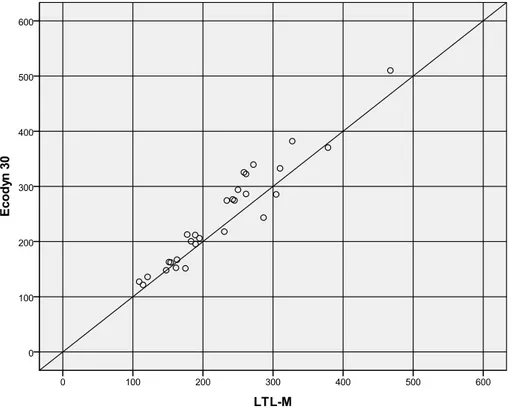
The validity of the mobile instrument can be illustrated by the relationship between mobile and hand-held readings. This is shown in Figures 4 and 5 for the LTL-M and the Ecodyn 30, respectively.
Figure 4 Relationship between the LTL-M and hand-held readings for 28 types of road marking. Average of two measurement rounds.
Measurement errors, repeatability and correlation between the LTL-M and hand-held readings were:
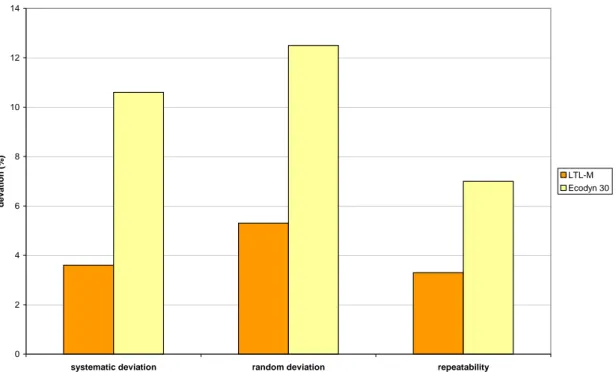
Systematic deviation between the LTL-M and
hand-held readings 3.6%
Random deviation between the LTL-M and
hand-held readings 5.3%
Repeatability – deviation between two
measurement rounds, using the LTL-M 3.3% Correlation between readings of the LTL-M
and the hand-held instrument 0.988
The corresponding results for the Ecodyn 30 are:
Figure 5 Relationship between the Ecodyn 30 and hand-held readings for 28 types of road marking. Average of two measurement rounds.
Measurement errors, repeatability and correlation between the Ecodyn 30 and hand-held readings were:
Systematic deviation between the Ecodyn 30
and hand-held readings 10.6%
Random deviation between the Ecodyn 30
and handheld readings 12.5%
Repeatability – deviation between two
measurement rounds, using the Ecodyn 30 7.0% Correlation between readings of the
Ecodyn 30 and the hand-held instrument 0.964
The deviations between the mobile instruments the LTL-2000 are summarized in Figure 6.
As mentioned earlier, the edge lines are continuous in Denmark, while they are broken in Sweden. Therefore, the measurement deviations stated above can be divided into those two types of road marking. This is shown in Figure 7 for the two mobile instru-ments.
0 2 4 6 8 10 12 14
systematic deviation random deviation repeatability
devatio n ( % ) LTL-M Ecodyn 30
Figure 6 Deviations between mobile and hand-held measurements.
-10 -5 0 5 10 15 systemati c deviation random deviation
repeatabil ity systemati c deviation random deviation repeatability de v ia ti on ( % ) LTL-M Ecodyn 30 Denmark Sweden
Figur 7 Deviation between readings of the two mobile instruments and the hand-held LTL-2000, divided into results from continuous road markings in Denmark and broken markings in Sweden.
4.3.2 Production measurements
As stated before the main purpose with the production measurements was to investigate and compare the performance of the instruments, during “real” measurements on road sections up to 10 km of length. This part of the study showed that both instruments were reliable. During measurement of a road length of 206 km, only one fault occurred, a malfunction with the LTL-M software. However, this was detected quickly and
corrective measures taken, which should mean that this error will not occur again. The Ecodyn 30 worked without any malfunction during the three days of measurement. It should be noted that the LTL-M is still in the final stages of development, while the Ecodyn 30 is in a mature stage after several years of use.
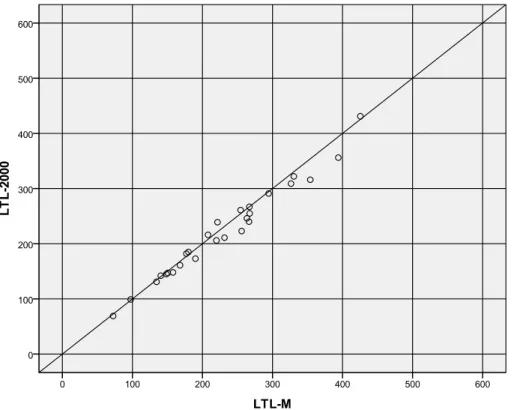
Figure 8 shows the results from the production measurements.
Figure 8 Relationship between readings from the two mobile instruments, the LTL-M and the Ecodyn 30. Measurements of 32 sections, up to 12 km of length. Average of two measurement rounds.
As can be seen, there is a deviation between readings from the two instruments, which was expected after studying the results of 4.3.1.
5 Discussion
The laboratory study showed clearly that the measurement principle of the LTL-M is more reliable than that of the Ecodyn 30 as the LTL-M proved less sensitive to changes in the measurement geometry.
Of course, in the laboratory all measurements were static and changes in geometry were controlled. However, when mounted on a moving vehicle many parameters will change in a rather uncontrolled way. Therefore, with the results from the laboratory in mind, it was not surprising to find that the LTL-M measurements were more reliable than the Ecodyn 30 measurements.
In the Ecodyn 30 study of 2000, previously referred to, the repeatability and the repro-ducibility of the LTL-2000 was also tested. The repeatability of LTL-2000 was found to be 2.4%, which is only slightly better than the LTL-M repeatability of 3.3%.
Furthermore, the deviation between readings of the LTL-2000 and the LTL-M was found to be only slightly larger than the deviation found between two specimens of the LTL-2000. This indicates that the LTL-M measures almost as accurate as the hand-held instrument. The measurement errors of the Ecodyn 30, on the other hand, are clearly larger than those of the LTL-2000, which also was found by Bernstein (2000). When judging the results in general one must have in mind that we do not have the absolutely true values for road marking retroreflectivity as even the hand-held readings suffer from measurement errors. Furthermore, the area which is measured is not equal: Hand-held measurement involves sampling, taking one reading in the centre of the road marking approximately every 5th metre. Contrary, the LTL-M reads one RL-value each
metre, and this value is an average of the entire road marking width. This means that on a 200 m long section of a continuous edge line of 0.10 m width, the LTL-M includes almost all of the road marking area, 20 m2, while LTL-2000 reads an average of approximately 0.34 m2, corresponding to 1.7% of the total area. This may affect the comparison of LTL-M and LTL-2000 measurements. It may be pointed out that the systematic deviation determined in the laboratory measurements, where the measured areas were identical, was only 0.6%.
The reliability test, which involved the measurement of more than 200 km of length, showed that both instruments performed well. One malfunction occurred when the software of the LTL-M crashed. However, this was a simple error which was taken care of immediately. Moreover, there were no problems with any of the two mobile instru-ments.
6 Conclusion
The mobile instrument LTL-M has been found to measure almost as accurate as a hand-held instrument and measures more accurately than one of its competitors, the Ecodyn 30. However, the test carried out was limited and it would be of great interest to test more than one specimen of the final version of the LTL-M. Finally, a comparison, not only with the Ecodyn 30, but also with other mobile instruments, should be carried out. One possi-bility would be to do that work within CEN TC226/WG2.
References
Bernstein, H., Evaluation findings of the LTL 2000 Pavement Marking
Retroreflecto-meter, Highway Innovative Technology Evaluation Center (HITEC), Collage Station,
TX, USA, 2000.
European Committee for Standardization, Road marking Materials – Road marking performance for road users, European Standard EN 1436:2007, Brussels, Belgium, 2007.
International Organization for Standardization, CIE standard illuminants for
colori-metry, ISO/CIE 10526:1999, Geneve, Switzerland, 1999.
Lundkvist, S-O., Evaluation of Ecodyn 30: validation of a mobile instrument for
measuring the retroreflection of road markings, VTI Rapport 444A, Linköping, Sweden, 1999.
Lundkvist, S-O, RMT State of the art measurements. Measurment of road marking performance 2008, App. C (Swedish). Ramböll Report 2009-02-09, Linköping, Sweden, 2009.
Annex A Page 1 (1)
Tabell A1 The retroreflectivity (mcd/m2/lx) of a 200 m test section. Average of two measuring rounds using the two mobile instruments and of 35–40 readings using the hand-held LTL-2000.
test section LTL-2000 Ecodyn 30 LTL-M
dk1 239 281,5 221,5 dk2 267 322,5 267,0 dk3 255 303,5 267,5 dk4 291 323,0 294,5 dk7 69 76,5 72,5 dk8 131 161,0 134,5 dk9 173 182,0 190,0 dk10 147 153,0 150,5 dk11 145 154,0 148,5 dk12 142 144,0 140,5 dk13 148 169,5 158,0 dk14 356 385,0 394,0 dk15 99 133,5 97,5 dk17 240 235,0 266,5 dk18 316 316,5 354,0 dk19 246 245,5 263,5 dk20 185 190,5 180,0 dk21 206 263,5 220,0 dk22 261 316,0 254,5 dk23 309 409,0 326,5 dk24 322 408,5 330,5 dk25 431 505,5 425,5 s18 161 147,0 168,0 s19 182 174,0 177,0 s20 216 209,0 208,0 s21 353 315,5 * s22 211 184,5 231,5 s23 223 227,5 256,0 * Not measured.
Annex B Page 1 (1)
Tabell B1 The retroreflectivity (mcd/m2/lx) of test sections, 0.1–11.7 of length. Average of two measuring rounds using the two mobile instruments.
test sectiom Ecodyn 30 LTL-M
dk1 322,5 261,5 dk2 325,5 258,5 dk3 294,0 250,0 dk4 276,5 242,5 dk5 339,5 272,0 dk7 121,5 114,5 dk8 213,0 177,5 dk9 148,0 147,5 dk10 206,0 195,0 dk11 167,0 163,0 dk12 162,0 154,0 dk13 163,0 151,5 dk14 370,5 378,5 dk15 127,5 109,0 dk17 243,5 286,5 dk18 285,5 304,5 dk19 286,5 261,5 dk20 200,5 183,0 dk21 274,5 234,0 dk22 274,5 245,0 dk23 332,5 310,0 dk24 382,0 327,5 dk25 510,0 467,5 s4 136,0 121,0 s10 199,5 192,0 s18 152,5 161,5 s19 195,5 189,5 s20 212,0 189,0 s21 279,0 * s22 151,5 175,0 s23 218,0 230,5 * Not measured.
www.vti.se vti@vti.se
VTI är ett oberoende och internationellt framstående forskningsinstitut som arbetar med forskning och utveckling inom transportsektorn. Vi arbetar med samtliga trafikslag och kärnkompetensen finns inom områdena säkerhet, ekonomi, miljö, trafik- och transportanalys, beteende och samspel mellan människa-fordon-transportsystem samt inom vägkonstruktion, drift och underhåll. VTI är världsledande inom ett flertal områden, till exempel simulatorteknik. VTI har tjänster som sträcker sig från förstudier, oberoende kvalificerade utredningar och expertutlåtanden till projektledning samt forskning och utveckling. Vår tekniska utrustning består bland annat av körsimulatorer för väg- och järnvägstrafik, väglaboratorium, däckprovnings-anläggning, krockbanor och mycket mer. Vi kan även erbjuda ett brett utbud av kurser och seminarier inom transportområdet.
VTI is an independent, internationally outstanding research institute which is engaged on research and development in the transport sector. Our work covers all modes, and our core competence is in the fields of safety, economy, environment, traffic and transport analysis, behaviour and the man-vehicle-transport system interaction, and in road design, operation and maintenance. VTI is a world leader in several areas, for instance in simulator technology. VTI provides services ranging from preliminary studies, highlevel independent investigations and expert statements to project management, research and development. Our technical equipment includes driving simulators for road and rail traffic, a road laboratory, a tyre testing facility, crash tracks and a lot more. We can also offer a broad selection of courses and seminars in the field of transport.
HUVUDKONTOR/HEADOFFICE
LINKÖPING BORLÄNGE STOCKHOLM GÖTEBORG
POST/MAIL SE-581 95 LINKÖPING POST/MAIL BOX 920 POST/MAIL BOX 55685 POST/MAIL BOX 8077
TEL +46(0)13 20 40 00 SE-781 29 BORLÄNGE SE-102 15 STOCKHOLM SE-402 78 GÖTEBORG