Abstract--The use of ground-sourced heat pumps as main heating systems has increased in Sweden in the last fifteen years to the point that it is the country with the highest amount of GSHP in Europe. Heat pumps are chosen by many households due to their economic savings value; In contrast, electricity prices in Sweden have almost doubled since 2006, threatening their economic benefits. It is therefore, essential to understand GSHPs impact on the user´s electricity consumption and provide suitable demand-response programs that could help develop a model capable of forecasting consumption and provide decision support information to make the best use of the technology. This paper analyses questionnaire surveys and consumption patterns were evaluated for 322 households with installed GSHPs and different pricing schemes in order to increase the understanding of mass use of this type of heating system.
Index Terms—Demand forecasting, Energy Consumption, Heat Pumps, Power Systems, Smart Grids, Electricity Demand.
I. NOMENCLATURE CHP Combined Heat and Power COP Coefficient of Performance DH District Heating
DR Demand Response
EH Electric Heating
GSHP Ground-Sourced Heat Pump RTP Real-Time Pricing TOU Time-Of-Use
DSM Demand-Side Management
II. INTRODUCTION
weden’s energy use in the residential sector in 2010, was 166 TWh, 40% of Sweden’s total final energy use. Almost 60% of the sector’s energy use is for heating and hot water.
District heating, oil, biofuel and electricity are the main sources of energy used for heating purposes, being the latter the one with the highest usage increase, from 5 TWh/year in 1970 to 29 TWh/year in 1990. The increase in electricity consumption occurred mainly due to the installation of direct electric heaters and heat pumps; the latter, however, started declining after the that year [1]. One of the main causes of this
Special thanks to the Colombian´s national Science, Technology and Innovation administrative department, as well as the Tecnológica de Bolívar University for its financial support during my graduate studies.
Javier Campillo, Iana Vassileva, Fredrik Wallin and Erik Dahlquist are with the Department of Sustainable Development of Society and Technology at Mälardalen University in Västerås, Sweden. (e-mail: first.last@mdh.se)
was the active debate on the phase out of nuclear power plants in the energy system over the following years. This debate increased public´s concern regarding the use of electricity as an energy source for heating. In year 1995 heat pumps sales hit a minimum of less than 10.000 units sold per year [2].
In year 1995, the Swedish National Board for Technical Development (NUTEK) issued technology procurement on heat pumps and sales started increasing again. [3] At the end of the procurement, ground-sourced heat pumps were chosen. In consequence, these types of heat pump take a large share in the Swedish market for new heat pumps installations [2]. As a result, Sweden currently has the highest amount of GSHP installed in Europe as shown on table 1 [4].
TABLEI.
EUROPEAN GSHPINSTALLED BASE
Country GSHP Installed % Sweden 303600 44% Germany 117300 17% France 103500 15% Switzerland 55200 8% Austria 48300 7% Finland 41400 6% Norway 13800 2% Estonia 6900 1% TOTAL 690000 1
Ground sourced heat pumps can achieve a 1:3 electricity to heat conversion ratio [5], consequently, its usage growth facilitated a reduction not only of oil-based heating, but also district heating, increasing the overall electricity to heat conversion efficiency in the country. As a main result, in 2009, the use of electric heating decreased to 19 TWh.
The average cost of a turnkey solution for a GBHP in Sweden is between 11000 and 15000 EUR, while other options such as air-sourced and water-sourced cost between 1500-2300 and 8000-11000 EUR respectively. To reduce the initial cost, installation of heat pumps can apply for a tax reduction scheme approved in December 8, 2008 when renovating and performing extension works in private households [4].
The selection of sources of energy used for heating purposes varies for different housing types; electricity is the most common form of energy used for hot water and heating
Electricity Demand Impact from Increased use
of Ground Sourced Heat Pumps
J. Campillo
1, Student Member, IEEE, F. Wallin, Member, IEEE, I. Vassileva, Student Member, IEEE
and E. Dahlquist, Member, IEEE
in one and two-dwelling buildings, 14 TWh i used in 2009 compared to 13 TWh in bio district heating and 1.5 TWh in oil. Th experienced the highest use decline while pumps has steadily increased. In year 2009 used in 754.000 one and two-dwelling build roughly 40% of such homes [1].
On the other hand, district heating is th form of energy used for heating in multi-dw Its use in 2009 was 22 TWh; 91% of the tot heating and hot water in these types of hou heating accounted for only 1 TWh while oil Overall, oil use for heating continues to decli types; the total annual use amounted for 0.8 T Biomass burners (pellets) were used to re in existing heating systems up to 2006 where promotion and a subsidy scheme for repla many of the installations, however, did not su user´s expectations, mainly due to malfunctio the required workload by the customers. The has ended and the pellets price has increa growing number of pellet burners are current by heat pumps [4].
III. ELECTRICITY DEMAND IMPACT OF H Abundant precipitation, mountainous ri spots have allowed the Nordic countries t electricity, resulting in the highest demand f capita all over Europe [6].
In 2010, electricity production in the Nor 373.3 TWh; an increase of 1% compared with year, consumption was 396 TWh, an in compared to 2009. The largest rise in c Finland, due to the recovery of energy int after the financial crisis and the fact that 201 year and the temperatures during winter se than usual.
Nordic countries’ electrical system is v environmental factors because of a large us and strong connection between temperatur consumption, therefore, 2010 environm resulted in a production deficit of 30TWh an in the electricity spot price compared to 2 alone, In February 22nd, 2010, at 8 am, th
price was 1400 EUR/MWh, about 25 times average price [6]. During the rest of the yea price in Sweden was 54.48 EUR/MWH, th mean price even recorded. [7]
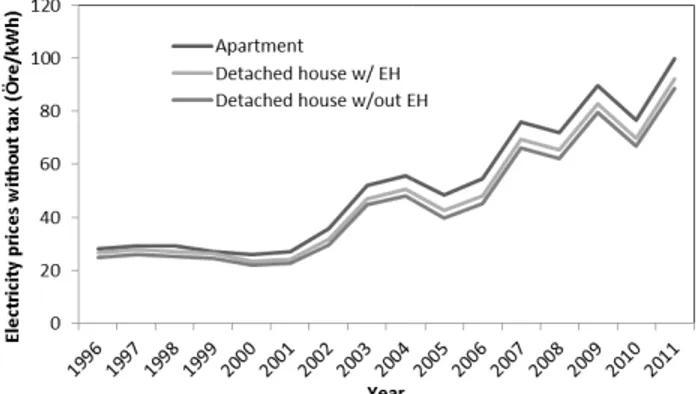
The electricity price trend has continued price per kWh for households in Sweden ha since 2006 reaching 0.11 EUR cents (99 ö Fig. 1 [8].
The main reason for selecting a heat pum energy for heating purposes is the estimated e over the lifetime of the system [9]. Investme about six years are expected where GSHPs a
in electricity were ofuels, 5 TWh in his last one has the use of heat heat pumps were dings in Sweden; he most common welling buildings. tal energy use for useholds; electric use was 0.4TWh. ine on all housing TWh of oil [1].
eplace oil burners e there was strong acing oil heating; ucceed in meeting oning systems and e subsidy scheme ased, therefore, a tly being replaced
HEAT PUMPS idges and windy to produce cheap for electricity per rdic countries was h 2009. The same ncrease of 3.8% consumption was tensive industries 10 was a very dry eason were lower very sensitive to se of hydropower re and electricity mental conditions nd a price increase 2009. In Sweden he electricity spot s higher than the ar, the mean spot he highest annual d to grow and the as almost doubled öre) as shown in mp as a source of economic savings ent return rates of are used to replace
a direct electric heating or combust the recent years’ electricity price in economic benefits.
Fortunately, development of sm in Sweden has brought new opportu its power system efficiency and relia demand response (DR) program household, commercial and industria to increase users’ flexibility and sele while maintaining a stable electrici patterns and available tariffs have order to allow GSHP users to stil benefits from their use.
Fig. 1. Electricity price without tax for ho the price per kWh is given in öre/kWh, 1 öre =
IV. DYNAMIC PRICIN Dynamic pricing schemes are im users shift power consumption from use times, in order to help balanc system. This is accomplished by mechanisms that are closer to the supply. The most common method where two or more tariffs are used fo times; Critical Peak Pricing (CPP) unless there is a high-peak critical s price per kWh is applied; Critical P users get paid to lower their consum times and Real-Time Pricing (RTP) applied [11].
To test variable pricing schemes performed to 460 households in 2 energy-based (accumulated cons (hourly-price) pricing scenarios we hourly consumption data in ord economic impact on their electricity
In order to analyse the different factor was used. The load factor between the maximum peak loads the average energy consumption represents a smoother load curve.
tion boiler [10]. However ncrease is threatening their mart-metering technologies unities for fully exploiting ability, such as price-based s at a large scale for al users. However, in order ect the best pricing scheme ity demand, energy usage
to be studied together in l get important economic
ouseholds in Sweden. (Note that = 0.0011 EUR) [8].
NG SCHEMES
mplemented to encourage m peak-use times to
lower-ce the load in the power y using dynamic pricing e real cost of electricity s are Time-of-Use (TOU) or high-peak and low-peak where a flat rate is used situation when a very high Peak Rebate (CPR) where mption under critical peak where spot market price is s in Sweden, a study was 2003 where conventional sumption) and dynamic ere simulated using users’
der to understand their bills.
t pricing schemes, a load was defined as the ratio on the billing period over . A closer value to 1
Fig. 2. Difference in customers’ yearly electricity cost when applying seasonal demand based tariff compared to the conventional energy tariff.
The results from the study showed than 49% of the users reduced their electricity bills of up to 330 USD/year while 42% of the users increased their cost in up to 460 USD/year. Some extreme cases showed savings or increased costs over those values and were treated separately. The results are shown in Fig. 2 [12].
A similar approach was proposed for analysing GSHP electricity consumption impact on the users’ electricity bills, in this case, a questionnaire was sent out to 735 households in the Sollentuna municipality, outside Stockholm and their electricity consumption bills were obtained billing periods up to 4 years before the study started.
V. METHODS AND MATERIALS
A research team at the School of Sustainable Development of Society and Technology (HST) at Mälardalen University performed a survey in a residential area with houses in the Sollentuna municipality in Sweden. The survey consisted of a questionnaire sent out to 735 households composed by 37 questions regarding their housing and energy consumption characteristics. A total of 528 households responded, from which a group of 322 (response rate of 43%) was selected formed by households with GSHP installed at least four years before the survey.
The purpose of these household selection criteria was to evaluate the impact on the electricity consumption of installing a new GBHP and its impact on the tariff, taking into account the pricing scheme used in Sollentuna. A comparative energy analysis was performed for four years: two years before and two years after the installation of the GBHP.
The local energy supplier provided hourly electricity consumption information for the four years of the study.
Additionally, the Swedish Meteorological and Hydrological Institute (SMHI) provided hourly outdoor temperature data for the Bromma weather station, the closest to Sollentuna.
In order to analyse only the heating energy consumption that is not affected by outside temperature, weather normalization was applied using SMHI’s degree-days for the difference between 17 oC and the daily mean outdoor
temperature.
VI. DISCUSSION &RESULTS
A. Questionnaire
A majority of the households had their own heating systems before the GSHP installation. 75% of the households said they had floor heating. 10% of the respondents had heat pumps even before the year of installation (23 households had GSHP while 9 had air-air heat pumps). During the period when the questionnaire was sent, already 320 households used GSHP and 12 air-air heat pumps.
B. GSHP Cost Impact
The average investment made by the homeowners was 120150 SEK (13000 EUR) (N=208). During the period March – April, DH costs are higher while GSHP are higher from October to February. It is important to bear in mind that these costs are only for the 10 years after the installation of the corresponding heating system. After that period the monthly costs drops with 78 Euros for DH and 92 Euros for GSHP making the GSHP a better alternative if considering a one year period; the life time of the GSHP, however, is limited while the DH needs no new investment making it cheaper in the long term if DH and electricity costs keep the same ratio.
Fig. 3. Average Energy cost comparison between district heating and ground-sourced heat pump for households in Sollentuna
Fig. 4. Annual electricity consumption in households that previously had direct electric water heaters. (Note: The energy consumption data was analysed over a time-span of 5 years, the year where the GSHP was installed was not taken into account in order to make a direct comparison of the consumption before and after installing GSHP over a full year).
0 50 100 150 200 250 300 350 400 450 500
Jan Feb Mar Apr May Jun Jul Aug Sep Oct Nov Dec
Co st (E ur o) Month DH GSHP 0 5000 10000 15000 20000 25000 30000 35000 40000
Year 1 Year 2 Year 3 Year 4 kWh/year
When comparing the electricity consumption reduction in households that previously had conventional electric water heaters, the reduction was 48% in average with some households saving up to 58% in their energy usage after installing GSHP, thus, reducing their investment return time.
C. GSHP Energy Usage Impact
With the purpose of better understanding the overall impact on electricity consumption for GSHP users, the responses of the questionnaires received from 202 consumers that used different heating sources from GSHP, were analysed. The objective of the analysis was to find households that used other heating sources but with similar physical characteristics as those that used GSHP. At the end, the main required difference was for those households to use only district heating (DH) as main source of heating. Also, in order to reduce noise in the energy consumption data, it was required for the filtered houses to use as minimum auxiliary heating systems as possible. The filtering criteria applied to the consumers are shown in Table II. As a result, energy consumption from 73 users was compared to the one from GSHP users for a period of 5 years.
TABLE II.FILTERING CRITERIA FOR COMPARISON GROUP Household Characteristic Filtering Criteria Household Type Detached House Ventilation System Natural Ventilation Aux Electrical Boiler? No
Main Heating System District Heating
1) Annual Electricity Consumption
The average annual electricity consumption was calculated for both the households with DH and those with GSHP. The consumption was calculated in kWh/m2/year. The results are shown in Fig. 5.
Fig. 5. Annual electricity consumption for DH-based households and GSHP-based households
The results revealed a minimum additional electricity consumption of 11.9% for GSHP-based households in year 2002 and a maximum additional electricity consumption of
76.5% in 2006, the year with the coldest winter of the 5 years analysed.
Moreover, the annual consumption for GSHP-based households was more stable over the 5 years period with an average of 133.2 kWh/m2/year while DH-based households experienced a continuous decrease in electricity consumption starting with 124.4 kWh/m2/year in 2002 and finishing with 71.76 kWh/m2/year in 2006, almost a 43% electricity consumption reduction.
Although not enough information for determining the reasons for the sustained consumption reduction in DH-based households was provided from the questionnaires, nor is the purpose of the present paper; several consumers acknowledged to have invested in energy-efficient appliances and to have done renovations in their households in order to reduce energy consumption. This implies that GSHP-based users can be less likely to obtain faster reductions in electricity use from increased use of energy-efficient appliances since HPs energy use is heavily affected by temperature conditions, substantially affecting the overall electricity consumption.
2) Monthly Electricity Consumption
To continue further analysing temperature impact on GSHP energy use, the monthly electricity consumption was compared between DH-based and GSHP-based households over the 5 years period. The resulting plot is shown in Fig. 6.
Fig. 6. Monthly electricity consumption for DH and GSHP-based households for the period 2002-2006.
By performing a monthly analysis and include average temperature data, greater understanding of the temperature impact on electricity use for GSHP-based households was obtained.
Electricity consumption between DH and GSHP-based households was very close during spring and autumn months, where nearly no heating or cooling is required; on the other seasons, especially during winter time, a great difference can be achieved.
The winter season of 2003 was in average the coldest of the 5 years analysed, the impact on GSHP-based households electricity use was accordingly; during that period of that year, the highest energy use was recorded. In contrast, the winter of
2005 was the warmest, and therefore, the resulting energy use was the lowest.
An interesting phenomenon occurred during winter of 2006 where even when not the lowest temperatures were recorded, a very low average occurred from December of 2005 to February of 2006. This resulted in high electricity use from GSHP-based households over a longer period of time, so even if the spike was not as high as the one obtained in 2005, it ended in a higher overall electricity consumption for the whole season. On the other hand, the summer of 2006 was the warmest and therefore, electricity use was the lowest, helping balance the overall annual consumption.
What it is important to annotate from this is how even a slight change in the average temperature during cold months, can create a dramatic change in the energy use, especially with continuous days with below-zero temperatures, where GSHP reduce their operation efficiency.
3) Hour of Day Use
Annual and seasonal electricity consumption information is very important from the user point of view. It helps understand how the electricity bill will behave over the course of the year but it also could be used as a general system overview from the utility side. On the other hand, hour of the day use, is vital for maintaining supply-demand balance and to keep a balance grid.
In order to understand this hour-of-the-day behaviour for DH and GSHP-based households, the critical months of the year (January and February) were analysed and its hourly electricity usage was plotted to make a suitable comparison together with the hourly average temperature outside.
In year 2002, shown in Fig.7., the morning and evening consumption peaks can be easily noticed, as expected from typical household electricity-use behaviour; GSHP-based households, however, show a different consumption trend between the hours 00:00 and 03:00, matching the lowest temperatures of the day. Also during these three hours, the highest consumption difference between GSHP and DH-based households is obtained, reaching 20% more electricity consumption for GSHP users. The morning peak occurs at 7 am for both DH and GSHP users, and the difference in electricity use between them is 13%. The afternoon curve slope is very similar between both users and it reaches a minimum-difference point at 17:00 when the difference reaches below 12%; matching the cumulated lower GSHP-use during the warmest hours of the day. The evening peak is the highest of the day, and it occurs at 18:00 for GSHP users and 19:00 for DH users.
2003 had the coldest temperatures of the 5-year period. Its impact can be noticed on the high consumption peaks for GSHP users and a higher electricity-use difference between DH and GSHP users during the low-temperature first hours of the day. Also, GSHP users experienced a flatter and higher electricity use through the day, compared to 2002. The morning peak occurred at 07:00 for GSHP users and was the highest peak of the day, while it occurred at 08:00 for DH users and was the lowest of both daily peaks. The evening
peak occurred at 19:00 for both users, during high-peak price time.
Fig. 7. Hourly Electricity consumption for DH and GSHP based households in the period January-February of 2002
Fig. 8. Hourly Electricity consumption for DH and GSHP based households in the period January-February of 2003
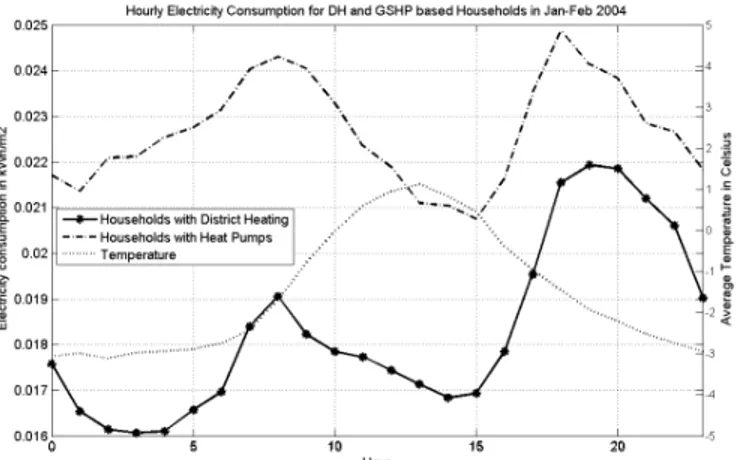
Fig. 9. Hourly Electricity consumption for DH and GSHP based households in the period January-February of 2004
The winter of 2004 was not as cold as the one in 2003, but it had a very cold February. This cold month impacted GSHP users’ electricity consumption heavily. As a result, up to 40% electricity use difference was obtained between both users during the first 5 hours of the day. The morning peak occurred
at 08:00 for both users, while the evening peak occurred at 19:00 for DH users and at 18:00 for GSHP users; this last one, however, had a very sharp consumption increase between 16:00 and 18:00 as shown in Fig. 9.
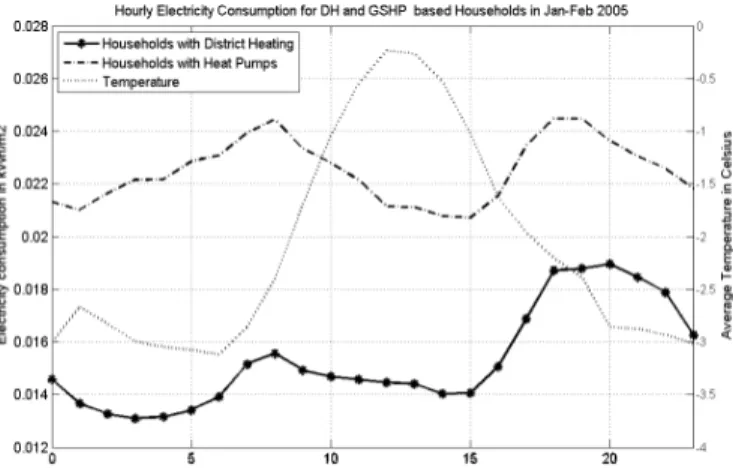
Fig. 10. Hourly Electricity consumption for DH and GSHP based households in the period January-February of 2005
The winter of 2005 experienced a very similar behaviour to the one obtained for the same period in 2004. An interesting effect occurred for the evening peak of DH users, since it shifted to 20:00 rather than 19:00 as obtained for previous years. The morning peak remained constant in time, occurring at 08:00 am for both users, followed by a period of lower electricity use, especially for GSHP, when outside temperatures reached warmer values. The evening peak for GSHP users occurred at 18:00, similar to previous years, however, not as sharp as the one obtained in 2004.
The winter of 2006 had the lowest average temperature during the whole season of the 5-year period analysed. Its impact on GSHP users was very severe, consuming twice as much electricity as users with DH-based systems. Average electricity use, however, was lower than the one obtained during the winter of 2003. The morning peak was very similar to the previous periods, for both users, occurring at 8am, while a peak shifting occurred for the evening peak for DH users, having their highest electricity use at 20:00 compared to GSHP users, whose evening peak remained at 18:00.
Fig. 11. Hourly Electricity consumption for DH and GSHP based households in the period January-February of 2006
VII. ACKNOWLEDGMENTS
Thanks to Sollentuna Energi for providing the required customer´s electricity use information and to all the users that participated in this project, for taking the time to respond to our questionnaires.
VIII. CONCLUSIONS AND FUTURE WORK
New installation of ground source heat pumps have maintained a constant increase over the past years, up to the point that Sweden has the highest amount of GSHPs installed in Europe. The main reason for this is the associated economic benefits. Several factors affect the electricity cost impact, but overall, there is a significant heating costs reduction opportunity, especially for households that previously had conventional electric water heaters, where savings per year of up to 58% were achieved.
GBHP therefore become a very cost-effective solution for one and two-dwelling households where access to DH is not possible. In multi-dwelling households, DSHP do not offer a similar significant economic benefit and in some cases can be more expensive in the long run so, DH systems are expected to maintain its predominant position for heating purposes in multi-dwelling houses.
Intensive use of GSHP has, however, several limitations; growing cost of the electricity in Sweden can increase the expected investment return time and become critical when tax exceptions for installing GSHP are not available anymore; another limitation is the high-peak price conditions during cold winters, the exact time when GSHP offer their lowest efficiency and are required the most.
On the bright side, intensive use of GSHP, also increases the opportunity for stimulating automatic demand-side management (ADSM) systems, where utilities can control the temperature settings of the GSHP, in order to provide a more stable demand-supply balance during peak-time conditions.
In order to make good use of ADSM systems, while maintaining users´ temperature comfort, energy storage systems should be encouraged, as well as investments in thermal insulation, in order to increase ADSM systems effectiveness.
Consequently, it becomes absolutely necessary to make use of efficient dynamic pricing schemes that would encourage users make the best use of their GSHP without compromising the power system’s demand balance, while maintaining a reasonable price for the end consumer.
To achieve this, development of simulation tools are necessary in order to provide a good decision support system for adopting the best available pricing schemes the new advanced metering systems are offering, combined with demand-response strategies such as heat storage during low-peak times.
IX. REFERENCES [1] Swedish Energy Agency, Energy in Sweden 2011,
2011.
[2] F. Karlsson, M. Axell, and E. Technology, Heat Pu Sweden - Country Report for IEA HPP, pp. 1–29, 2 [3] Swedish Energy Agency, NUTEK´s Heat Pump Co
1995.
[4] E. H. P. Association, M. Forsén, and T. Nowak, Ou European Heat Pump Statistics, Brussels, Belgium, [5] W. Goetzler, R. Zogg, H. Lisle, and J. Burgos, Gro Pumps: Overview of Market Status, Barriers to Ad for Overcoming Barriers, 2009.
[6] Elektrizitäts-Gesellschaft Laufenburg AG, The Fut Market: Power Flow Heading South - Prices North 2006.
[7] NordREG, NordREG report on the price peaks in th market during winter 2009-2010, 2011.
[8] Statistiska Centralbyrån, Priser på elenergi och på ö (nättariffer). http://www.scb.se/Pages/TableAndCh [Accessed: 22-Apr-2012].
[9] Swedish Energy Agency, Enkät- och fältundersökn bergvärmepumpar, 2003.
[10] Bergvarmepumpar.n.nu, Bergvärmepumpar - bespa http://www.bergvarmepumpar.n.nu/bergvarmepum [Accessed: 22-Apr-2012].
[11] J. Stromback, C. Dromacque, M. H. Yassin, G. Ene The potential of smart meter enabled programs to in systems efficiency: a mass pilot comparison Short n Demand, 2011.
[12] F. Wallin, C. Bartusch, E. Thorin, T. Bdckstrom, an use of automatic meter readings for a demand-base Transmission and Distribution Conference and Exh Pacific, 2005 IEEE/PES, 2005, pp. 1–6.
X. BIOGRAPHIES Javier Campillo is an Electronic received his M. Sc. In Energ Mälardalen University in Västerås is currently a doctoral candi University working on developing for forecasting electricity dem demand-response scenarios for Nor Fredrik Wallin received his Ph.D Mälardalen University. He has been with energy information, metering response issues. Other research int electricity production, renewable and improved integration of energ energy markets.
Iana Vassileva received her Environmental Science from M Västerås, Sweden in 2007. She doctoral studies at Mälardalen U consumption patterns and behaviou savings feedback improvement. Erik Dahlquist received the Ph.D. now a professor in Energy Techn University. He has earlier worked manager and in different managin research and business in the fields o power technology and energy syste a member of the Royal Sw Engineering, IVA. Eskilstuna, Sweden, ump Systems in 2003. ompetition, pp. 1–12, utlook 2009: , 2009. ound‐Source Heat
option, and Options ture Nordic Electricity h, EGL Research, he Nordic wholesale överföring av el hart____85467.aspx. ning av aring. [Online]. mpar-besparing.
ergy, and T. Tank, ncrease energy and name: Empower nd E. Dahlquist, The ed tariff, in hibition: Asia and
Engineer (2003) and gy Engineering from
, Sweden in 2007. He idate at Mälardalen mathematical models and and simulating rdic countries. D. degree in 2010 at n working for 10 years systems and demand-terests are small-scale
energy technologies gy consumers into the
M. Sc. Degree in Mälardalen University, is now finishing her University on energy ur analysis and energy
degree in 1991. He is nology at Mälardalen d at ABB as project ng positions, in both of process automation, ems. Dahlquist also is wedish Academy of