http://www.diva-portal.org
This is the published version of a paper presented at TMS 2014.
Citation for the original published paper: Dini, H. (2014)
EFFECTS OF MICROSTRUCTURE ON DEFORMATION BEHAVIOUR OF AZ91D CAST ALLOY.
In:
N.B. When citing this work, cite the original published paper.
Permanent link to this version:
EFFECTS OF MICROSTRUCTURE ON DEFORMATION BEHAVIOUR
OF AZ91D CAST ALLOY
H. Dini, N.-E. Andersson and A. E. W. Jarfors
Jönköping University; School of Engineering, Department of Mechanical Engineering, Materials and Manufacturing – Casting,
P.O. Box 1026, SE-551 11, Jönköping, Sweden
Keywords: AZ91D, Microstructure, Mechanical properties, Temperature, Strain rate, Phase fraction
Abstract
The deformation behavior of AZ91D cast magnesium alloy was investigated using uniaxial tensile tests from room temperature up to 190°C and strain rates from 0.0001 up to 0.1 1/s. In present work gradient solidification in a Bridgeman furnace was employed to study the effect of initial microstructure on the tensile mechanical response of the AZ91D alloy. The furnace drawing rate was varied from minimum 0.3 to maximum 6 mm/s, which yielded a variation of SDAS from 4.2 up to 25 as well as a variation of the fraction of the γ -phase (Mg17Al12),. The effects of
microstructural parameters such as SDAS and γ -phase morphology on the yield strength (YS), ultimate tensile strength (UTS) and hardening were investigated.
Introduction
The deformation behavior of die-cast AZ91D alloy has been extensively discussed. [1-3] It is accepted that AZ91D cannot be used in an environment where the operating temperature could approach or exceed 200℃ with the presence of cyclic thermal and mechanical loadings. It has been reported that the same AZ91D alloy shows quite different mechanical behavior due to different microstructural features such as volume fraction and distribution of γ -phase (Mg17Al12), α-grain
size and Al content in solid solution [2-9]. The existing data concerning mechanical properties and microstructural factors show large scatter and is even contradictory. Therefore it is of significant interest to investigate the effect of different microstructural features at different temperatures on the mechanical and deformation properties.
The current paper deals with the influence of the microstructure on the deformation properties of the AZ91D alloy. The work is part of the broader investigation of the characterization and physical modeling of the deformation process of AZ91D cast alloy under thermal cycling conditions.
Experimental procedure
In this work the design of experiments (DesignExpert™) software was used for planning the test
schedule. The parameters investigated were, temperature, strain rate and microstructure with the target to analyzing their influence on mechanical properties and deformation behavior of AZ91D. The experimental conditions are collated in Table 2.
Preparation of cast specimens
The material used for this study was prepared from casting of commercial ingots of AZ91D. The alloy composition is shown in Table 1. AZ91D was melted in mild steel crucibles under protective atmosphere (0.5%SF6 in dry air) and sucked up into 1000 mm long and 10mm in diameter mild steel tubes that were preheated to 250°C. The cast AZ91D alloy rods were cut into a length of 170 mm and rinsed with water. The rods were cleaned with ethanol placed in a mild steel tube prior to re-melting in a Bridgman furnace under protective atmosphere (0.5%SF6 in dry air). As a temperature of 650°C was reached the furnace was moved upwards at a controlled rate to generate the desired microstructures, see Table 2. The selection of microstructures was chosen to cover a range simulating high-pressure die casting to sand casting.
Table 1-The chemical composition of the AZ91D alloy (wt.%)
Mg Al Zn Mn Fe Ni Cu Si
Bulk 8.5 0.67 0.25 0.0023 0.0017 0.021 0.017 Tensile test specimens
Tensile-testing bars were prepared according to ASTM B577 [10]. A ZWICK-ROLL™ Z100 Laser
extensometer was used to measure strain. The test schedule is shown in Table 2 together with the results.
Metallographic evaluation
The tensile specimens were cut, and prepared for metallographic investigation following standard procedures developed for magnesium alloys [11, 12]. Specimens were etched at room temperature using 10ml HF(48%) for 1-2s to etch the γ -phase dark [12]. The secondary dendrite arm spacing (SDAS) was determined using light-optical microscope with measuring more than 40 dendrites for each specimen for sufficient accuracy. The area fraction of γ -phase was measured by using Olympus stream motion 1.8 image analysis software.
Accurate determination of dendrite arm spacing (DAS) was made together with EBSD analysis to ensure that there were no texture effects from the sample manufacturing technique as the strength is strongly depending on crystallographic directions and in gradient solidification there is a risk of textured solidification.
Results and discussion Microstructure
The primary dendrite stem growth direction is <11 2 0> with dendrites arms in the (1 1 01) planes in the <11 2 0> direction resulting in a risk of texture as mechanical properties varies along the a- and c-axis of the unit cell [13-17]. Equiaxed structures were found in all microstructures which shows that the grains have no preferred directionality. Figure 1(a and c) shows microstructures for the fine and coarse microstructure. The EBSD analysis (Figure 1 b and d) shows a random orientation of the grains suggesting that the sample manufacturing did not result in any texture and that the material should be regarded as isotopic. Similarly the DAS value is small compared to
specimen dimensions limiting grain size scale effects to a minimum. It is clearly understood that increasing in drawing rate assisted the formation of divorced eutectic (Figure 2) which is in good agreements with similar studies [12, 13].
γ -phase precipitates of different shapes, were found located at grain boundaries and interdendritic regions. The sizes of the γ -phase grains are measured to be mostly about several micrometers. It can also be seen that there is a correlation between the area fraction of γ -phase and the SDAS. Higher area fraction of γ -phase (around 11%) was obtained at slower solidification rate. This value was decreased to almost 7.1% at a higher solidification rate. It should also be noted that the scatter of the shape factor of the γ -phase precipitates is fairly large suggesting the possibility of a more or less continuous network at the interdentritic regions. However, it seems that solidification rate has no effect on shape factors of this intermetallic compounds (Figure 2).
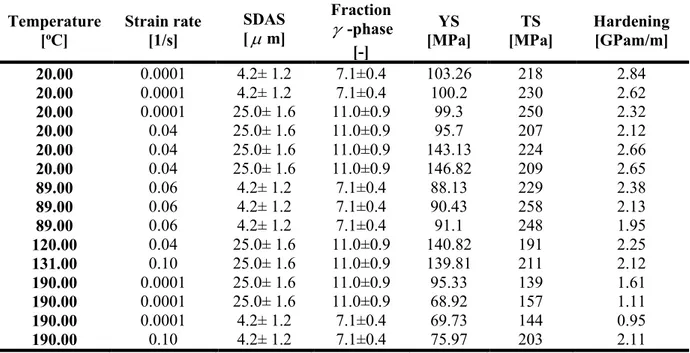
Table 2- Experimental conditions and results where the fine and coarse secondary dendrite arm-spacing (SDAS) was made using 6 and 0.3 mm/s drawing speed respectively.
Temperature
[oC] Strain rate [1/s] SDAS [µm]
Fraction γ -phase
[-]
YS
[MPa] [MPa] TS Hardening [GPam/m]
20.00 0.0001 4.2± 1.2 7.1±0.4 103.26 218 2.84 20.00 0.0001 4.2± 1.2 7.1±0.4 100.2 230 2.62 20.00 0.0001 25.0± 1.6 11.0±0.9 99.3 250 2.32 20.00 0.04 25.0± 1.6 11.0±0.9 95.7 207 2.12 20.00 0.04 25.0± 1.6 11.0±0.9 143.13 224 2.66 20.00 0.04 25.0± 1.6 11.0±0.9 146.82 209 2.65 89.00 0.06 4.2± 1.2 7.1±0.4 88.13 229 2.38 89.00 0.06 4.2± 1.2 7.1±0.4 90.43 258 2.13 89.00 0.06 4.2± 1.2 7.1±0.4 91.1 248 1.95 120.00 0.04 25.0± 1.6 11.0±0.9 140.82 191 2.25 131.00 0.10 25.0± 1.6 11.0±0.9 139.81 211 2.12 190.00 0.0001 25.0± 1.6 11.0±0.9 95.33 139 1.61 190.00 0.0001 25.0± 1.6 11.0±0.9 68.92 157 1.11 190.00 0.0001 4.2± 1.2 7.1±0.4 69.73 144 0.95 190.00 0.10 4.2± 1.2 7.1±0.4 75.97 203 2.11 Mechanical properties
Examples of typical stress-strain curves are shown in
Figure 3 In general there was as previous indicated differences and difficult to interpret variations in the results as previously suggested [2-9]. In figure 3 it is suggested that the finer microstructure has lower yield strength than the coarser structure suggesting that there are other factors determining the yields strength than SDAS at room temperature. On the other hand the strain rate dependence at 190oC is as expected where a lower strain rate is showing less hardening than at a
higher strain rate. To resolve this and to understand the significance of the experimental parameters an Analysis of Variance (ANOVA) was made using the DesignExpert™ software.
(a) (b)
Figure 2- Illustration of the divorced eutectic and the γ -phase fraction and morphology. (a) γ -phase fraction of 7.1% ±0.4% with a shape factor of 0.60 ± 0.2 for samples drawn at 6mm/s, (b) γ -phase fraction of 11% ±0.9% with a shape factor of 0.60 ± 0.2 for samples drawn at 0.3mm/s.
Table 3 shows analysis of variance of the yield strength for different factors and their interactions. The model in annotated view is labeled as ‘’significant’’. ‘’F-value’’ column and associated probability (‘’Prob>F’’) shows that there is a very small probability, near 0.81% chance (P=0.0081), that the differences model terms (A, B, D and BD) could occur due to noise. Lack of fit is not significant which is relative to ‘’Pure Error’’. In other words, it appears at this stage the difference between terms of models is significant suggesting that the model is fit. Interesting to note is that temperature (A) and γ -phase fraction (D) are significant. Strain rate (B) is marginally significant but very close to significance. The interaction between the strain rate and γ -phase fraction (BD) is also marginally significant. Any suitable fit with SDAS (or C) in the analysis could not be obtained. It should here be noted that there is still a fairly large scatter in data and the results should be seen as qualitative.
(a) (b)
(c) (d)
Figure 1- Illustration of SDAS and DAS in the gradient solidified samples. (a) Optical micrograph illustrating SDAS (4.2 µm ± 1.2 µm) for samples drawn at 6mm/s, (b) EBSD orientation map also illustrating DAS (100 µm ± 2.4 µm) for samples drawn at 6mm/s, (c) Optical micrograph illustrating SDAS (25.0 µm ± 1.6 µm) for samples drawn at 0.3mm/s pictures, (d) EBSD orientation map also illustrating DAS (300 µm ± 3.7 µm) for samples drawn at 0.6mm/s.
300 µm
Figure 3-Typical tensile Stress-Strain flow curves of AZ91D. Curves were obtained at room temperature and 190°C for different SDAS value and under different strain rates.
Table 3- Analysis of variance of the yield strength for different factors and their interactions
Source Sum of
Squares df Mean Square F-value P-value Prob> F Significance
Model 7162.69 4 1790.67 6.38 0.0081 Significant
A-Temp 1412.76 1 1412.76 5.04 0.0487 Significant
B-Strain rate 1382.93 1 1382.93 4.93 0.0507 Marginally significant
D-γ -phase
fraction
4122.91 1 4122.91 14.69 0.0033 Significant
BD 1190.40 1 1190.40 4.24 0.0664 Marginally significant
Residual 2805.77 10 280.58
Lack of Fit 822.00 4 205.50 0.62 0.6641 Not significant
Pure Error 1983.77 6 330.63
Cor Total 9968.46 14
The analysis confirmed that temperature reduce yield strength as expected. The result of yield strength model is shown in Figure 4 It reveals an interaction between two factors of γ-phase and strain rate which effect on yield strength of specimens. It is conceived that at high strain rate the effect of γ-phase fraction on yield strength is more dominant. While, no significant effect was observed at lower γ-phase fraction. Higher strain rates leads to increased yield strength. It means that higher fraction of γ -phase results in increased initial strength of the alloy. As the γ -phase is stiffer than the α-phase (71.9 GPa compared to 45GPa at room temperature) [18].
By increasing the fraction of γ -phase, γ -phase particles start to impinge each other, forming a network (refer also to Figure 2) and the network starts to be continuous especially between dendrites. During tensile testing, the rigid and hard network must be broken before any macroscopic plastic deformation can take place. It seems reasonable to assume that this network should be able to withstand higher loads before it starts to break, because it is difficult for the continuation of slip and dislocations to move across the γ -phase network during deformation. Also, during plastic deformation, strong internal stresses will be built up as a result of the difference in yield strength between the ductile α-phase and the brittle γ -phase [19].The internal stress represents a backstress opposing the applied load which would raise the strain hardening during deformation. Consequently, the yield strength of AZ91D alloy is mainly determined by the continuous network of γ -phase.
Figure 4- Interaction of strain rate and γ -phase fraction on yield strength. Center line is the actual trend. Dash lines are confidence intervals.
Once the material starts to yield, it is important that what parameters actually affect the stress-strain behavior. Large scatter in ultimate tensile strength (UTS) was observed. The evaluation procedure for the hardening was such that the hardening was defined as
YS F y F
ε
ε
σ
σ
ε
σ
−
−
=
∆
∆
(1) The evaluated hardening is shown in Table 2.Table 4 shows the ANOVA results for hardening. The model is significant and there is only a 0.02% chance that a "Model F-Value" this large could occur due to noise. Lack of fit is not significant again suggesting that the model is fit. Interesting to note is that only temperature (A) is significant. Surprisingly strain rate is not significant nor is SDAS (C) and γ -phase fraction (D). What stands out is that the interaction between temperature and strain rate (AB) is marginally significant. In the evaluation Strain rate (B) is kept to keep model hierarchy intact. This suggests, not unexpectedly, that temperature dependent dislocation mobility has a dominant role in the deformation behavior of AZ91D. It should here, again, be noted that there is a fairly large scatter in data and the results should be seen as qualitative.
Figure 5 illustrates the interaction between temperature and strain rate on hardening. It is shown that temperature primarily contributes to softening at low strain rate and at 0.1 1/s the hardening effect is rendered temperature independent. The fact that there was no influence from the γ- phase fraction on the hardening suggests that there is none or little hardening effect from the γ- phase particles and that there is only effects from glide and climbing as more glide systems are engaged in the α-phase.
Table 4- Analysis of variance of the hardening for different factors and their interactions
Source Sum of
Squares df Mean Square F value P-value Prob> F
Model 3.39 3 1.13 16.59 0.0002 Significant
A-Temp 0.66 1 0.66 9.65 0.0100 Significant
B-Strain rate 0.11 1 0.11 1.55 0.2393 Hierarchy
AB 0.28 1 0.28 4.12 0.0673 Marginally significant
Residual 0.75 11 0.068
Lack of Fit 0.32 5 0.063 0.88 0.5478 Not significant
Pure Error 0.43 6 0.072
Cor Total 4.14 14
Figure 5- Interaction of temperature and strain rate on hardening. Center line is the actual trend. Dash lines are confidence intervals.
Conclusion
Based on the findings in the current investigation it is concluded that
• The gradient solidification technique is suitable to prepare samples with controlled microstructures that will show isotropic properties as the crystallographic orientation is macroscopically independent on growth direction
• Temperature softens AZ91
• The γ -phase fraction was strongly contributing to the yield strength of AZ 91
• Increasing the strain rate will increase the yield strength suggesting also that there is an initial dynamic interaction between the gamma phase network and the deforming α-phase. This needs further investigation.
• Material hardening is entirely depending on dislocation dynamics and scape effects both from SDAS and γ -phase particles have little influence.
References
1. Blum, W., Y. Li, X. Zeng, P.Z.D.-. Ing, B. Von Grossmann, and C.H.D.-. Ing, Creep deformation mechanisms in high-pressure die-cast magnesium-aluminum-base alloys. Metallurgical and Materials Transactions A, 2005. 36(7): p. 1721-1728.
2. Blum, W., B. Watzinger, and P. Weidinger, Creep resistance of Mg-base alloys. Mordike, BL and Kainer, KU (eds.), Magnesium Alloys and their Applications, MATINFO Werkstoff-Informationgeselschaft, 1998: p. 49-60.
3. Finkel, A., M. Regev, E. Aghion, M. Bamberger, A. Rosen, and D. Eliezer, First Israeli Conference on Mganesium Science and Technology. Magnesium Research Institute, Beer-Sheva, Israel, 1997: p. 121-126.
4. Blum, W., F. Breutinger, B. Watzinger, J. Kroc, P. Weidinger, and R. Rösch. Deformation of the die cast magnesium-alloys AZ91 and AS21 at intermediate temperatures: experiments and simulations. in Proceedings of the First Israeli International Conference on Magnesium Science & Technology, Dead Sea, Israel. 1997.
5. Regev, M., E. Aghion, A. Rosen, and M. Bamberger, Creep studies of coarse-grained AZ91D magnesium castings. Materials Science and Engineering: A, 1998. 252(1): p. 6-16.
6. Finkel, A., M. Regev, E. Aghion, M. Bamberger, and A. Rosen. Aging Study of AZ91D Casts. in Magnesium 1997. Proceedings of the Dead Sea Magnesium Conference. 1997.
7. Regev, M., E. Aghion, S. Berger, M. Bamberger, and A. Rosen, Dislocation analysis of crept AZ 91 D ingot castings. Materials Science and Engineering A(Switzerland), 1998. 257(2): p. 349-352. 8. Spigarelli, S., M. Cabibbo, E. Evangelista, M. Talianker, and V. Ezersky, Analysis of the creep behaviour of a thixoformed AZ91 magnesium alloy. Materials Science and Engineering: A, 2000.
289(1): p. 172-181.
9. Caceres, C. and D. Rovera, Solid solution strengthening in concentrated Mg–Al alloys. Journal of Light Metals, 2001. 1(3): p. 151-156.
10. Standard Methods of Tension Testing Wrought and Cast Aluminum and Magnesium Alloy Products. ASTM B557M-10. Annual Book of ASTM Standards. American Society for testing and Materials 2010.
11. Maltais, A., D. Dubé, M. Fiset, G. Laroche, and S. Turgeon, Improvements in the metallography of as-cast AZ91 alloy. Materials Characterization, 2004. 52(2): p. 103-119.
12. Vander Voort, G.F., S.R. Lampman, B.R. Sanders, G.J. Anton, C. Polakowski, J. Kinson, K. Muldoon, S.D. Henry, and W.W. Scott Jr, ASM handbook. Metallography and Microstructures, 2004. 9: p. 44073-0002.
13. Pettersen, K. and N. Ryum, Crystallography of directionally solidified magnesium alloy AZ91. Metallurgical Transactions A, 1989. 20(5): p. 847-852.
14. Celotto, S., TEM study of continuous precipitation in Mg–9 wt% Al–1 wt% Zn alloy. Acta materialia, 2000. 48(8): p. 1775-1787.
15. Crawley, A. and B. Lagowski, Effect of two-step aging on the precipitate structure in magnesium alloy AZ91. Metallurgical and Materials Transactions B, 1974. 5(4): p. 949-951.
16. Crawley, A. and K. Milliken, Precipitate morphology and orientation relationships in an aged Mg-9% Al-1% Zn-0.3% Mn alloy. Acta Metallurgica, 1974. 22(5): p. 557-562.
17. Zhang, M.-X. and P. Kelly, Crystallography of Mg< sub> 17</sub> Al< sub> 12</sub> precipitates in AZ91D alloy. Scripta Materialia, 2003. 48(5): p. 647-652.
18. Huang, Z.-w., Y.-h. Zhao, H. Hou, Y.-h. Zhao, X.-f. Niu, and P.-d. Han, Structural, thermodynamics and elastic properties of Mg 17 Al 12, Al 2 Y and Al 4 Ba phases by first-principles calculations. Journal of Central South University, 2012. 19: p. 1475-1481.
19. Blank, E., M. Kaspar, and M. Rappaz, Work Hardening Due to Internal Stresses in Dendritic Microstructures. Strength of Metals and Alloys., 1985. 1: p. 87-92.