INCREASING THE EFFICIENCY OF MARKETING E-MAIL IN
CUSTOMER RETENTION
MASTER THESIS
THESIS WITHIN: General Management
NUMBER OF CREDITS: 15
PROGRAMME OF STUDY: Engineering Management
AUTHOR: Ali Gürbag & Guadalupe Katherine Morales Valuis
TUTOR:Darko Pantelic JÖNKÖPING May 2016
Abstract
Technology development has changes many things in the way businesses are done nowadays. Compa-nies needed to readapt their processes to the new demands of the markets in order to be competitive in online platforms. To achieve this, companies need to focus on retaining customers. E-marketing has developed many tools for this purpose, e-mail marketing has proven to have advantages in this task; however, sometimes the outcome is not as good as expected, mainly because the content and struc-ture isn’t what customers want to see or don’t fulfill their expectations.
The purpose of this study is understand which are the factors that make customers avoid marketing e-mails and how they can be restructured to increase the probabilities to encourage customers to revisit again the same brand.
Regarding the method, quantitative approach was used and the statistical data was collected with online survey. Survey questions are prepared based on previous literature and factors mentioned in literature. Results are collected from a sample which contains 120 people. In order to analyze the col-lected data, descriptive analysis and principal component analysis techniques are used.
After analysis, researchers concluded that not all factors which influence ignoring decision have same effect. On the other hand, during decision of revisit the brand because of the marketing e-mails, each segments in the sample have different preference and companies which use marketing e-mail should structure their e-mails regarding to that data.
Table of Contents
List of Figures ... 1
List of Tables ... 2
1
Introduction ... 3
1.1
Internet and Business ... 3
1.2
E-marketing and E-marketing Tools ... 3
1.3
Research Problem / Questions ... 4
1.4
Perspective ... 5
1.5
Key Definitions ... 5
2
Literature Review ... 6
2.1
E-marketing... 6
2.2
B2C / Customer Orientation ... 8
2.3
E-mail marketing ... 9
2.4
Online Customer Behavior to Marketing E-mails ... 12
3
Methodology ... 13
3.1
Research Method ... 13
3.2
Sampling Method ... 14
3.3
Data Collection ... 14
3.4
Data Analysis ... 15
3.5
Ethical implications ... 15
4
Survey Results ... 16
4.1
Sample information ... 16
4.2
Ignoring Marketing E-mails ... 19
4.3
Desired Marketing E-mail Structure ... 23
5
Analysis ... 26
5.1
Descriptive Analysis for Ignoring Factors ... 26
5.2
Principal Component Analysis for Desired E-mail ... 31
5.3
Component Score Analysis ... 34
6
Conclusion ... 40
6.1
First Research Question ... 40
6.2
Second Research Question ... 41
6.3
Limitations ... 43
6.4
Contribution... 44
6.5
Further Research ... 44
Reference ... 46
Appendix A: Survey Questions ... 49
List of Figures
Figure 2-1: Development Stages of Digital Marketing ... 7
Figure 2-2: E-marketing Framework and Steps ... 7
Figure 4-1: Sample gender distribution ... 16
Figure 4-2: Employment status distribution ... 17
Figure 4-3: Education level distribution ... 17
Figure 4-4: Distribution of age ranges ... 18
Figure 4-5: Distribution of personal financial perception ... 18
Figure 4-6: Distribution of online purchasing for last six months ... 19
Figure 4-7: Distribution of received marketing e-mails from a single company ... 20
Figure 4-8: Frequency distribution of ignored marketing e-mails ... 20
Figure 4-9: Mean values of different factors ... 21
Figure 4-10: Distribution of marketing e-mail frequency preference ... 22
Figure 4-11: Distribution of receiving time preference (a-time of the day, b-day of the
week) ... 22
Figure 4-12: Frequency distribution of marketing e-mails which cause revisit and/or
repurchase ... 23
Figure 4-13: Distribution of mean values for structural variables ... 24
Figure 4-14: Distribution of mean values for contextual variables ... 24
List of Tables
Table 2-1 Key Factors Related to Usage ... 11
Table 2-2 Key Factors Related to Structure ... 11
Table 5-1: Frequency distribution for each variable ... 27
Table 5-2: Purchase history * frequency preference cross tabulation ... 28
Table 5-3: Employment * time preference cross tabulation ... 29
Table 5-4: Purchase history * frequency preference cross tabulation ... 30
Table 5-5: Variable table... 31
Table 5-6: KMO and Barlett's test ... 32
Table 5-7: Variance of components after extraction ... 33
Table 5-8: Rotated component matrix ... 33
Table 5-9: Factor scores for 10 respondents ... 34
Table 5-10: Component scores comparison regarding to gender ... 35
Table 5-11: Component scores comparison regarding to employment ... 35
Table 5-12: Component scores comparison regarding to education ... 36
Table 5-13: Component scores comparison regarding to age range ... 37
Table 5-14: Component scores comparison regarding to financial situation ... 38
1
Introduction
In this chapter, the purpose of the study is explained with a background information and It is followed by research questions, perspective of the study and keyword definitions which are related to topic.
1.1
Internet and Business
We are living in an era of technological modernization, and among all these changes, there is one that has revolutionized the way we used to do everything; the internet.
Dholakia (2005) argues that, for more than ten years already, markets have been use internet for trade purposes with customers. This phenomenon has opened a new way of interaction between customers and businesses in the Swedish market (Alström, Gander, Haraldsson, & Lind, 2013). Internet has not only changed the traditional way of businesses, but also customer’s needs are satisfied. Companies have been forced to reinvent theirselfs to fulfill those needs. Marketers are developing new customer related tools. More than 70% of Swedes are online users and feel comfortable with the new purchasing models (Findahl & Davidsson, 2015). They are becoming e-customers.
Companies now use information generated in internet to get revenues and a significant advantage. It is a necessity to adapt common businesses to online platform not only to get a differentiation over competitors but to have a chance to go into the market. And although businesses are adapting to the digitalization era pretty easily, there are still many Swedish companies struggling to identify which is the best way to use the digital toolkit and unlock this potential (Alström et al., 2013).
1.2
E-marketing and E-marketing Tools
Technologies such as internet has hit all departments in the organization, and marketing department has experience probably the most changes (Dholakia, 2005).
Markets have become customer oriented. This term refers to, according to Slater and Narver (1998), businesses which focus on what customers expect from the market, products and services which fulfil their expectations. Because of this, now we can talk about e-marketing which is now a significant part of every global corporation’s marketing power (Krishnamurthy & Singh, 2005). Hooda and Aggarwal (2012) express that the use of e-marketing methods has been increasing in the last 15 years.
Companies are using Internet, which turned out to be a very useful platform for marketing purposes, to share information, catch and retain customers, and of course create a relationship with them (Hamid, 2008). Businesses understood the importance of having an online platform, now they are working on a correct marketing strategy to increase their effectiveness. E-marketing intent to create revenues by starting to understand the customers’ new needs. To reach this goal, it is important to start by understanding online customers’ behavior, which range from forecasting future product needs to discover other purchasing alternatives (Kwan, Fong, & Wong, 2005). This is the current challenge for companies. The same authors argue that e-customers learn quickly and they look for websites that understand better their necessities. Online customers have new needs and desires, and the challenge for the companies; as mentioned before, is to predict and fulfill those expectations before they actual happened. Through e-marketing, companies can launch different strategies to collect the main traits
of customers and track their performance online, and with this information predict not only the next purchase but what they might need in the future.
Companies uses many tools for e-marketing, like mobile ads, search engine marketing and e-mail mar-keting. According to Chou and Dou (2002), even though e-marketing tools are used for different trans-actions like B2B (business to business), B2C (business to customer), C2B (customer to business), C2C (customer to customer); B2C transactions have the second highest usage of these tools after B2B. Among these tools, e-mail marketing tool is the one which yield twice the return on investment re-garding to others (Pavlov, Melville, & Plice, 2008). In the communication sector, e-mail is one of the fastest growing technology and it became marketers’ tool because it is easy, cheap and provide direct communication with customers (Fariborzi & Zahedifard, 2012). Direct and quick connection with cus-tomers creates closer and better relationship between companies and cuscus-tomers. Nowadays, it´s very common to find lot of Marketing e-mails in our inbox, due to more and more companies are betting for the use of this marketing tool. In most of the cases, the outcomes are as good as expected for companies; however, in some other cases, they are not.
1.3
Research Problem / Questions
Like every other e-marketing tool, e-mail marketing is built around the five step of digital marketing framework model; attracting, engaging, retaining, learning and relating (Kierzkowski, McQuade, Waitman, & Zeisser, 1996). Previous studies mostly focused in other marketing tools than e-mail mar-keting (Ellis-Chadwick & Doherty, 2012); also a number of studies about customer attraction can be found (Bahaddad, Houghton , & Drew, 2013; Otero , Gallego, & Pratt, 2014; Wyner, 2002), but only few of them study about how to retain them. Because of the lack of studies regarding the topic, this study will focus in e-mail marketing as a tool for retaining customers.
Retention customers is as important as attracting them; yearly, firms spend millions in e-mail market-ing tactics but sometimes the outcomes are not as good as expected. In order to make the customer purchase again in the same brand, marketers should know how to retain their customers and e-mail marketing tools might achieve this goal successfully.
E-mail marketing is not new in the task of retaining customers, it has been used in the past extensively, because of its advantages such as being cheaper, easier and quicker. However, these advantages also cause important disadvantages. The speed and cost benefits increases the number of e-mails which are sent for marketing purposes. It causes mailboxes full of unwanted or unnecessary e-mails which leads to decrease on the efficiency, because people start avoiding them (Pavlov et al., 2008). There are also structural and contextual factor which make customers avoid marketing e-mails (Chittenden & Rettie, 2003). Purpose of the study is to statistically analyze the factors which cause avoiding e-mails and customers’ expectations from marketing e-mails.
To solve the problem, companies should be able to set their marketing e-mails according to their cus-tomers’ desires. To address what they expect from marketing e-mails and what would make e-mails more effective, these research questions will be examined;
1. What makes people avoid marketing e-mails?
2. How should marketing e-mail be structured to persuade customer to revisit?
As seen in the research questions, the problem is investigated from two different sides; the first ques-tion will evaluate what are the main reasons to ignore the marketing e-mail by customer. With the
second question, researchers will examine some improvements that can be done in the marketing e-mail in order to make customer revisit the brand.
1.4
Perspective
Modern markets are customer oriented, it is the customer who decide what they want and how they want it. Because of this, marketing strategies are striving to predict and understand in the best way possible what the customer will want before s/he actually does. For e-mail marketing, the challenge is to forecast what makes customer read the marketing e-mails and become interested in buying again from the same brand. Which is why, this study is planned according to customers’ perspective. The authors will analyze customers’ thought about marketing e-mails and predict what would increase the efficiency of this tool.
1.5
Key Definitions
In this section, some important key definitions will be presented in order to understand better what are the main focus of this study.
E-Marketing: “E-marketing can be defined as marketing of products and services on electronic media.
E-marketing is one of the latest and emerging tools in the marketing world.” (Hooda & Aggarwal, 2012). E-marketing is an internet-based technology used for advertising and communication between cus-tomers and companies, also E-marketing supports many marketing functions such as customer rela-tionship management, sales activity, customer support, marketing research and planning.
E-mail Marketing:” E-mail marketing is a form of direct marketing which uses electronic mail as a
means of communicating commercial or fundraising messages to an audience” (Vasudevan, 2013). E-mails can be sent to existing or new possible customer, both of them are considered as e-mail market-ing.
2
Literature Review
Literature review of this research begins with marketing and customer retention, then followed by mail marketing and its structural and contextual elements. Lastly, customer’s reaction to marketing e-mails is described. This information will be used for the analysis design and interpretation of the re-search.
Marketing has been, since the beginning, a very important tool for companies; it has always been the way to approach costumers and public in general. Its methods and tools have evolved throughout time and always have been supported by technology. Since technology started changing, marketing did as well, and in order to be more efficient a new method appeared: E-marketing.
This is maybe the best match between marketing and internet, this combination is nowadays the best tool that companies can use to not only compete in markets but also to connect with customers, in the high technological world we live in. On following, some important definition for this study will be pre-sented and explained.
2.1
E-marketing
Marketing professional have realized that information technology (IT) is the best technology to bring off all the ongoing challenges, like to gain more from current marketing resources and created stable relationships with customers. e-marketing is combination of marketing and IT technologies (Trainor, Rapp, Beitelspacher, & Schillewaert, 2011). This technology is significant for every international com-pany marketing strategy (Krishnamurthy & Singh, 2005).
This online interaction benefits both the company and the customers; on one hand, customers get access to company resources; and on the other hand, the company collects information about its cus-tomers. Shih and Hu (2008) states that e-marketing is key for those online companies who want to reach new customers and to be able to keep current ones by providing good online customer service. Trainor et al. (2011) also argues that e-marketing can help to improve the customer focus. External information can be combined with previous records of the customers to forecast the sales and improve the organizational efficiency. Thus, this information is crucial for marketers looking to understand bet-ter the customers’ needs.
E-marketing has brought many advantages but also challenges for companies. The costs of e-marketing per potential customer is very low in comparison to others physical medias, also e-marketing can reach global markets in a shorter time; internet is an effective platform for promoting products and services, and can collect very accurate information (Doolin, Burgess, & Cooper, 2002). However, internet changes very fast and e-marketing has to change as fast as possible to keep targeting the market. Kierzkowski et al. (1996) state that, the implementation of digital marketing requires important changes in the marketing department. There are four phases for the development of digital marketing (See Figure 2-1).
Figure 2-1: Development Stages of Digital Marketing
Source:(Kierzkowski et al., 1996)
The same authors argue that, in order to succeed in e-marketing it is necessary to build a new customer model. There are different success steps for e-marketing for online market companies, these steps are: attract, engage and retain users, learn about their preferences, and, relate back to them to provide a sort of customized interactions (Kierzkowski et al., 1996). These five steps are considered key to suc-ceed in e-marketing (See Figure 2-2).
Figure 2-2: E-marketing Framework and Steps
1. ATTRACT: E-marketing needs customers’ access to an interactive application, like a web-site. It is important to develop an effective hook to catch the customer attention and have a suc-cessful first contact.
2. ENGAGE: After attracting, is mandatory that marketers encourage customers’ participation to stablish an interactive customer relationship. Key here is to keep attracting customer interest in the company in an interactive way.
3. RETAIN: It is important to assure that customers will come back to the site. For this, company needs constantly reinvent itself and make the customer part of this.
4. LEARN: Digital Marketing offers marketers the opportunity to collect data of the customers. This information is a valuable resource to learn about the customers, markets, tendencies and competitors, thus constantly improve.
5. RELATE: Marketers can personalize the interaction and suit the product or the marketing strat-egy to the customers in order to improve the relationship. It is always important to put the customer in first place and aim to keep them happy.
According to Halimi, Chavosh and Choshalyc (2011), customer relationship involves two main concepts: Attracting and retaining customers. For purposes of this study, only retaining customer is focused. It is important that companies develop a one-to-one relationship with customers. To success in this, it is mandatory to collect relevant customers’ information and use it conveniently, this can assure a long-term relationship, make customer be loyal to the brand (Halimi et al., 2011).
The most decisive part when purchasing online is the end of the buying process. Because here is when the customer decides to come back or not to the site. The fulfillment conditions of the purchase pro-cedure might be more important than the information provided to customers or the choice itself that s/he made. In most of the cases, online consuming becomes a routine for a period of time. When they are used to it, this action becomes “habitual” (Reibstein, 2002).
2.2
B2C / Customer Orientation
Currently, customers have been involved in the marketing strategies of firms, this is due they are more organized, well-informed and more demanding about products (Appiah-Adu & Singh, 1998). Market orientation has become very important nowadays for companies; however, the adaptation process requires a lot of internal work. A good starting point for this is to fully understand the market target need (Han, Kim, & Srivastava, 1998).
As mentioned previously, a good relationship with customer rest on retain customers, to do so it is important to fulfill their desires as best as possible and keep them interested in the brand. By doing this, companies generated “Customer value” which according to Woodruff (1997) is the customer per-ception to product attributes, performances, and convenience. Customer value can be generated by organizing activities according customers’ information collected and disseminated by the organization. (Jones, Busch, & Dacin, 2003).
This new perspective of marketing was driven by a constantly increasingly competition and technolog-ical changes and developments (Appiah-Adu & Singh, 1998). Internet was key here to develop tools to help marketers when reaching a specific market target, not only by collecting but also by processing customers’ information.
2.3
E-mail marketing
E-mail marketing can be defined as the tool of promoting products or services by e-mail, and so get customers’ attention. The most important advantage is its low-cost effectiveness and easy to person-alize and target. Larger number of customers can be reached by this method. E-mail marketing can be also used for sharing information, branding and catching potential customers (Merisavo & Raulas , 2004). This is a very important tool for companies that are looking to get a better relationship with customers (Ellis-Chadwick & Doherty, 2012).
E-mail marketing is interactive and it can combine both advertising and customer service. This tool is low-cost effective and can reach a large and wide variety of potential customers (Krishnamurthy S. , 2001). It is very important that e-mail structure meets the customers’ needs, which is why messages should be build according to online users’ patterns.
Ellis-Chadwick and Doherty (2012) argue that in some cases, e-mail marketing can be annoying, be-cause some companies send a bunch of “unsolicited” e-mails to customer. In the majority of cases, the receiver approves voluntarily these e-mails. The best way to get the customer consent is getting a perfect match between customers’ interest and the e-mail structure.
The same authors express that it is important to follow certain steps to get better results from e-mail marketing
1. It is important to define what is going to be role of e-mail marketing in the organization. 2. Define why the company is using e-mail marketing: "What is the purpose of marketing via
E-mail for your company?" Why e-E-mail marketing? 3. Build a customer database.
4. Implement a privacy policy. Link it to customers
5. Work on a marketing strategy with information of the organization, like what is goal and how to achieve that goal.
6. Plan the content of the e-mail for each product or service. 7. Define the subject and the header of the mail.
8. Test the content of the message, before it is launch 9. Track the competition’s outcomes
E-mail marketing can also be used as a market research tool, by choosing a potential market target and customizing the products offers, this will create customers’ interested and satisfaction. On the other hand, e-mail marketing can work as a platform where both seller and buyers get together even if they are physically separated. By doing this, sellers can provide further information that can help the users’ decision (Jackson & DeCormier, 1999). In order to know more about the customers’ interests, market-ers ask them to fill out a survey when registering for the service. Then marketmarket-ers match these needs with proper e-mail advertisement (Krishnamurthy S. , 2001).
As mentioned before, E-mail marketing shows remarkable advantages but also disadvantages. On fol-low, some of them will be explain.
Advantages of e-mail marketing:
The return is higher than the investment.
Messages can be customized according to the customers’ profile.
E-mail marketing is easy to track: Number of mails sent, number of e-mails opened and who opened up, the number of people who are not registered.
Messages can be schedule to be sent to certain customers and in certain days. It is faster and more efficient than other e-marketing tools
E-mail marketing is subject to customer approval, only customers that accept it voluntarily receive the mails.
Disadvantage of e-mail marketing:
Some e-mails end up in the junk folder.
It isn’t easy to keep the customer engage to the subscription.
Messages have to be creative in order to get the customers’ attention. Sometimes, companies require a sophisticated system of e-mails newsletter
E-mail address can be overloaded (Fariborzi & Zahedifard, E-mail Marketing: Advantages, Disadvantages andImproving Techniques, 2012).
Advantages of e-mail marketing creates another problem which decreases response rate of marketing e-mails; spam. Spam mails are defined as unwanted mails sent randomly to a large amount of user (Ukai & Takemura, 2007). Customers choose to delete these e-mails when they come from a marketer; however, they hesitate more when the e-mails are from people they know (Phelps, Lewis, Mobilio, Perry, & Raman, 2004).
Fariborzi and Zahedifard (2012) propose some tactic for relevant content of mails; Select the content according to the target
Select the content according on the sale cycle
Let customers be involved in the content construction by listening to their needs Schedule mails according to customers’ needs
Personalize the content dynamically
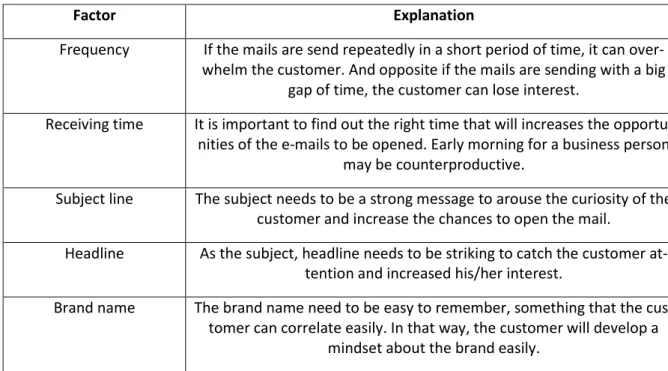
According to Chittenden, Rettie (2003), Ellis-Chadwick and Doherty (2012), some key factors exist for marketing e-mails which affect response to e-mails. These factors can be collected under two main categories; factors about usage of marketing e-mails which has effect on opening or deleting e-mail, and factors about structure of the e-mails which affect response to e-mail and retain process. Main key factors are collected below, in Table 2-1 and Table 2-2.
Table 2-1 Key Factors Related to Usage
Factor Explanation
Frequency If the mails are send repeatedly in a short period of time, it can over-whelm the customer. And opposite if the mails are sending with a big
gap of time, the customer can lose interest.
Receiving time It is important to find out the right time that will increases the opportu-nities of the e-mails to be opened. Early morning for a business person
may be counterproductive.
Subject line The subject needs to be a strong message to arouse the curiosity of the customer and increase the chances to open the mail.
Headline As the subject, headline needs to be striking to catch the customer at-tention and increased his/her interest.
Brand name The brand name need to be easy to remember, something that the cus-tomer can correlate easily. In that way, the cuscus-tomer will develop a
mindset about the brand easily.
Source: (Chittenden & Rettie, 2003) and (Ellis-Chadwick & Doherty, 2012) Table 2-2 Key Factors Related to Structure
Factor Explanation
Message content The body of the message should be easy to follow and well structure, so the customer can ensue the content and get more interest. Brand logo placement In most of the cases, logos are located in the left upper corner. This is a
convention and customers can detect it easily.
Personalization To personalize the mail according to the customer’s trait and consider-ing the stage of the relationship s/he has with the company, can
in-crease the likelihood of click in the buy bottom.
Length of e-mail In order to engage the customer’s interest, the length of the mail should long be enough to express the whole message efficiently, not to short
that customers will get concerns and not too long and they become bored to read.
Hyperlinks Sometimes the use of link helps to enriched the message, however, the number of them should be limited. In most of the cases, 2 hyperlink are
good enough
Animation This can help to get customer’s interest but it is highly linked with the customer’s traits to get optimal results.
Images Images always help to the interaction of the message, they make the content friendlier and easily to follow.
2.4
Online Customer Behavior to Marketing E-mails
In most cases, customers feel overwhelmed when receiving marketing e-mails. Thus, when a customer receives a large amount of e-mails daily, s/he will separate the important ones and delete the irrele-vant ones specially if they have commercial information (José-Cabezudo & Camarero-Izquiredo, 2012). According to Andersson, Fredriksson and Berndt (2014), attitudes to marketing e-mails have evolved tremendously positive in the last years, this can be supported by the number of e-mails opened and the ones that were clicked on the buy option. The decision of buy or not buy online through e-mail marketing is influenced by the perception of the value of the advertising.
The decision to open or not an e-mail marketing is highly influence from a previous experience with the brand or its product, in most of the cases, this will define the potential interest and a decision to repurchase. Some of the possible reactions are mentioned on follow:
The customer will open or delete the e-mail. The receiver will take a decision almost without hesitation.
The customer got interested in the e-mail and s/he will open it, starting an engagement to the brand
The customer gets to open the e-mail to check the content and this will lead in a further step in the engagement.
After opened it, the customer might delete the mail creating negative feeling through the brand. (Andersson et al., 2014).
It is important to mention that theses reactions are subject to the frequency of the arrival of the mails. On the other hand, Micheaux (2011) states that, when customers receive marketing e-mails, they un-consciously decide if it is a potential interest or not. Usually this decision is based on recalling previous experiences with the brand, other marketing e-mails and the subject line. And this decision can be categorized in three groups:
A: The customer decides to ignore the marketing e-mail, without further hesitation. There is a risk that the customer might unsubscribe but most often, they will be neutral with respect to further marketing e-mails from the same source. Customers don’t change their perception of the brand, despite the over-flow of marketing e-mails.
B: The customer decides to open the marketing e-mail because they found something relevant that worth to be opened. If this is the scenario, s/he will start potentially engaging through reaction behav-iors. This is a perfect scenario for the brand to keep building a relationship with the customer. When a customer chooses B, s/he doesn’t feel overwhelmed with an increase of marketing e-mails.
C: After having a good perception of the brand through marketing e-mails and start building an im-portant relationship, the customer feels pressure with the excess of marketing e-mail, this is the worst scenario and may destroy any relationship built, leading into complete rejection of the brand.
Finally, according to Zviran, Te’eni, and Gross (2006) argue that customers are more likely to open marketing e-mails, is they evocate positive emotions. Therefore, colors play an important role in mar-keting e-mails, because they can grab customers´ attention by producing positive reactions. Same au-thors express that key is to understand the link between color and customer behavior through two dimensions: boredom/excitement and relaxation/tension. Customers are more likely to act as pre-dicted when they feel excited instead of bored and when they feel relaxed instead of tense. So colors like pastels are related to relax and bright colors are related with excitement.
3
Methodology
In this chapter, the choice of the method for this research is presented with the reason of choice. Infor-mation about research approach, selection of data collection with survey design, sample selection and short description of analysis are provided.
3.1
Research Method
A research design is categorized as two main type; exploratory and conclusive. Exploratory research design is used to identify and understand a problem, after that, to create a hypothesis. A lack of un-derstanding is required. On the other hand, the problem or phenomena is already defined in the con-clusive research design, which intends to test the problem and pre-defined relationship within the problem (Malhotra, Birks, & Wills, 2012). For the purpose of this research, conclusive research design was applied. The factors which are related to the problem are already defined and the purpose is to analyze and compare the relation of the factors with the problem.
The research approach can be qualitative or quantitative. Mostly, quantitative approach is used for a conclusive research and qualitative research is used for an exploratory one (Malhotra et al., 2012). Qualitative research is used to understanding a problem through reasons and motivation by collecting non-numerical data. In contrast, quantitative research uses numerical data to examine the problem and relationship with causes. The purpose of the study requires the use of statistical data to examine the reasons of the problem, quantitative research uses numerical data for data collection and analysis (Malhotra et al., 2012). Because of that, quantitative approach was selected for this study.
According to Easterby-Smith, Thorpe and Jackson (2015), there are three methods to collect data for a quantitative research, survey, quantitative observation and databases. Survey and observation are primary data sources and databases are secondary data source.
Unlike secondary data, primary data is collected by the researcher, it provides more control over the collection process and results. Secondary data, such as databases contains public or statistical data which are collected usually by financial agencies or government and they are not always suitable for different research topic, these databases are collected according to specific research topic. To have more freedom in this study and to be able to design the methodology according to the chosen research question, one of the primary data sources was selected for data collection process, which is the survey. This study does not mainly focus on how customer behave, but focus on reasons for ignoring marketing e-mails and how to improve it. Also large amount of data should be collected for validity and reliability, which cannot be done via observation in a limited time period. Data collection by survey requires less time. Because of that, answers of the research questions cannot be collected with observation. An-other advantages of survey are that questions are structured and answers are predetermined which make the analysis process simpler more reliable than other methods. Variety of collected answers are limited by interviewer. In order to collect data for the research problem, statistical results of survey give a better result.
There are four ways of conducting a survey; postal survey, web survey, face-to-face interview survey and telephone interview survey (Easterby-Smith et al., 2015). For reliability and validity, the survey of the study should be conducted by as many people as possible in short time and web survey is better way to do that. Only by sending the link of the survey, survey can be shared and involvement of the researcher is not necessary. It is also costless unlike phone and postal survey.
3.2
Sampling Method
Sampling process, which contains size and method selection, is an important part of the survey. Two main errors may occur during sampling. Because of the random sampling, respondents may not diverse enough. Secondly, non-response bias also causes a problem if similar characteristics does not exist in sample (Barlett, Kotrlik, & Higgins , 2001). For this study, the probability of the sampling error is de-creased by increasing the size of the sample. Nonetheless, the sample of this study is not large enough to make it representative for whole country.
In order to increase the sample size more efficiently, two non-probability sampling techniques, which are convenience and snowball sampling, were combined. As first step, the web survey is shared in and around Jönköping university randomly via online platform. Convenience sampling technique requires less time but its disadvantage is sample cannot be representative (Malhotra et al., 2012). For second step, respondents were asked to pass the survey to their network, which will help to increase the var-iation by reaching people which cannot be reach via convenience sampling (Easterby-Smith et al., 2015).
3.3
Data Collection
For data collection, a survey with 46 questions were prepared and shared via a web-based survey ap-plication Google Forms. The Survey questions is located in Appendix A: Survey Questions. To design the survey questions, the key factors which are defined in previous chapter are used.
Two possible errors might occur while conducting the survey, which affect the research. One of the error is misinterpretation of the survey questions by respondent (Gable, 1994). It can happen because interwiever is not present during conduction and cannot help the respondent. It would be an important issue with the survey of this study because it contains keywords from previous literatures and they can be misunderstood. Misinterpretation may completely change the outcome of the survey and makes it inaccurate. According to Gable (1994), researchers should be able to estimates answers and section of the survey which might cause misinterpretation. To prevent this problem, every category of questions starts with a brief introduction to inform respondents about next question category. Questions, which contain key words from literatures have explanations in order to make it more clear for respondent. Before publishing the survey, a final draft was tested on a pilot sample of six people from the real sample. After the test, time requirement to complete the survey was obtained and survey questions are corrected according to feedbacks from pilot sample in order to make the survey easy to understand and less likely to misinterpret.
Questions are separated under three categories;
1. General questions about respondent and their online behavior
2. Respondent’s previous marketing e-mail experience (regarding first research question) 3. Respondent’s desire from marketing e-mails (regarding second research question)
The survey contains two types of questions; multiple choice and itemized rating scale. For multiple choice question, category scale is used. By creating categories, respondents are grouped for further analysis. For second type, the Likert scale is adopted as seven-point response scale; from one to seven, as a range from strongly disagree to strongly agree. In this type of questions, statements are presented which respondent should choose degree of agreement. For specific questions like financial situation
and online purchase behavior, the scale is ranged from rarely to frequently. Range to seven is selected instead of to five in order to give to respondent wider answer range. Except financial situation ques-tion, all questions were prepared as a mandatory question in order to prevent unanswered question.
3.4
Data Analysis
IBM SPSS Statistics Version 21 was used for the analysis of the collected data. As preparation of analy-sis, couple of steps were followed;
1. All responses were checked for consistency. 2. Inconsistent participants were deleted. 3. Codes were assigned to answers. 4. Survey data was imported to SPSS.
5. Types of variable were assigned to responses.
6. Collected data was visualized with charts for explanation.
7. Data analysis methods were selected. (adopted from: Malhotra et al., 2012)
In order to answer the first research question, the descriptive analysis method was selected and the answers of second part of the survey were used. Data was collected as non-metric data. Mean values and frequencies of the data collected from second part of survey were calculated and compared. In order to answer second question, data collected from third part of the survey was used for the principal components analysis. In final section, each statement is about different variable which influ-ence the decision making process. Some of these variables are related to each other and can be col-lected as components. By using this analysis method, researchers aimed to reducing the amount of variables to components and analyzing of components. Collecting variables under different component and it makes the analysis simpler.
As last step, one of the multivariate technique, cross-tabular analysis was used in order to find a rela-tionship between variables from part one and other two part.
Histograms, graphs and tables are used to visualize results and make conclusion.
3.5
Ethical implications
When it comes to data collection, ethics plays an important role. For this research the following aspects will be taking in consideration:
Participants do the survey anonymously All opinions are taking in consideration
Participants are informed about the subject of the research before hand Survey is subject to voluntary participation
No private questions are considered for this survey Participants are encouraged to answer honestly Only necessary data is collected
After collection, researches are commitment to treat the information as it was received from partici-pants, and keep its original traits in order to achieve the highest reliability as possible.
4
Survey Results
The collected data is presented in three sections. The first section shows diversity of respondent, the second one, related to the first research question, shows information that affect the decision of ignore the marketing e-mails. Lastly, in third section, the data is related to the second research question, it examines the variables which affect the revisit decision of the respondents. On following, further detail of the survey results will be presented.
4.1
Sample information
120 respondents participated to the survey. Within the respondents, 20 of them showed inconsistency in their answers. After disregarding inconsistent respondents, sample contains 100 respondents. As mention previously, this section was designed to collect general and relevant information to deter-mined diversity and main traits of the respondents, which are highly valuable for the further analysis. In order to collect this data, questions about gender, employment, educational level, age, financial level and online purchasing behavior were chosen. During analysis, this data was used to analyze the relationship between decision and different group of respondent.
The answers for these questions were given as alternatives, and required to choose only one of them. Four alternatives for employment, educational level and age range, while only two options for the gender question. Bar graph were chosen because it is easier for understanding the overall data and to separate it by gender.
In Hata! Başvuru kaynağı bulunamadı., the first thing to notice is that the sample is mostly composed by male respondents, represented by 54% of the sample populations and slightly below 46% is repre-sented by women. Same color which is used in Hata! Başvuru kaynağı bulunamadı. for opposite gen-der is used for other figures in orgen-der to visualize the different results of opposite gengen-der. Female pop-ulation is represented by red color and male poppop-ulation is represented by blue color.
Figure 4-1: Sample gender distribution
Source: Authors
In the following graph (see Figure 4-2), the distribution of the employment status of the respondents is shown, almost half of the population is full-time worker; and slightly below, unemployed people, these opposite peaks will play an important role in the analysis.
54 46 42 44 46 48 50 52 54 56 Male Female
Figure 4-2: Employment status distribution
Source: Authors
On next, the distribution of the education level of the participants is shown in the following graph. (See Figure 4-3) The sample mostly hold a master degree and in a slightly lower proportion, bachelor de-gree. Sample does not contain any respondent with high school degree, because of that, high school level is excluded from cross-table analysis.
Figure 4-3: Education level distribution
Source: Authors
Finally, the majority of the respondents are between 18 and 25 years old, however an important num-ber of respondents are between 26 and 35 years old.
21 6 25 2 15 6 22 3 0 5 10 15 20 25 30 35 40 45 50
Unemployed Part Time Full Time Retired
Fre q u en cy Man Woman 0 24 28 2 0 23 22 1 0 10 20 30 40 50 60
High school Bachelor Master PhD
Fre q u en cy Man Woman
Figure 4-4: Distribution of age ranges
Source: Authors
For the financial level situation of the respondents’ question, a scale from one to seven were provided as answer, and only one could be selected. This scale is intended to measure personal perception of the respondents regarding their situation. The highest result is slightly above average (five) which was chose by 40% of the respondents and as second place, average (four) was chose by 25% of the re-spondents. (See Figure 4-5). Only for this question, respondents are allowed to not answer, because they might think the question is personal. Result shows that, even though the responses are not bal-anced, sample covers different financial situations.
Figure 4-5: Distribution of personal financial perception
Source: Authors
For the online purchase frequency of the last six months of the participants question, a scale from one to seven were also provided as answer, and only one could be selected. The answers are varied, the highest result is slightly below average (three) which was chose by 20% of the contestants, followed very closely by average (four) which was chosen by 19% of the respondents and as a third place rarely (one) was chose by 17% of the respondents. (See Figure 4-6) This variance, starts giving clues of the respondents´ online shopping behavior. The sample contain respondent with different online purchas-ing behavior. 20 17 11 6 18 17 5 6 0 5 10 15 20 25 30 35 40 Fre q u en cy Man Woman 0 5 10 15 20 25 30 35 40 No response 1(below average) 2 3 4 5 6 7 (above average) 11 3 0 10 25 40 8 3 Fr e q u e n cy
Figure 4-6: Distribution of online purchasing for last six months
Source: Authors
These data will be used for cross-tabular analysis. Sample contains different groups of respondents which make comparing these groups and their response to marketing e-mails possible.
4.2
Ignoring Marketing E-mails
In this section, questions were designed to understand the most common reasons why marketing e-mails are ignored from the customers´ perspective. Most common characteristic of marketing e-e-mails was chosen for the questions.
For the average number of marketing e-mails that they receive in weekly basis question, four alterna-tives were provided as possible answers. As expected most of 50% of the respondents receive between 3 and 20 e-mails weekly, on the other hand only 16% receive more than 20 e-mails weekly. (See Figure 4-7) The figure shows that almost all of the respondent experienced marketing e-mails and fill the survey based on that experience.
0 2 4 6 8 10 12 14 16 18 20 1(Rarely) 3 5 7 (Frequently) 17 11 20 19 13 8 12 Fr e q u e n cy
Figure 4-7: Distribution of received marketing e-mails from a single company
Source: Authors
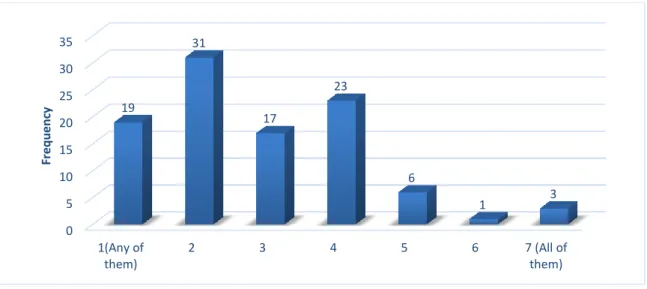
The number of marketing e-mails that participants read before deleting them, is analyzed in the next graph. The scale from one to seven was provided as answers, being one - any of them and seven - all of them. Respondents were required to select only one option as answer. As majority, 31% of the respondents chose two as option indicating that they delete most of the marketing e-mails they re-ceive. (See Figure 4-8) This data and data which is shown in
Figure 4-7 is an indicators of customers’ marketing e-mail experience. It also proves that people are more likely ignore most of the marketing e-mails and this study is based on this problem.
Figure 4-8: Frequency distribution of ignored marketing e-mails
Source: Authors
When it comes to main factors of reasons why marketing e-mails are deleted or ignored, four of them where selected for this survey. Different variables which are part of these factors are asked to respond-ent. Respondents expressed what they considered most important; again a scale from one to seven were provided as possible answer, and requested to select only one. (See Figure 4-9) one is for strongly disagree and seven is strongly agree. In order to show comparison among variables, mean values are used. 0 10 20 30 40 50 60 70
None One or two Between 3-20 More than 20 0 14 67 16 Fr e q u e n cy 0 5 10 15 20 25 30 35 1(Any of them) 2 3 4 5 6 7 (All of them) 19 31 17 23 6 1 3 Fr e q u e n cy
SENDER: Conductors chose three variables and respondents rated them according to their ef-fectiveness. The results of these questions shows that, respondents are more like to open a marketing e-mail when the sender is a previous-experienced brand; the average for this ques-tion is 5.38, highest in this category. The second highest variable was trust in the brand, in average respondents will be more likely to open a marketing e-mail if the sender if a well know brand, average answer for this question is 5.21. As third valuable variable specific sender was selected, respondents agreed that is the marketing e-mail is sent by a specific sender instead of an auto generated sender, they will be more likely to open the marketing e-mail, average for this question was 4.2.
SUBJECT LINE: Conductors chose four variables and asked respondents which ones they con-sidered more important. The results of these questions showed that, respondents value the most if the subject line shows specific information such as discounts, in this scenario, they are more likely to open the Marketing e-mail; average for this question was 4.94. As a second factor, respondents agreed that they will be more likely to open the Marketing e-mail if the subject line is personalized, for example mention their names. Average for this question was 4.93. On next, the most valuable variable for respondents is the length of the subject line, when this matches their criteria, respondents will be more likely to open Marketing mails, av-erage for this question is 4.31. Finally, respondents stated that the attachment symbol in the subject line is no relevant in their decision to delete/ignore a marketing mail, average for this question is 3.52.
Figure 4-9: Mean values of different factors
Source: Authors
RECEIVING TIME: Conductors chose two variables for this questions and asked respondents which ones they considered more important. Respondents agree that the most important thing about the receiving time of the Marketing e-mail, is the specific time of arrival; average for this question is 3.12. On the other hand, the day of arrival isn’t that value, average for this question is 2.89.
FREQUENCY: Conductors asked how valuable is for respondents, the frequency of arrival of the Marketing e-mails, average for this question is 4.16, slightly above average. This factor has only one variable.
4,16 3,12 2,89 4,2 5,38 5,21 4,94 4,31 3,52 4,93 0 1 2 3 4 5 6 To tal Ti me o f th e d ay Day o f th e w ee k Sp ec ific se n d e r Ex p eri e n ce w ith b ran d Tru st to b ran d Co n te n t Le n gth A ttac h eme n t Per so n al iz at io n
Frequence Receiving Time Sender Subject Line
Me
an
Va
lu
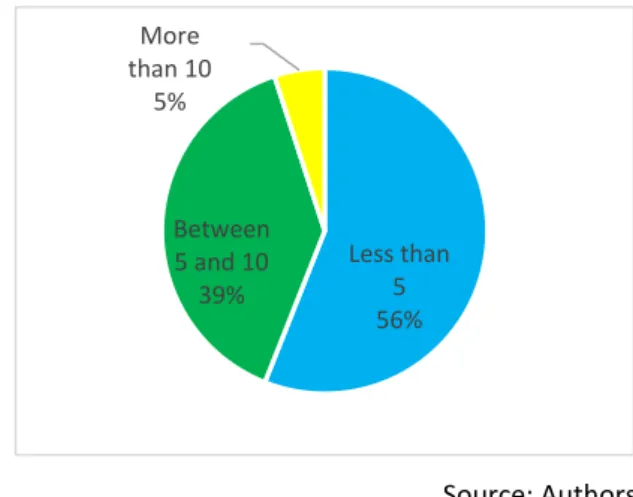
On the follow up of the frequency question, conductors asked participant which range the considered an appropriate frequency for the arrival of the Marketing e-mails. (See Figure 4-10)
The majority of the respondents stated that less than five marketing e-mails in one-month period from a single company is an acceptable number of these mails; however, an important 39%, considered that between 5 and 10 e-mails are an acceptable number.
Figure 4-10: Distribution of marketing e-mail frequency preference
Source: Authors
On this question, conductors inquired deeper of the receiving time, respondents were asked which is their preferable time of the day and day of the week to receive marketing e-mails. (See Figure 4-11). Regarding the time of the day, participants stated in majority that it isn’t relevant for their decision of delete/ignoring the marketing e-mail. However, 21% agreed that evening is the best time for arrival; and if so, they will be more likely to open the Marketing mails.
Regarding the day of arrival, participants stated as majority (47%) that weekends are the ideal days to receive Marketing e-mails. On the other hand, an important 40% of the participants agreed that it isn’t important in their decision to delete/ignore these e-mails.
Figure 4-11: Distribution of receiving time preference (a-time of the day, b-day of the week) a) time of the day b) day of the week
Source: Authors Less than 5 56% Between 5 and 10 39% More than 10 5% Morning 12% Afternoon 9% Evening 21% Night 15% Not important 43% Weekdays 13% Weekend 47% Not importan t 40%
4.3
Desired Marketing E-mail Structure
In this section, questions were designed to collect most common insight about the desired Marketing e-mail structure by customers. Scale from one to seven were given as possible answer and required to select only one.
Conductors asked to respondents how many times they repurchased online because of marketing e-mails. (See Figure 4-12). For this question, answers were varied, 28% marked two as answer indicating that they barely bought again because of marketing e-mails. Another important majority of 26% marked one indicating that they never repurchased because of Marketing e-mails; and in the other end, 5% marked seven as answer, indicating that most of their online repurchases were due to mar-keting e-mails.
Figure 4-12: Frequency distribution of marketing e-mails which cause revisit and/or repurchase
Source: Authors
On next, some of the most relevant variables desired by customers, which are found in the literature review of this study, were taking on consideration by conductors in the survey and respondents were ask to rate them in a scale from one to seven, according to what they consider more effective on the decision. (See Figure 4-13 and Figure 4-14: Distribution of mean values for contextual variablesFigure 4-14) Twenty-four different variables were selected in this section and they can be collected under four components for further analysis. Answers are varied, an important number of these variables are rated above average and some less are rated below average. Deeper analysis of this section will take place in the following sections of this study. In order to visualized the collected data, mean values of the answers are calculated and showed in the Figure 4-13 and Figure 4-14.
0 5 10 15 20 25 30 1(None) 2 3 4 5 6 7 (Many) 26 28 11 14 13 3 5 Fr e q u e n cy
Figure 4-13: Distribution of mean values for structural variables
Source: Authors
Figure 4-14: Distribution of mean values for contextual variables
Source: Authors
0 1 2 3 4 5 6 7
Time of the day Day of the week Frequency Length Textual info Illustration Illustration+text Link to webpage Link to social media Colors Language 3,28 3,42 3,33 4,55 3,31 4,86 5,12 4,68 3,72 4,32 4,65 Mean Value 0 1 2 3 4 5 6 7
Discounted price info New product launch Company events Product updates Attachement Other customers' experience Customization Name/surname info Location info Purchase history Forecast Personal info Payment method 5 4,87 4,18 4,07 3,16 4,29 4,56 4,35 4,32 4,88 4,94 4,98 4,3 Mean Value
For second research question, data for 24 different variables are collected which makes it harder to analyze. On the other hand, some of these variables are related to similar elements. In order to de-crease the number of analysis and make it simpler, principal component analysis will be implemented and variables will be collected under factors.
5
Analysis
In the following chapter, the collected data is analyzed and interpreted by using descriptive analysis methods and principal component analysis.
5.1
Descriptive Analysis for Ignoring Factors
In order to analyze the collected data for the first research question, descriptive analysis methods were used. As first step, mean values of responses were used for comparison. (See Figure 5-1: Mean value
comparison of factorsFigure 5-1) As mentioned before, mean values were calculated after converting
the string scale data to numerical data. Every variable which affect the ignoring decision is presented with yellow bars. All variables can be collected under a factor. These factors are frequency, receiving time, sender and subject line. Each mean factor has a total mean value which is calculated by using the mean values of its variables. For total mean value, average of its variables’ mean values is used and these total factor values are presented with green bars. Only exception is for frequency. In survey, there is only one variable related to frequency, because of that, total value of frequency is equal to variables’ mean value and it is presented with two color at the same time.
Figure 5-1: Mean value comparison of factors
Source: Authors According to the result of the analysis, the sender of the e-mail (mean value 4,93) is most relevant factor when deciding on ignoring the marketing e-mails. The sample agrees that this factor is critical in their decision, which is highly related to previous experiences of the customers with the same brand and the trustworthiness of it in the market. The subject line (mean value 4.43) has also an important influence in the customers´ decision when it comes to ignore a marketing e-mail, the sample agreed that the content and personalization are key for them to decide if ignoring or not. On the other hand, seeing attachment in the subject line is not as effective as other subject line variables. Finally, the frequency of the marketing e-mails plays a role in the ignoring-decision, but results show that fre-quency of the marketing e-mails does not influence as much as sender and subject line. On the other
0 1 2 3 4 5 6 7 To tal To tal Ti me o f th e d ay Day o f th e w ee k To tal Sp ec ific se n d e r Ex p eri e n ce w ith b ran d Tru st to b ran d To tal Co n te n t Le n gth A ttac h eme n t Per so n al iz at io n
Frequence Receiving time Sender Subject line
4,16 3 3,12 2,89 4,93 4,2 5,38 5,21 4,43 4,94 4,31 3,52 4,93 Me an Valu e
hand, the receiving time has the lowest score. Majority of the respondents are disagreeing with the provided statements. For them, receiving marketing e-mails in certain time of the day or certain day of the week does not affect the ignoring decision.
Even though the comparison of mean values shows a general comparison of different factors, it doesn’t provide a deep analysis. In order to analyze more, frequencies and mode of each variable are investi-gated. Frequencies of each answers are presented in Table 5-1 and most recurrent answers are high-lighted.
Table 5-1: Frequency distribution for each variable
Source: Authors Frequency: The majority of the sample kept a neutral position for this factor, 29% agreed that the frequency isn’t relevant for their decision of ignoring a marketing e-mail. But almost half of the sample (%42) are agreed that frequency of the marketing e-mails affects their decision.
Receiving time: When it comes to receiving time, two variables were taken in consideration. First, ar-rival time of the day, a notable majority of 37% completely dismiss this factor as an influence for their decision of ignoring marketing e-mails. Second, the day of arrival, as the previous one, most of the sample agreed that this factor isn’t relevant either for the ignoring decision. Regarding the receive time and day, a remarkable majority of the sample disagree that these two sub-factors influence their deci-sion.
Sender: Three sub-factors were analyzed regarding to sender; specific sender, experience with the brand and trust in the brand. Firstly, most of the respondents agreed that specific sender is a highly valuable sub-factor for their decision of ignoring marketing e-mails, this is closely related with the trust that the sender can mean to the customers. Second, experience with the brand was also accepted as a highly important sub-factor by customer when deciding to ignore a marketing e-mail, by a total of 83% of the sample, only 11% of the sample disagree the effect of previous experience. Finally, majority of the sample agreed that trust in the brand is also a high valuable factor for them when deciding if ignore a marketing e-mail or not, which can be related with the reputation that the company hold in the market.
Subject line: Four sub-factors will be analyzed here, content, length, attachment and personalization. Firstly, for content, 67% of the sample qualified this sub-factor as important for them when making the decision of ignoring a marketing e-mails. Secondly, most common answer to length and attach-ment is neutral position. On the other hand, for half of the sample, length of the marketing e-mail
1 (Strongly Disagree) 2 3 4 (Neither Agree nor Disagree) 5 6 7 (Strongly Agree) Total Frequency 10% 5% 14% 29% 21% 14% 7% 100%
Time of the day 37% 13% 4% 15% 15% 10% 6% 100%
Day of the week 32% 28% 6% 8% 10% 11% 5% 100%
Specific sender 15% 2% 16% 20% 17% 22% 8% 100% Experience with brand 3% 2% 6% 6% 26% 40% 17% 100% Trust to brand 3% 3% 2% 15% 29% 35% 13% 100% Content 4% 4% 7% 17% 29% 25% 14% 100% Length 8% 9% 11% 23% 22% 19% 8% 100% Attachement 14% 18% 14% 28% 12% 10% 4% 100% Personalization 4% 2% 2% 28% 29% 23% 12% 100%
affects their decision. For attachment, majority of the sample thinks that the attachment in the subject line does not affect their decision. Finally, personalization in subject line, only 8% of the sample disa-greed that this is a crucial sub-factor for them to decide ignoring the e-mail.
For the frequency and receiving time factors, extra questions were asked to respondents in order to collect their preferences.
Table 5-2: Purchase history * frequency preference cross tabulation
Frequency Preference
Less than 5 Between 5
and 10 More than 10 Online Purchase Behavior Frequently Count 11 9 0
% within Purchase History 55,0% 45,0% 0,0%
% within Frequency Pref-erence
19,6% 23,1% 0,0%
Sometimes
Count 29 20 3
% within Purchase History 55,8% 38,5% 5,8%
% within Frequency Pref-erence
51,8% 51,3% 60,0%
Rarely
Count 16 10 2
% within Purchase History 57,1% 35,7% 7,1%
% within Frequency Pref-erence
28,6% 25,6% 40,0%
Source: Authors
As seen in Table 5-2: Purchase history * frequency preference Table 5-2, combines the online purchase
behavior of the respondents and their opinions regarding an acceptable number of marketing e-mails received in a one-month period.
People who choose six or seven as answer in the scale in the frequency of their online purchase are considered as a frequent customer, which in this case reaches a total of 20 people; 45% of them agreed that between 5 and 10 e-mails is an acceptable number of marketing e-mails received in a one-month period; 55% of the frequent segment agreed that less than 5 marketing e-mails is an acceptable num-ber in the same period.
People who choose between three and five as answer in the scale in the frequency of their online purchases are considered as sometimes customers, in this case makes a total of 52 people; 38.5% of them agreed that between 5 and 10 marketing e-mails is an acceptable number of marketing e-mails received in a one-month period; 55.8% agrees that less than five is an appropriate number and 5.8% agreed that more than ten is an acceptable number.
Finally, people who choose one and two as answer in the scale in the frequency of their online pur-chases are considered as rarely customers, reaching a total of 28 people in this sample; 35.7% agrees that between 5 and 10 is an acceptable number of marketing e-mails received in a one-month period, 57.1% agreed that less than five is an acceptable number and 7.1% agreed that more than 10 is an acceptable number.
Researchers agree that people which have more active online behaviors are most likely to receive more than five e-mails in one-month period, which is a sign of the start of a relationship between the cus-tomers and the brand. On the other side, people that buy only sometimes are less likely to receive more than five marketing e-mails per month and in a very similar situation, people who rarely buy online prefer to receive less than five marketing e-mails per month. Percentages of acceptance for these range of marketing e-mails vary considerably for each group of online costumer (see Table 5-2). On the other hand, the three groups of online consumers show similar results regarding the ac-ac-ceptance of less than five marketing e-mails in a one-month period, the acac-ac-ceptance percentage for this range of e-mails reaches around 55%. The majority of the sample, regardless their online shopping behavior, agree that less than five marketing e-mail per month is an acceptable number for their inbox.
Table 5-3: Employment * time preference cross tabulation
Arrival Time Preference
Morning Afternoon Evening Night Not important
Employ-ment
Full time
Count 8 7 6 9 20
% within Employment 16,0% 14,0% 12,0% 18,0% 40,0%
% within Time Preference 61,5% 70,0% 27,3% 56,3% 44,4%
Part time
Count 5 1 1 0 6
% within Employment 38,5% 7,7% 7,7% 0,0% 46,2%
% within Time Preference 38,5% 10,0% 4,5% 0,0% 13,3%
Retired
Count 0 0 2 2 1
% within Employment 0,0% 0,0% 40,0% 40,0% 20,0%
% within Time Preference 0,0% 0,0% 9,1% 12,5% 2,2%
Unem-ployed
Count 0 2 13 5 18
% within Employment 0,0% 5,3% 34,2% 13,2% 47,4%
% within Time Preference 0,0% 20,0% 59,1% 31,3% 40,0%
Table 5-3 combines the type of employment of respondents and their time of arrival preference. Regarding full-time employees; 16% of them prefer to received marketing e-mails in the morning, 14% of them prefer to receive marketing e-mails in the afternoon, 12% of them prefer to receive marketing e-mails in the evening, 18% of them prefer the night to receive marketing e-mails, finally 40% consider that the arrival time isn’t important. This night as arrival time preference predominate in this group with 18% of acceptance.
Regarding part- time employees; 38.5% of them prefer to received marketing e-mails in the morning, 7.7% of them prefer to receive marketing e-mails in the afternoon, 7.7% of them prefer to receive marketing e-mails in the evening, 0% of them prefer the night to receive marketing e-mails, finally 46.2% consider that the arrival time isn’t important. The morning as arrival time preference predomi-nate in this group with 38.5% of acceptance
Regarding retires; 0% of them prefer to received marketing e-mails in the morning, 0% of them prefer to receive marketing e-mails in the afternoon, 40% of them prefer to receive marketing e-mails in the evening, 40% of them prefer the night to receive marketing e-mails, finally 20% con-sider that the Source: Authors