School of Innovation, Design and Engineering
From Integral to Modular
A Case Study in Production System
Development with a Simulation Perspective
Master thesis work
30 credits, Advanced level
Product and process development Production and Logistics
Erik Andersen
Report code: PPU503
Tutor (company): Andreas Larsson Tutor (university): Mats Ahlskog Examiner: Antti Salonen
ABSTRACT
In the pursuit of excellence industrial companies are increasingly employing production system development to rationalize their processes. One such approach that has been employed to great extend in the automotive industry is that of introducing modularity to the product design. This shift from integral products to modular ones, is associated with a higher level of standardization of parts and processes. However, researchers are still mapping out this correlation. As the connection between modularity and the recorded effects is still up for discussion, still fewer studies have been made on how to most effectively adopt modularisation. This thesis is therefore a research that explores the relationship between product design and production from a perspective of production system development. It is a collaborative study conducted with a manufacturer of industrial robots that is preparing to transition from an integral product design to a modular one. The case study utilizes discrete – event simulation to model the impact of such a changeover in the production system. Not resulting in a step-by-step how-to guide, the study nevertheless shows that discrete – event simulation can prove to be a valuable asset both when analysing what-if scenarios and when pinpointing pre-emptive measures in order to mitigate any negative disruption such a transition might initially bring.
ACKNOWLEDGEMENTS
This thesis relates to the final 30 credits of the Master level engineering studies within Production and Logistics at Mälardalen University. It has been conducted at ABB Robotics AB in Västerås, Sweden.
I would like to thank ABB for making this collaborative research possible. It has been really fascinating to observe your work and I am grateful for the opportunity to increase my learning in a practical context. Thank you, Andreas Larsson, for your support as my company supervisor. Your feedback and input have been greatly appreciated. I would also like to extend this thanks to Simon Gräsberg, Anna Palmgren and Kerstin Olsson, that together with Andreas formed a cross functional team that could give guidance, input and feedback from multiple perspectives. Your aid has raised the quality of this study.
Thanks also to my university tutor Mats Ahlskog as well as Victor Azamfirei for your input to the study and for your continual feedback on the report.
ABBREVIATIONS
CM Conceptual Model
DES Discrete Event Simulation
KPI Key Performance Indicator
MTBF Mean Time Between Failures
MTTR Mean Time to Repair
PSD Production System Development
TSS Time-Slicing Simulation
VSM Value Stream Map
Contents
1. INTRODUCTION ... 8
1.1. RESEARCH BACKGROUND ... 8
1.2. RESEARCH PROBLEM ... 9
1.3. PURPOSE AND RESEARCH QUESTIONS ... 9
1.4. SCOPE AND LIMITATIONS ... 10
1.5. THESIS OUTLINE ... 10 2. RESEARCH METHOD ... 12 2.1. RESEARCH APPROACH ... 12 2.2. RESEARCH PROCESS ... 12 2.3. RESEARCH DESIGN ... 13 2.4. DATA COLLECTION ... 13 2.4.1 Literature review ... 13 2.4.2 Simulation Approach ... 14 2.5. DATA ANALYSIS ... 21 2.6. QUALITY OF RESEARCH ... 22 3. FRAME OF REFERENCE ... 23 3.1. THE PRODUCTION SYSTEM ... 23
3.2. PRODUCTION SYSTEM DEVELOPMENT ... 24
3.3. SIMULATION ... 25
Choosing Simulation Method ... 26
3.4. DISCRETE EVENT SIMULATION IN PRODUCTION SYSTEM DEVELOPMENT ... 27
3.5. MODULARITY ... 28
3.6. FRAME OF REFERENCE SUMMARY ... FEL!BOKMÄRKET ÄR INTE DEFINIERAT. 4. EMPIRICAL FINDINGS ... 29
4.1. COMPANY INFORMATION ... 29
4.2. INTRODUCTION TO CASE STUDY ... 29
4.3. CURRENT PROCESS ... 30
4.4. SIMULATION SETUP ... 31
4.5. SIMULATION RESULTS ... 32
5. ANALYSIS AND DISCUSSION ... 34
5.1. RESEARCH APPROACH ... 34
5.2. EMPIRICAL FINDINGS ... 35
5.3. BUFFER SIZES,BOTTLENECKS AND OUTPUT ... 35
5.4. THE CONTRIBUTION OF THIS RESEARCH ... 36
6. CONCLUSIONS ... 38
6.1. BRIEF SUMMARY ... 38
6.2. IMPLICATION OF THE FINDINGS ... 38
6.3. SUGGESTIONS FOR FURTHER RESEARCH ... 39
List of Figures
Figure 1 Simulation procedure according to Banks, et al. (2004) ... 15
Figure 2 Conceptual Model, Inputs & Outputs, Assumptions & Simplifications ... 18
Figure 3 Model Content, Scope. Areas shaded grey are included. ... 18
Figure 4 Model Content, Level of Detail. Areas shaded grey are included. ... 18
Figure 5 Alternative Simulation Approach, as suggested by Martin et al. 2019 ... 26
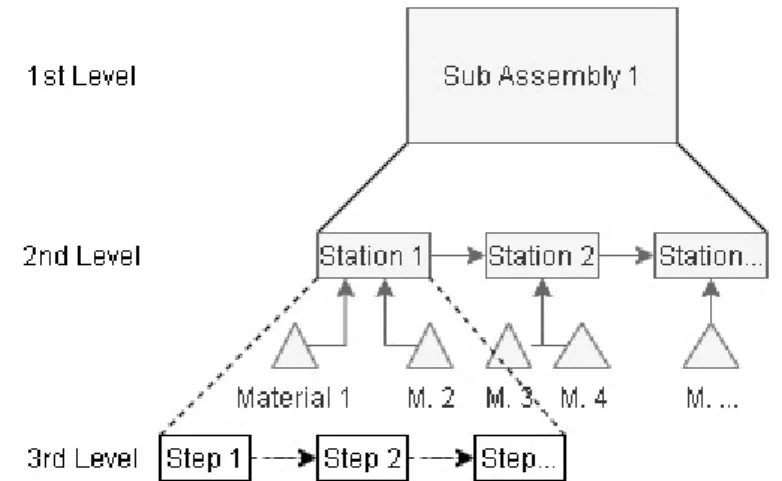
Figure 6 Abstract Representation of the Assembly system... 30
Figure 7 Scenario Comparison ... 32
List of Tables
Table 1 Cycle Time Matrix ... 311. Introduction
The following section explain the background of this research. This is followed by a problem formulation, which leads up to the thesis focal point and research questions. This is concluded with a research scope, limitations and outline of the research report.
1.1. Research Background
Production System Development (PSD), that is the process to attain higher efficiency in production, has long been one of the best ways to increase competitiveness (Bellgran & Säfsten, 2005). This is increasingly the case as quick changes in customer needs and market opportunities favour change-ready production systems, which requires excellent PSD (Rösiö & Bruch 2018). PSD emphasizes the improvement of present-day production systems and the development of new ones (Jonsson & Mattson, 2003; Bellgran & Säfsten, 2010). Such improvements have traditionally been an optimization of value adding events and numerous aspects of material handling (Sivard & Lundgren, 2008), which can range from the
implementation of incremental improvements to radically unique and ground-breaking ones (Bruch and Bellgran, 2014; Lager 2002).
The literature is very clear however, that effective PSD necessitates a holistic outlook since alterations at one end of the system might have unforeseen consequences at the other end (Gopalakrishnan et al. 1999). The interplay between all the operating variables is often
complex and thus requires a comprehensive perspective to mitigate the risk of sub-optimization (Jonsson & Mattson 2003; Robinson 2004; Rösiö & Bruch 2018). Such an outlook requires a grasp of each individual node in the system, including equipment as well as operators (Bruch & Bellgran, 2014; Rösiö & Säfsten, 2013; Wu, 1994). The drawback of this wider scope is
increased complexity in the PSD process, making it a troublesome issue to face with traditional approaches (Robinson 2004, Rösiö & Bruch 2018).
As the necessity for PSD has emerged ever more pressingly, alternative solutions have been adopted to a greater extent (Mourtzis 2019). Traditional engineering tools, such as flow charts, or value stream maps (VSM), are generally good at giving a “snapshot” of the production flow, but often fail to capture the variations, interconnectedness and complexity of a system, areas where simulation excels (Robinson 2004). Simulation is hence a hot topic in the PSD literature, as it has proven to be a powerful tool for evaluating and designing complex production systems (Mourtzis 2019). One of the many allures of simulation is that it provides engineers with a means to study alternative production scenarios with close to no risk and at low costs (Atieh et al. 2016; McGinnis & Rose 2017; Uriarte et al. 2018), compared to the common practice of the trial and error approach of changing physical properties of the production system (Rösiö & Bruch 2018).
Historically, the manufacturing industry has successfully utilized simulation in everything from product design, manufacturing and logistics, since it first emerged more than 70 years ago (Jahangirian et al. 2010). Tremendous development has taken place during these last decades as ever more potent hardware and user-friendly software enable simulation modelers to increase the build speed to fidelity ratio (Chwif et al. 2015; Sanchez & Wan, 2016). Simulation is consequently seen as a key enabling technology of the ever more interconnected and digitalized factory (Caggiano & Teti, 2018; Ferro, et al., 2017; Turner et al. 2016) and have been utilized to great extent by researchers tackling PSD issues (Negahban & Smith 2014).
1.2. Research Problem
In addition to attain higher efficiency in production (Bellgran & Säfsten, 2005), PSD also envelops product development as a tool to optimize production (Brettel et al. 2014). PSD can therefore be described as a continual strive for optimizing development processes of both production and product design (Bellgran & Säfsten, 2010; Sivard & Lundgren, 2008). One PSD strategy has therefore been to chase effective and efficient production by infusing a higher degree of modularity to the product design (Piran et al. 2020). A modularized design entails a combination of distinct building blocks (Kusiak 2002). Such blocks can then be shared in multiple products, allowing companies to rationalize manufacturing, engineering design as well as support processes across a wide array of products. Researchers report that such efforts have shown to reduce the overall costs, the bill of material, time to market and overall lead times, while at the same time increase levels of customer satisfaction with the products, as well as causing increased production flexibility, due to the higher standardisation of parts, requiring less overall documentation combined with that economies of scale also tend to weigh in (Gershenson et al. 2003; Kusiak, 2002; Lorenzi & Di Lello 2001). Additionally, functional modules also ease the product development by easing the updating of products and enables increased product variety from a smaller set of components, as well as simplifies the
maintenance of those products (Ulrich and Tung 1991). Studies show that modularity seem to have a positive relation on the overall financial performance of companies (Worren et al. 2002), as it mitigates the trade-off between product variety and operational performance (Salvador et al. 2002). Product modularity has therefore been implemented to great extent by leaders in the automotive industry (Salvador 2007).
However, the amount of empirical evidence linking these results to modularity, ensuring that relationship of cause and effect, is still very limited and more case studies are needed to measure the effects of such a strategy (Piran et al. 2020). Because of the lack of sufficient case studies, companies find it difficult to adapt a modularized product design and new case studies are therefore needed to guide companies on how to execute its implementation effectively (Frandsen 2017; Piran et al. 2020).
From the companies’ perspective, it might seem reasonable that a custom-made production line, specifically designed for modularity, would grant the highest yield of the associated benefits. But they encounter difficulties conjuring up an investment analysis for such a line, because of the distinct lack of case-studies on how beneficial it might prove to be (Piran et al. 2020). On the other hand, if modular products will be produced alongside non-modular products in the same line over a period for such an analysis, that would also introduce complications. One such issue (at least initially) would be the additional numbers to the product mix, which is generally associated with an overall lower output, resulting in lost revenue (Salvador et al. 2002). As simulation modelling has been utilized with great success in prior PSD challenges of similar nature, it stands to reason that simulation might also be useful in mitigating the severity of these challenges.
1.3. Purpose and Research Questions
As discussed in the preceding sections, previous studies of simulation in PSD has established its usefulness as a tool for understanding production systems. Researchers, focused on
modularity in product design, suggests further case studies as companies lack clear guidance on the issue. This thesis is therefore designed to study what advantage the use of simulation might bring to mitigate the risks of introducing new products of a modular nature to an existing
production line, fashioned for non-modular products. Consequently, this thesis addresses these following research questions.
• Research Question 1:
What consequences in terms of buffer sizes, bottlenecks and overall output, can occur when adding new products to a production line?
• Research Question 2:
What changes are needed to mitigate any negative disruption the new products might cause to the output?
To clarify, these research questions are to be seen with the perspective of analysing the initial effects that may occur when introducing modularized products to a production line. 1.4. Scope and Limitations
This thesis aims to outlay the contributions due to the use of simulation in a PSD scenario, studying the effects of introducing modularity in parts of the product mix. This purpose is to be reached by answering the research questions, which are designed from a holistic perspective, considering the entire production line. These questions are also formed as to be answerable via the quantitative output of a simulation model. The simulation model is designed to mimic the layout and behaviour of said production line. This requires the use of a case study methodology in order to achieve the desired effect. After the model has been validated and verified to ensure its degree of fidelity then experiments will be carried out by changing the input parameters and thereby accurately represent the fallouts of alternative production scenarios according to
McGinnis & Rose (2017), as this has been shown to aid companies in strategic decision making (Mourtzis 2019).
The study is confined to the limitation of a 30 credits course in terms of time. It therefore follows that the study is constricted to only a single case study. Therefore, the empirical data presented herein are findings from a single assembly line from a company in the manufacturing industry, designing and producing industrial robots. The applicability and usefulness of the results may therefore be somewhat limited in any application for decision makers in other sectors. The chosen experiment approach in this case study is discrete event simulation (DES), executed with the software ExtendSim 10, developed by Imagine That. A study of the choice of software lies outside of the scope of this thesis, so does the motivation of discrete event
simulation sub-approaches, as this is embedded within the software. The simulation model is restricted to only represent the production line according to the assumptions listed in the Conceptual Model chapter.
1.5. Thesis Outline
This thesis report consists of six chapters. Chapter 1 introduces the current research of the subject and the identified research problem. It outlays the thesis’ purpose and research
questions to be answered. It ends by defining the scope and limitations of the study. Chapter 2 defines the approach, process and design of the research, followed by a description of the empirical project. This is continued by two sections on data. Were the first one correlates its collection and the second to the process of it is examination. Chapter 2 concludes with a discussion on the overall quality of research carried out in the study. Chapter 3 has four
by another one on the application of simulation in PSD. The third section focuses solely on simulation methodology and the fourth section summarizes the chapter. Chapter 4 lists the empirical findings of the study. This begins with a brief introduction of the company and setup for the case study. This is followed by the results of the simulation model and the fallouts of the experiments. Chapter 5 is an analysis of the empirical findings. The research questions are answered, and a discussion of the implications and possible applications of the study follows. Chapter 6 summarizes the study and its findings and is concluded with suggestions for further research.
2. Research Method
This chapter outlays the chosen methodology and methods of this research as well as alternative approaches, also considered. This choice of method is motivated, and its
implementation is described step-by-step. There is also two sections at the end of this chapter discussing the process of data analysis and the general research quality of this study.
2.1. Research Approach
The Swedish counsel for science defines research as the systematic search for new knowledge (Vetenskapsrådet, 2017). While executing this search a researcher ought to adopt a suitable approach, in order to gain insight into a phenomenon or process (Karlsson, 2009). This is therefore an important chapter, as its purpose is to illuminate the author’s position as the approach will color the outcome of the research. Given the purpose for this study, to examine the consequences of adding new products to a production line, the assumption is made, that these consequences of interest are quantitative in nature. Meaning that they are quantifiable as factors to the overall performance of the production system. Given this assumption, the research approach is also predominantly quantitative. There are obviously also qualitative aspects to the study, as parts of the data collection were in qualitative form, but in a general sense the study has taken a quantitative route. The qualitative vs quantitative decision mostly reflects the anticipated results, although data collection methods were chosen rather due to their deemed effectiveness than from a systematic approach. Further discussion on the data
collection and the data analysis are found in their respective chapters.
Another reflection of the quantitative nature of this research can be found in the research questions themselves as they relate to numerical outputs of the anticipated simulation model. As these questions relate to a non-readily solvable problem that may have significant
implications in the industry it follows from the literature that a collaborative research approach is apt (Shani et al. 2007). A collaborative research entails cooperation between the researcher and practitioners who aim to improve the understanding of the problem (Ellström, 2008). This strategy allowed for an interaction between the author and a leading company in producing industrial automation. The collaboration was limited to the study of a single production line were new products are about to be introduced. The company desired to study the implications of this and an action plan to mitigate any negative disruption. For this they supplied data that could be used as inputs and guidelines for the simulation model.
2.2. Research Process
This research process stems from the six constituents of research as described by Bryman (2013). These fundamental aspects are to select an area of interest to study and to identify its topic of research. To sketch out the research approach and formulate a research design. And finally, to collect and analyze data and thereafter present the findings. As these points were adopted, each one correlates to at least one chapter of the thesis. The research process itself evolved in duality. In one way its formation was linear, following the steps as described. These constituents were decided to be included from the start and the issue the company was facing was known to a general level. This means that the area of interest, the topic of research and so on was decided upon early in the research process. However, alongside the practical steps of the study such as the empirical data gathering, a review of literature was conducted. This constant feed of new information from both the practical side and the academic side helped to
identify a research gap and thereby a way for the author to narrow in a focal point of the study. In this regard the process had more of an iterative nature.
2.3. Research Design
The literature describes the process of research design as the creation of a logical plan to get from an initial set of research questions to a set of corresponding conclusions (Yin, 2013). This is traditionally accomplished by adopting one or several research methods, which refers to the use of technique for data collection and data analysis (Karlsson, 2009). As highlighted in the introduction, the literature has a knowledge gap and thus falls short of adequately
answering the research questions of this thesis. Hence, a case study approach was chosen. A case study is often preferable when thoroughly investigating a phenomenon within its natural context or when testing the applicability of a general theory to a specific situation (Yin, 2013). Both have certainly a level of applicability in this case. This choice is further justified for the following reasons. Firstly, the findings can lead to novel insights and secondly the relevance of the findings for practical use is strengthen as these stems from a practical case in the first place (Karlsson, 2009). A literature review was also conducted with the intent to align the
perspective of the researcher with established findings, as to tie the analysis of empirical data and the conclusions close to the established findings. In addition to these two defensive aspects, the review of literature also served to establish a context for the study, as well as to identify a research gap. This study draws on empirical data from a manufacturing company. The choice of company is motivated by the opportunity to study simulation-based PSD. The use of
simulation is motivated by the system complexity in the introduction chapter but an additional reason for its presents in this study, is that it aligns with the overall objective of the study.
2.4. Data collection
Regarding the empirical data collection both primary and secondary data sources were utilized. From a chronological view, the primary aim of the data collection in the initial stages of the study was to ensure a thorough understanding of the problem that the company faced. This required comprehensive knowledge about the production system. This knowledge was acquired via a mix of presentations and meetings with experts and first-hand observations. During these observations, questions were asked to shop-floor operators about the details of each station. The path of a high-volume product was followed through the production line step by step and a flow chart was used as a map and often as a point of reference when posing questions. Notes were taken on first reflections and later revisited in a daily diary. In parallel to this activity the problem was defined collaboratively with key persons. Additionally, a weekly meeting was held with key staff members ensuring good communication and understanding.
2.4.1 Literature review
As a parallel activity to the more practical work, a review of literature was made. The literature was found by searching in Scopus database, with access granted by Mälardalens University. The literature in question mainly spanned the field of Production System Development and Simulation, but also covered some work covering implementation of modularity in product design and its implication on production systems. The various keywords used were: Discrete Event Simulation, Modularity, Production System Development, and Simulation. These
keywords were used in isolation or combined in different ways using the “AND”- and/or “OR” function. The results were filtered as to limit the results to only include peer-reviewed articles from journals, books or publications from scientific conferences in the field of engineering.
The language filter was English and the year of publication to no later than the year 2000. The findings were then sorted either on citation count or on the publication date. The process of selecting sources was then to read the titles of the results, if a title seemed to fit with the subject then the source abstract was read. If the abstract was interesting, then the introduction was briefly read as a final step. Additional sources were later found through snowballing from the original results. Other minor searches for literature were also made as to acquire information regarding minor subjects or to read up on various research methods.
2.4.2 Simulation Approach
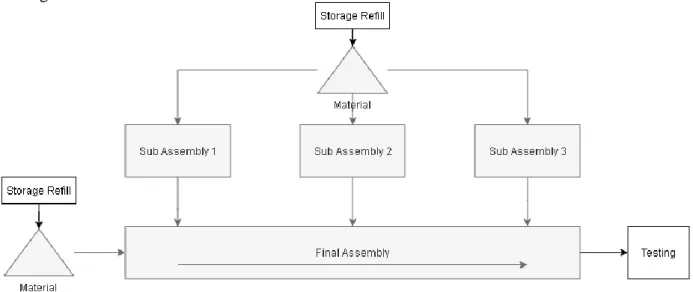
As for the choice of simulation approach, it followed the method proposed by Banks et al. (2004), see figure 1. This methodology has a somewhat stage-gate nature, but it is however not a truly rigid stage-gate process as there are occasions when the problem must be reformulated later on in the study as new knowledge is gained (Banks et al. 2004). This kind of new
knowledge acquired in the process thus serves to validate (or reject) the decisions made in the earlier steps of this process. One such example of an event where that might occur is that in the case of the conceptual model (CM) (Law, 2009). Other simulation methodologies were also considered. For a continued discussion on simulation approaches se the associated chapter in the frame of reference.
Figure 1 Simulation procedure according to Banks et al. (2004)
Step 1 Problem Formulation
According to Banks et al. (2004) each simulation project must start with a problem
formulation. In this study, the process of problem formulation began before this thesis even started. It began as a dialogue between the company and a DES professor at the university. The professor met with the company on several occasions discussing the issue at hand. This
resulted in a thesis specification draft, which was presented to the student at the end of November 2019. Although not completely covering all of it, this document related to the first two steps of the process proposed by Banks et al. (2004) and was also used as a foundation for the development of the third step in the procedure. This document, along with a visit by the author, prior to the project start, also ensured some general knowledge of the problem prior to the project start, shortening the time spent on this first step during the project.
The information presented in the specification document was as following:
The company name as well as contact information to a contact person at that company. Problem of interest, as stated by decision maker: To analyse the performance of the existing main line robot assembly and sub-assemblies including forecasted demand of XX yearly robots for 20YY including ZZ new products. Additionally, included in the document was stated the overall objective of the study, the specific questions to be answered, performance measures for evaluation, suggestions of data collection, model assumptions and a vision of a solution.
Step 2 Setting of Objectives and Overall Project Plan
As mentioned in the previous section, a specification draft of the project made prior to the project start, related somewhat to the first steps in the modelling method. In this second step it outlined what specific questions there were to be answered in the project. It also started the conversation whether or not a simulation is an appropriate methodology for this problem in general and discrete event simulation in particular. According to Robinson et al. (2010a) one ought always to employ the easiest method, that fulfil the necessities of the problem. The determining factors for the decision of simulation approach were fidelity, time, cost and
simplicity (McGinnis & Rose 2017; Robinson 2010b). Taking these into consideration the best fitting approach was deemed to be DES, as it is most able to replicate the complexity of the real system. It also happens to be the approach most known to the student, thus decreasing cost and time. Regarding the choice of software, the company had no inputs or restrictions and it was thus open to the student who choice Extendsim 10, due to its availability to the student and its prior experience with that software.
Step 3 Model Conceptualization
The next step was making the Conceptual Model (CM). This stage was also made in parallel to the initial data collection. The background to the necessity of the CM is that it is almost never desired to attain a one-to-one mapping between the model and the real system, but rather that the essence of the real system is captured (Banks et al 2004; Robinson 1994). As mentioned in the first step, this was grounded in the problem formulation and the specification document. Derived from that document was the overall objective of the study and specific questions to be answered. Performance measures for evaluation and proposed data to be collected was also extracted, along with model assumptions and a vision of a solution, as these happen to be the fundamental ingredients in the CM (Skoogh 2012).
The process of making the CM was iterative. The first iteration of the CM was constructed based on the information in the specification document with additional input suggestions from
the analyst to infuse new perspectives, ensuring that the final iteration would have high credibility for validation purposes. After meeting decision makers, it was revised and later reintroduced to ensure consensus on the content, mission & boundaries of the simulation. An iterative design process is such as this is recommended by the literature and it helps to ensure a good level of model fidelity and user confidence to the model (Banks et al. 2004). “Good” in this case, means to hit the sweet spot of detail resolution and categories of data to maximize the ratio of fidelity to cost, so that the model is trustworthy enough to answer the questions in a satisfying way without becoming too expensive (Banks et al. 2004; Sargent 2013). The resulting CM can be seen in figure 3, figure 4 and figure 5.
CMs are often quite abstractly defined as to their appearance or format. As illustrated in these figures, the CM was made in multiple formats, each to correlate to a specific objective. The first iteration of the CM featured the inputs, outputs, restrictions and assumptions. The starting point was to specify the objectives. These were derived from the thesis specification draft and validated with the company contact persons.
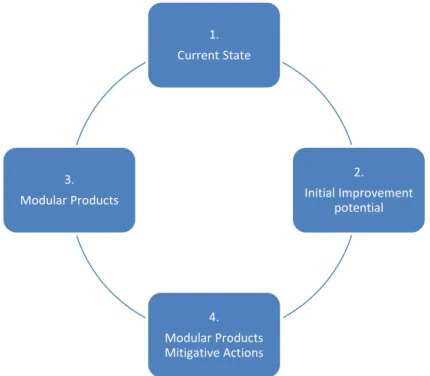
Modelling- and general project objectives
1. Show the impact of new products on the production system
2. Suggest actions to be taken in order to mitigate any negative impact By...
1. Simulating current processes and the robot assembly line.
2. Evaluating the consequences of new models, additional stations and different flow And answer...
1. What changes are needed to meet future output? 2. Buffer sizes, where are they needed and how large? 3. Bottle necks, where they are and if they change? 4. How is the output affected by the product mix?
Beginning with the first draft of the CM, the first step was to specify the desired delivery of the project in general and the model in particular, to design the assumptions and simplifications of the model and mark out the input factors to be considered. At this initial format, the CM essentially constituted lists of suggestions for these categories. This was displayed to the contact persons at the company and subjected to revision. This was repeated in an iterative process until a consensus was reached and no new information was discovered, nor any new decision made. In this way the CM also served as a point of validation for the two prior stages of the Banks method, while adding new specifications for the project. After feedback from the university supervisor, dependence lines were drawn between the model inputs and outputs. The next part of the CM was to map out the scope and the level of detail of the model. This was done by making figure 3 and figure 4. This step was also then validated by the company contact persons.
Figure 2 Conceptual Model, Inputs & Outputs, Assumptions & Simplifications
Figure 3 Model Content, Scope. Areas shaded grey are included.
Step 4 Data collection
As Shannon (1998) states, there is a relationship of constant interaction between the model construction and the need for input data. Hence, the initial data collection was thus based on both the set of objectives and on the conceptual model. The complexity of the required model was further revealed as the next step, model translation, began. This highlighted the need for additional data as well as the need of a higher resolution of detail in some. It is recommended to start the data collection early due to its time-consuming nature. It is however, also
recommended to continue the data collection process well passed the start of the model translation stage, in order to collect data for validation and verification purposes (Banks et al. 2004). It is also recommended to be extremely thorough with data collection, as the output of any simulation model will always be limited by the quality of input data (Chung 2004; Shannon 1998). Building on these recommendations, the data collection process played out according to the following description.
To start with an up to date flowchart of the production system mimicking the layout, process flow and number of stations was granted and described to the analyst. Additionally, the
flowchart considered the differences in flow for each individual product and revealed takt times for the flows. This was followed up with gemba observations so that the analyst would receive first-hand experience of the flow. Notes were taken during these observations and questions were asked to the operators to ensure an early understanding of the processes. This was however not aimed to be used as input to the simulation as the company had already collected such data via video when collecting cycle-times prior to this study. This part of the data collection only aimed to increase fidelity levels early in the model translation step and the analyst had the option to go on further gemba walks later on, or to watch those videos to mitigate any uncertainties. Various product information data was also granted such as variant types and their subsequent cycle-times along with any potential set-up-times. This data had previously been collected for other purposes but was deemed accurate enough for the
simulation implementation. As mentioned above, it was filmed how workers operated and the ensuing cycle-time (and occasional set-up-time) was based on an average of such observations. To also increase the fidelity to real life, the simulation features a triangular distribution of cycle-times rather than the mere average. Disturbance data on stations, such as mean time between failures (MTBF) and mean time to repair (MTTR) was also transferred from previous documents. A triangular distribution was applied to these values as well. The last two sets of data that was collected was the historical record of the previous year and the number of operators. Historical data, such as system throughput per product and the total time of production served to verify the simulation model and the number of operators per shift and station as well as any eventual overtime served as additional ground for an investment/cost analysis.
Step 5 Model Translation
The process of model building began with designing a copy of the flowchart. This had the intent of introducing a notion of familiarity with the model to the production experts as to ease their participation in the validation step as they were already familiar with the flow chart. A second reason for this was to meet the delivery criteria set in the CM, that the model should visually represent the layout of the production system. As the extendSim software is block oriented rather than animation oriented, the use of hierarchical blocks was adopted as much as possible to hide much of the logics operating in the background. The model was continually tested throughout the building process. While bug fixing, the model builder first tried to isolate the problem to locate it. If initial measures to fix the error failed, then a new model was made to emulate that logic in isolation, thus revealing its properties in greater detail. A warmup time
was also added as to start the measuring process when the virtual factory had reached a state as close as possible to the starting point of the real-world reference for the time period used for verification. The company expressed a desire to keep using the model after the study had been completed. To accommodate this wish, the model was designed such that most input variables could be tweaked in an excel sheet for easy input of data.
Step 6 Verified?
The verification was mainly done by measuring the model output. The key value with which the model was verified with was the total production output over a given time. The reasoning for this was that if all the inputs and assumptions as well as limitations correlated with the real-world case, then a matching output would indicate high fidelity. This might seem like a big assumption to make, but it is also true that the model output is merely a product of the inputs, assumptions and simplifications, so it cannot be made to work the other way around. The desired outcome of the verification stage was not matching numbers alone, but to achieve these numbers in a way that as closely as possible resembled the real production system. The output value was therefore not the only value determining the degree of model fidelity in the
verification stage. The input values were carefully considered and some of the assumptions and simplifications were briefly tweaked. Among the changes were the disturbance data and the number of manned workstations. This was done since the overall objective of the simulation model mainly translated to the potential of the production line, whereas the verification stage required similar conditions to the real-world reference of the historical data. To ensure the correct understanding of each of these parts and steps validation was critical.
Step 7 Validated?
Validation of the simulation model was carried out alongside its development. This was mostly done by continual weekly discussions of the project process in general and the simulation model in particular. A common occurrence in this process was the realisation that there were some rules for the system, well known to the production experts, but less obvious to the student. This realisation then cleared up any uncertainties. As mentioned in the prior section several assumptions and simplifications and some input values had to be changed to attain a good verification. This change in model scenario allowed for deeper understanding of the production system rules as new views were elevated on its constituents.
Step 8 Experimental Design
As with the general approach of the research a defined target was set at the initial stages. As time went on, a need for higher resolution target arose and the team therefore had continual discussions during the weekly meetings on what the experiments ought to attain and what scenarios to be tested. A final meeting was then held just prior to the start of the experiments. The experiments had a twofold objective. One was to relate to the research questions of the study. The other one was to bring any additional benefit to the company as they desired to fully exploit the utilisation of the model. One focus of the experimental scenarios was therefore to study effects of a change in product mix. This was deemed important for the study as it correlates to the research questions: “What consequences in terms of buffer sizes, bottlenecks
and overall output, can occur when adding new products into a production line?” and “What changes are needed to mitigate any negative disruption the new products might cause to the output?”. Both of these were addressed by analysing this. The other focus was to answer
specific questions that the company wanted answers to. These related to production planning as well as studying the effects of possible investments. Each simulation scenario was run with 50 iterations to ensure higher overall fidelity.
Step 9 Production Runs and Analysis
Each simulation run exported data to an excel sheet were information about the simulated production could easily be accessed by the model builder as well as the production experts. This could then be analysed to draw conclusions on the fallout. The level of workstation utilization showed for example the level of likelihood of it being a bottleneck. This process was continued until all experimentation was completed.
Step 10 More runs?
The number of runs were limited due to time constraints and eventually seized as new runs ultimately generated limited amounts of new information.
Step 11 Document Program and Report Results
Banks et al. (2004) states the need for two types of documentation as: program and progress. The model was also intended for future use by the company post research and thus user instructions were added continually during the building process. Understanding of how the model operates can increase the level confidence in it. It also positively affects the possibility of making future modifications to it. Documentation of this sort was also made to the
accompanying excel-sheets as these housed the input and outputs. The progress documentation was made in personal notes and later included in the research report.
Step 12 Implementation
The implementation stage falls somewhat outside of the research scope. Still, as beneficiaries of the model the company could utilize the model to this extent in their future PSD activities.
2.5. Data analysis
The process of data analysis consists of organizing and exploring the collected data. The data analysis was a process conducted incrementally and simultaneously as data was collected. Data was collected continually in the three stages of the project, the design phase, the build phase, and the experiment phase. In the design phase data was collected with the purpose of creating knowledge about the problem. This was done both through the literature review to gain an academic perspective, but also through constant interactions with the production system and key staff members with insights of it, to gain a practical perspective. These two perspectives were then joined in personal notes and in discussions with supervisors and peers from both the company and the academia, which were also documented in a diary. In the build phase, new knowledge was collected with the same intent. The building process revealed knowledge gaps about the production system. Once reviled, they could be filled. The academic search now shifted from the use of PSD and simulation to simulation methodologies and recommendations and later to encompass modularity when this was identified as one of the core themes of the study. In the experimental phase, only empirical data from the simulation model was of interest. This was used in verification and validation purposes and later the same kind of data was utilized to draw research conclusions.
2.6. Quality of research
The chosen research strategy and methodology carried with them challenges which had to be recognized and mitigated in order to ensure a good research quality. Starting with the strategic element, collaborative research. A common criticism of this approach is that the partnership between researchers and practitioners threaten the trustworthiness of the results. This is due to the risk that the researcher loses a degree of objectiveness and becomes more subjective as empathy for the practitioners grows and practical contribution outweighs the academic one (Ellström 2008). To balance this, the author at times had to distance himself from the company to allow for a greater degree of critical thinking. Meanwhile, a common critique of the case study approach mainly relates to the relatively small sample size often associated to case studies, which is certainly a viable criticism in this case were a single production system is studied. These drawbacks range from the risk of misjudging a single event, to a limited ability to generalize the findings (Ahlskog et al. 2017; Yin, 2013). The literature review was therefore conducted with the intent to mitigate these issues by aligning the perspective of the researcher with established findings and tie the analysis and conclusions closer to the established findings. Research quality itself is commonly measured from the point of view of validity (concerning the process of measurement) and reliability (concerning the accuracy of the measurement) (Karlsson, 2009). Reliability and validity were not only two concrete steps in the process of making the simulation model, but a constant process in the data collection and analysis. Consider for example the cycle time data for each possible combination of product and
workstation, which was provided by the company. Secondary data such as this was used due to time and cost constraints. Nevertheless, the data collection method for this was taken into consideration. In this case the data was extracted from a tool that analyses and processes video footage from the assembly process. While accurate (implying high reliability), the method of capturing cycle times with video footage can suffer from the Hawthorne effect, that workers tend to over deliver (implying lowers validity) when monitored (Martin et al. 2019; Robinson 2004). To mitigate this effect, the footage had been broken down into smaller segments and analyzed with the methods-time measurement method and standard allowed minute method. This way the tool produced a standard time for each step in the work process. The cycle time value was later multiplied by two factors to create a triangular distribution. No simulation model is fully accurate and there might be a risk that input deviations could either be multiplied or cancel one another out. The second neither of those outcomes could be considered “good enough” to draw conclusions from, as both validity and reliability account for the quality.
3. Frame of Reference
This chapter presents the foundational body of theory on which this study builds. This entails an introduction to production systems and production system development, followed by the topic of simulation in general and the application of discrete event simulation in the context of production system development in particular. A sub-chapter on modularity is also included as PSD not only encapsulates production systems exclusively but additionally include the aspect product development as they symbiotically affect one another.
The purpose of this chapter is to bring forth the fundamental knowledge required for the decision-making and conclusion-drawing in this thesis. This will allow other researchers to affirm or discard the conclusions drawn in this work to a more profound degree in accordance with proper scientific practice. These subchapters were chosen due to their relevance to the theme of this research. These are deemed essential to understand practical problems stated, an in alignment to the objective conjure a reply to the research questions in a satisfying way in conjunction with the empirical findings. Regarding the choice of topics in this chapter it is motivated for these reasons:
1. The nature of the research background as described in the introduction chapter is a lack of literature on which to base the tactical decisions on how to best implement modular products into a production system. This requires knowledge about production systems and about modularity in product design.
2. To satisfy the objective of the study, adequate knowledge about production system development and simulation is required. This is because the objective partially relates supplying practitioners with input on how the behavior of the production system might change, due to the new products. Furthermore, the objective also relates to the academic research gap on the relation between production and their corresponding products regarding modularity and the applicability of simulation in this regard.
3.1. The Production System
Production can be defined as a hierarchical subset of manufacturing, were manufacturing allow for production by including symbiotic functions such as design, sales and shipping (CIRP 1990). Production in turn, is the process or act of physically making a product from its fundamental parts (CIRP 1990). There are essentially two types of production operations: fabrication and assembly. In fabrication operations, a work material is processed, or
transformed, to a more advanced state of completion. Whereas in assembly operations, multiple parts are joined to form a new entity (Groover, 2014).
A system can also be defined in a hierarchical way. Hubka and Eder (1988), defines a system as a finite set of constituents that are bounded to each other by a relationship and to their immediate environment to form a whole. Therefore, when combining the words “production” and “system” it implies a physical system with the potential to transform items (Ahlskog, 2017). Hence, a production system can be defined as the collection of elements arranged to accommodate this process. This system perspective on production endorses a holistic
a system can escalate along interconnected elements in complex ways, something that must be considered during its design and development (Mourtzis 2019; Robinson, 2004).
3.2. Production System Development
The development of production systems is widely recognized as a valid long-term strategy to increase competitiveness (Bellgran & Säfsten, 2005). The PSD concept encapsulate both the development of current production systems and the design of entirely new ones (Bellgran & Säfsten, 2010; Jonsson & Mattson, 2003). Another definition of PSD has more of a product-oriented aspect. It renders that successful PSD involves the pursuit of product development as a means to optimize the value-added events in production (Brettel et al. 2014). PSD can therefore be seen as a continual strive for optimizing development processes of both production and product design (Bellgran & Säfsten, 2010; Sivard & Lundgren, 2008). This is done in
accordance with the theory of constraints, which state that a flow is restricted by its narrowest section (Liker, 2004). The improvements can range from the incremental ones to the more radical changes and are most effective when made to exploit that constraint (Elg et al. 2007). These more significant investments of capital in PSD activities attest to the level of impact it is believed to have as a long-term business strategy (Wiktorsson, 2000). While the continual incremental changes attest to the limited ability to mould the system once it is operational (Bruch, 2012). As production systems become complex buffer storages are often added between processes to even out the flow, although this also carries the risk of hiding any
problems and more WIP products tie up additional capital (Liker, 2004). The process of PSD is made possible via a structured application of techniques and tools, aimed to identify and
mitigate variation and waste in these processes (Bellgran & Säfsten, 2005; McLean et al. 2017). Minor PSD activities commonly target operations such as material handling, assembly, or fabrication processes by equipping or optimizing machines, operators or robots with more effective resources, such as tools and skills (Sivard & Lundgren, 2008). While major PSD projects can change the entire topology of the production system (De Lit & Delchambre, 2003; Jonsson & Mattson, 2003). As mentioned previously, the system-perspective is of great
importance in PSD activities, as all operating variables are interconnected and should be evaluated before acting (Jonsson & Mattson, 2003). The literature additionally states that a holistic perspective, not only represents another layer of hierarchical abstraction but requires detailed insight in each sub-process of production (Bruch & Bellgran, 2014; Rösiö & Säfsten, 2013; Wu, 1994).
The academic literature has mapped out the process of PSD to four major phases (Schuh et al. 2009), which is applied in an iterative, yet stage-gate fashion (Flores-García, 2019; Rösiö & Bruch 2018). These are: an informal start, followed by a pre-study and a conceptual design, which is worked through into a detailed design. Andersen et al. (2017) argues that recognizing and planning this process is the first of four fundamental guidelines to ensure successful PSD and that a holistic perspective, a long-term perspective, and a designated project organization are also necessitated. Understanding PSD as a process enables the practitioner to map out the actions needed for its successful execution (Flores-García, 2019). Visualizing the result for instance, has shown to mitigate organizational confusion of PSD implementations (Lindskog et al. 2012).
As the second guideline and a reoccurring theme in this chapter, the holistic perspective is widely endorsed in the literature and motivated as to lower the risk of sub-optimization or to give preference to one element over the others (Rossi et al. 2019). Additionally, a holistic view is argued to also increase the consistency in PSD projects (Hubka & Eder 1988). The third
requirement, a long-term view, relates to the financial and market situations, which must be taken into consideration to ensure the economic feasibility of the PSD project (Miltenburg, 2005). As a long-term strategy, PSD is sensitive to a wide array of factors from the market. Location of production, future product portfolios and other strategic plans ought to align with any investments in PSD (Andersen et al. 2016). These can be categorized as internal and external factors. As a PSD solution must conform internally, with the work schedules,
equipment and available logistics, while also externally, that same PSD implementation must conform to the supplier performance, flexible costumer demand, competitors, regulations and overall market performance. The degree of tactical positioning in regard to these factors greatly determines the system performance of the production (Flores-García, 2019). One such
important factor to consider in PSD is the notion of internal data acquisition in the production system. The ability to collect data from production systems has been highlighted as a
foundational benefit to future PSD activities (Bellgran & Säfsten, 2010; Bruch & Bellgran, 2014).
Regarding the fourth guideline, the main ingredient in a good project organization is a cross functional team with close ties to equipment suppliers, since such a team can ensure a
combination of particular skill set yet also allocate a broad understanding (Sjödin et al. 2011). Another organizational aspect of PSD is capability of the wider organization to accept and adapt changes in the production system. Effective PSD advocates within such organizations may ensure continual stability during PSD implementations (O’Connor & McDermott 2004).
3.3. Simulation
As good PSD practice requires standardized tools, the choice of said tools is an important step in the process (Bellgran & Säfsten, 2005; McLean et al. 2017). When evaluating the success-factors, the holistic perspective requires a tool that considers the variations, interconnectedness and complexity that is associated with systems (Hubka & Eder 1988; Robinson, 2004). An approach that has proved to facilitate these aspects is simulation (Robinson, 2004). Simulation can be defined as a simplified imitation of a system progressing through time (Banks, et al. 2004). Although there are several branches of simulation it is not only important to decide about the appropriateness of simulation, but then also to motivate the choice of simulation approach. To adhere to this, metrics ought to be chosen, by which simulation characteristics can be based. McGinnis & Rose (2017) argues that there are three such metrics that greatly impact the choice of simulation approach: time, cost and fidelity. Robinson et al. (2010)
complements this, expressing that one ought always to employ the easiest, quickest or cheapest method that gratifies the required levels of these metrics. As for the choice of simulation tool, there are three fundamental options. These are time-slicing simulation (TSS), discrete-event simulation (DES) and continuous simulation.
The TSS approach is the simplest of these and it is based on a constant step. This time-step can be understood as the model “resolution”, meaning that the simulation only represents changes during those steps. However, it is difficult to choose an appropriate time-step that ensures a good balance between fidelity and performance. When taking the resolution of a TSS model to the extreme it can be described as a continuous simulation. Continuous simulations are good for modelling fluids and other continuous flows but fit rather poorly to the
circumstances relating to this case study. Like the TSS approach, DES only simulates at certain times of the process. However, in DES those times are not predetermined by the time itself, but by the processes. Hence, it is therefore only the changes of the system that is represented, the system is thus modelled as a series of events (Robinson, 2004). And so, the DES model can be
defined as the representation of a system, spanning a specific amount of time and where variables change during events (Law, 2015). There are several DES approaches such as the event-based, activity-based, process-based and three-phase approaches (Pidd, 2006). Although this level of detail is “hidden” within the simulation software and the study of these are thus outside of the scope of this report.
Choosing Simulation Method
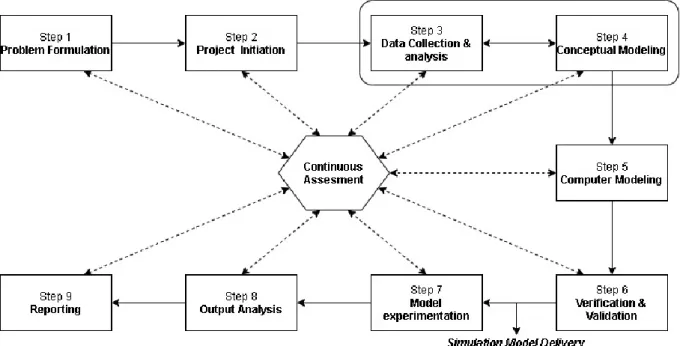
There are multiple simulation methods in literature which describe how to conduct a simulation study (Altiok and Melamed 2007; Balci 1990; Banks et al 2004; Carson 2005; Chung 2004; Fishman 2001; Hlupic and Robinson 1998; Kelton et al. 2015; Law 2007; Law 2009; Martin et al. (2019); Nordgren 1995; Robinson 2004; Rossetti 2010; Shannon 1998; van der Aalst 2015). Martin et al. (2019) noted that most of these have strong resemblances and minor differences of each other, which is also confirmed by Skoogh et al. (2012). Martin et al. (2019) also noted that even though this is the case, they yet seem to have been constructed in isolation without regard to the position and design of the other ones. This observation then led them to create a new method based on a critical analysis of the methods of Altiok and Melamed (2007), Balci (1990), Carson (2005), Chung (2004), Fishman (2001), Hlupic and Robinson (1998), Kelton et al. (2015), Law (2007), Law (2009), Nordgren (1995), Robinson (2004), Rossetti (2010), Shannon (1998) and van der Aalst (2015). As illustrated in figure 5 the Martin (2019) method divides the process in 9+1 steps. Three aspects of it are found to be considerably noteworthy. Firstly, there is an ever-present focus on the perspective of continuous assessment at each step of the process. Secondly, is the highlighted link between the data and the conceptual model, as these help to affirm and validate one another. Thirdly there is an option between step 6 and 7 to deliver the model. This serves to take the different purposes of the simulation modeler into account. Martin et al. (2019) additionally explain each step in a detailed way.
Figure 5 Alternative Simulation Approach, as suggested by Martin et al. 2019
These observations are considered to be the strongest points to this model and the insight of Martin et al. (2019) in the simulation model is highly recognized by this author. Yet, it does pose a strictly stage-gate process flow, leaving no choice for going back a step to reconsider
earlier decisions due to the introduction of new knowledge (with the possible exception of continuous assessment), a common complaint of stage-gate models, made by agile project advocates (Chin 2003; Layton & Ostermiller 2017; Paquette & Frankl 2015; Thomas 2011). It also puts the data collection and analysis ahead of the conceptual model despite that the fact that one of the main purposes of the conceptual model is to make clear what data should be considered useful and vital to the model (Law 2009; Robinson & Brooks 2010). The modeler therefor runs the risk of collecting useless data that does not serve the aims of the simulation model. Even though there admittedly is a recognized interplay between these two steps in the Martin model, the cart is placed before the horse in the view of this student.
Therefore, due to these reasons, the choice of simulation procedure in this study is the one proposed by Banks et al. (2004), se figure 1. This methodology has a somewhat stage-gate nature, but it is however not a truly rigid stage-gate process as its creators also state that there are occasions when the problem must be reformulated later on in the study as new knowledge is gained (Banks et al. 2004). This kind of new knowledge acquired in the process thus serves to validate (or reject) the decisions made in the earlier steps of this process. One such example of an event where that might occur is that in the case of step 3, the conceptual model (CM). As Law (2009) writes, this is also one of the fundamental objectives of the CM. What Banks et al. (2004) model is lacking, compared to the one proposed by Martin et al. (2019) is the notion of continual assessment along with a somewhat lesser detail in its description for the individual stages. Recognising this, the Banks model is never the less the model of the choice for this study.
3.4. Discrete event simulation in Production System Development
With its great computational capabilities, DES has become a powerful tool for decision-makers in both strategic and operational choices (Uriarte et al. 2018). In fact, it is one of the most common ones used to this end (Jahangirian et al. 2010), due to the existence of user-friendly software (McGinnis and Rose 2017). In strategic decision-making, DES can aid in solving logistical issues or analysing what-if scenarios (Robinson et al. 2003; Uriarte et al. 2018). Examples of operational decisions commonly solved with DES, these can for instance be optimizing cycle times, throughput or batch-sizes (Bokrantz et al. 2018). As a tool for PSD the main potentials are identified as: bottleneck identification, inventory management in internal logistics, layout changes, previews of investment proposals, production planning and resource management (Skoogh & Johansson, 2008; Skoogh et al. 2012). The literature has extensively documented the use of DES in PSD. DES models can be both qualitative and quantitative in nature, with quantitative ones being predominant when supporting decision-making in PSD (Negahban & Smith 2014). The challenges of DES mainly stem to developing the simulation models in general (Flores-García, 2019) and infusing them with trustworthiness in particular, as this is fundamental to support decision-making (Fowler and Rose 2004). There is also a strive for making simulation models more effective to design, both in terms of time and of cost (McGinnis & Rose 2018). High longevity models would spread out the costs, however simulation modelers find it difficult to design cost effective and reusable models as model fidelity falls with time, without continually updated input data (Ahmed & Shah 2015; Skoogh et al. 2012; Wang & Chatwin 2005). It is therefore common in simulation modelling to design cheaper more focused simulation models, aimed to answer one (or few) specific question(s) (Ahmed & Shah 2015; Robinson 2008).
3.5. Modularity
As stated in chapter 1.2, the concept of modularity has seen wide implementation in industry, particular within the automotive sector (Salvador, 2007), as it seem to strengthen the financial performance of the companies that are implementing it (Worren et al. 2002). At a fundamental level, the concept of modularity describes a hierarchically nested system (Jacobs et al. 2011). In the context of products, Jacobs et al. (2011) states that a modular product entails several standardized units or subsystems called modules, which can be configured and combined into a wide array of end products. Hence, modular products are designed such as to allow for such a combinatorial feature (Chang & Ward, 1995). This is a strategic decision made in the early phases of product design that have profound implications for manufacturing operations (Jacobs et al. 2011).
To begin with these implications that product modularity means that subsystems can be tested prior to assembly (Salvador, 2007). Another effect is on fixtures and tools in production, which can be rationalised, meaning that the same tool can be used for multiple products, thus reducing production costs (Lai & Gershenson, 2008). However, the greatest impact can be seen in the assembly processes as modularity simplifies assembly and disassembly operations (Gershenson et al. 2003; Marinin & Davis, 2002). In fact, the entire assembly process can be adapted to modularity as components can be preassembled into bigger modules (Islamoglu et al. 2014). The benefits continue as modules also ease the product development by easing the updating of products and enables increased product variety from a smaller set of components, as well as simplifies the maintenance of those products (Ulrich and Tung 1991). Researchers additionally report that modularity can be credited to reduce the overall costs, the bill of material, time to market and overall lead times of products. Furthermore, higher levels of product quality and production flexibility can also be expected, due to the higher standardisation of parts, requiring less overall documentation combined with economies of scale (Gershenson et al. 2003; Kusiak 2002; Lorenzi & Di Lello 2001). On the other hand, when comparing the effects of production systems producing modular products to the ones producing integral products it was found that the modular approach resulted in a higher product flexibility, with the trade-off of having longer time to market with profound designs and thus a lower responsiveness to fluctuations in the market. While the traditional production system was better at reacting to market changes, it was prone to underutilization of resources (Paralikas et al. 2011). Seemingly contradicting findings point to a need for more case studies, specifically the path to successful
implementation is still somewhat uncharted (Frandsen 2017; Piran et al. 2020), as is also the interconnected relation between development in products and in production (Bruch & Bellgran, 2014; Piran et al. 2020).
4. Empirical Findings
This chapter outlays the results from the empirical data collection and the simulation model. These results are presented last in this chapter and is preceded by other sections that are devoted to give a context for these findings.
4.1. Company Information
The collaborative research in this thesis is made in conjunction with ABB Robotics. Robotics is a division of the ABB group and is a leading manufacturer and supplier of industrial robots. The robotics division have installed more than 400 000 robots around the world. Robotics have manufacturing plants in multiple locations around the world. The Swedish factory employ about a thousand people.
4.2. Introduction to Case Study
During the problem formulation at the early stages of the research project, the company specified their problem of interest regarding modularity to the following questions:
1. How will the output be affected by the new products? 2. What action can be taken to decrease any negative impact?
Additionally, three questions relating more generally to PSD were also posed. These were: 3. How does the product mix affect the output?
4. Where are the bottlenecks and what grave is their impact? 5. What is the optimal placement and size of buffers?
It was decided that a case study was to be made with the intent to analyse the assembly line for their larger robots. ABB also expressed a desire to for the research to involve a simulation model to better consider a holistic perspective and also grant the company a tool by which they can continue with further PSD activities.
4.3. Current Process
The products currently assembled in the production line could be classified as integral products, as they have mostly been designed in an individual fashion. That said, the products are still made from mostly the same fundamental parts regarding their function.
One example could be that all cars have wheels, although different models uses different shapes and sizes. It can therefore be assumed that the assembly process will stay largely the same for the new products as for the old ones, at least to the degree that they will be produced in parallel. There are eight (8) products that are assembled in the line and the 27 most common variations of these are considered in this study. There are fundamentally two different ways that a product can be specified according to customer needs. First there is the option of specifying if the robot will be specified for foundry or non-foundry environments. Then the costumer can specify the product for either for longer or reach or for greater lifting capacity. The exact topology of the production system is subject to confidentiality, however in a more abstract sense the assembly line consists of three sub-assemblies that feed a final assembly line, see figure 6.
Figure 6 Abstract Representation of the Assembly system
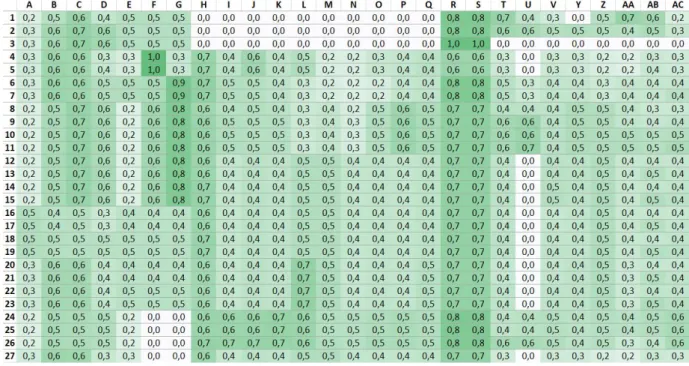
Each product can affect the production process in different ways depending on how the costumer deems to specify it. Production planning is therefore considered of great importance to achieve a good balance in the line. However, balancing the production can also be achieved with buffer storages between the stations as far as there is adequate space to allow for that. The assembly process of interest has a total of 27 stations. Since there are 27 product variations in total, the cycle times for these different stations can be mapped to a 27x27 cell matrix, see table 1. This complexity (compared to a strictly linear process with few product variants) makes it difficult to predict the impact of different placements and sizes of buffers without a simulation model. This matrix was however useful as to give a good visual indication of a good starting point. Darker colur or higher value indicates a higher cycle time. A buffer could for instance be placed after a potential bottleneck if this station had a big enough variation of process time between the products, thus allowing it some time to catch up. The identity of the workstations and the cycle times have been hidden in table 1 as these are subject to confidentiality.
Table 1 Cycle Time Matrix
4.4. Simulation Setup
The simulation model was made with the intent to study the maximum potential of the
production line. Therefore, the assumption was made that all operators were present and that no extraordinary event would occur. The operators would also not have any learning curve for the assembly process of new models. One modular product was introduced to the flow in the third and fourth scenario. The model was also simplified to the extent that material shortages of essential parts would not occur. Such disturbances were nevertheless represented in so far as their impact on station shutdowns according to the historical disturbance data available. As most workstations have aspects of manual work a triangular distribution of plus minus 10% was used to mimic the cycle time variations.
The simulation inputs of interest were:
• Product mix: number of products & product variants • Historical production volumes
• Number of stations in each sub-assembly
• Disturbances represented as time to failure (TTF) and time to repair (TTR). • Layout topology, including the location of current buffers and their sizes • Cycle times and process variations
To review the result of the models, some output values were closer inspected.
The key performance indicators (KPIs) that were deemed critical to monitor were the model throughput, i.e. the quantity of products produced, as well as the KPIs relating to the
workstation performance. The latter one is represented by the different states that a workstation could have. They are as following: idle, busy and blocked. In the idle state, the station suffers from material shortage, namely there is no work in progress (WIP) product to which work can be done. The busy state represents the time work is carried out on a WIP product and it is
Workstations
P
roduc
t var