Health Risk Assessment
of Perfluoroalkylated
and Polyfluoroalkylated
Substances (PFASs)
in Sweden
iSSN 0282-7298This report summarizes the outcome of a project with the purpose and aim to present new information and knowledge about possible environmental- and health risks of perfluoroalkylated and polyfluoroalkylated substances (PFASs) in the Swedish population and in Swedish biota.
ASs) in Sweden
Report
Environmental and Health
Risk Assessment of
Perfluoroalkylated and
Polyfluoroalkylated Substances
(PFASs) in Sweden
DANiEl BORG AND HElEN HåKANSSON
SWEDISH ENVIRONMENTAL PROTECTION AGENCY
Environmental and Health Risk
Assessment of Perfluoroalkylated
and Polyfluoroalkylated Substances
(PFASs) in Sweden
Internet: www.naturvardsverket.se/publikationer
The Swedish Environmental Protection Agency
Phone: + 46 (0)10-698 10 00, Fax: + 46 (0)10-698 10 99 E-mail: registrator@naturvardsverket.se
Address: Naturvårdsverket, SE-106 48 Stockholm, Sweden Internet: www.naturvardsverket.se
ISBN 978-91-620-6513-3 ISSN 0282-7298
© Naturvårdsverket 2012
Electronic publication Cover photos: Britta Hedlund
SWEDISH ENVIRONMENTAL PROTECTION AGENCY REPORT 6513
Environmental and Health Risk Assessment of Perfluoroalkylated and Polyfluoroalkylated Substances (PFASs) in Sweden
3
Förord
Denna är rapport är resultatet från en forskningsutredning som finansierats av Naturvårdsverkets miljöforskningsanslag.
Syftet med projektet var att ta fram information och ny kunskap gällande möjliga miljö- och hälsorisker av perfluoralkylerade och polyfluoralkylerade ämnen (PFAS) i Sverige.
PFAS en stor grupp av industriellt framställda kemikalier som förekommer utbrett i miljön och i människor globalt. Utmärkande för denna grupp av kemi-kalier är deras extrema motståndskraft mot kemisk och biologisk nedbrytning.
En sammanställning av exponeringsdata för olika PFAS i den svenska befolkningen samt en bedömning av möjliga hälsorisker förknippade med dessa saknas. Det fanns därför ett behov av en samlad kunskapsöversikt över miljö- och hälsorisker för PFAS baserad på svenska miljöövervakningsdata och tillgängliga effektdata.
Arbetet har utförts av doktorand Daniel Borg vid Institutet för Miljömedicin (IMM), Karolinska Institutet, i samarbete med Professor Helen Håkansson (IMM) samt Docent Bert-Ove Lund och Professor Nils-Gunnar Lindquist vid Kemikalieinspektionen.
Författarna svarar för innehållet i rapporten. Rapportens innehåll har genom Naturvårdsverkets initiativ och hantering granskats och kommenterats av oberoende experter inför färdigställandet.
Kontaktpersoner på Naturvårdsverket har varit Britta Hedlund och Tove Hammarberg.
Preface
This report presents the outcome of a project funded by the Swedish Environmental Protection Agency´s Environmental Research Grant.
The purpose of the project was to present new information and knowledge about possible environmental- and health risks of perfluoroalkylated and polyfluoroalkylated substances (PFASs) in the Swedish population and in Swedish biota.
PFASs is a large group of synthetically manufactured chemicals that during the last decade has emerged as a new group of contaminants with widespread global presence in the environment and in humans. Characteristic for this group of compounds is an extreme resistance towards chemical and biological degradation.
Concerning human health, a collection of exposure data for PFASs in the Swedish population is lacking as well as an assessment of possible health risks. There was therefore a need of an overview of environmental and health risks of PFASs based on Swedish monitoring data and available toxicity data.
The work was carried out by PhD student Daniel Borg at the Institute of Environmental Medicine (IMM), Karolinska Institutet, in cooperation with Professor Helen Håkansson (IMM) and Associate Professor Bert-Ove Lund as well as Professor Nils-Gunnar Lindquist at the Swedish Chemicals Agency.
The authors are responsible for the contents of the report. On the initiative and management by the Swedish EPA, the report has been reviewed and com-mented on by independent experts before completion.
Contact persons at the Swedish EPA have been Britta Hedlund and Tove Hammarberg.
SWEDISH ENVIRONMENTAL PROTECTION AGENCY REPORT 6513
Environmental and Health Risk Assessment of Perfluoroalkylated and Polyfluoroalkylated Substances (PFASs) in Sweden
5
Abbreviations
6:2 FTSA 6:2 Fluorotelomer sulfonate
AF Assessment factor
HÄMI The Swedish Health-Related Environmental Monitoring Programme
BMD Benchmark Dose
BMDL Benchmark dose at the lower 95% confidence interval
BMCL Benchmark concentration at the lower 95% confidence interval DNEL Derived No-effect-level
EtFOSA N-ethyl perfluorooctanesulfonamide LOAEL Lowest Observed Adversed Effect Level
GD Gestational day
LOD Limit of detection LOQ Limit of quantification
MOE Margin of Exposure
NOAEL No Observed Adversed Effect Level NOEC No Observed Effect Concentration
PFASs A collective term for all perfluoroalkylated and polyfluoroalkylated substances
PFOS-related
compounds A collective term for all precursor compounds that can be degraded to PFOS PFBS Perfluorobutane sulfonate
PFHxS Perfluorohexane sulfonate PFHpS Perfluoroheptane sulfonate PFOS Perfluorooctane sulfonate PFOSi Perfluorooctane sulfinate PFOSA Perfluorooctane sulfonamide PFDS Perfluorodecane sulfonate PFBA Perfluorobutanoate PFPeA Perfluoropentanoate PFHxA Perfluorohexanoate PFHpA Perfluoroheptanoate PFOA Perfluorooctanoate PFNA Perfluorononanoate PFDA Perfluorodecanoate PFUnDA Perfluoroundecanoate PFDoDA Perfluorododecanoate PFTrDA Perfluorotridecanoate PFTeDA Perfluorotetradecanoate PFPeDA Perfluoropentadecanoate PFHxDA Perfluorohexadecanoate PND Postnatal day
POD Point(s) of departure Ppb Parts per billion Ppm Parts per million
RCR Risk characterization ratio
SWEDISH ENVIRONMENTAL PROTECTION AGENCY REPORT 6513
Environmental and Health Risk Assessment of Perfluoroalkylated and Polyfluoroalkylated Substances (PFASs) in Sweden
7
Contents
AbbrEviATiOnS 5 SAmmAnfATTning 9 SummAry 12 1. inTrOducTiOn 151.1 Perfluoroalkylated and polyfluoroalkylated substances (PFASs) 15
1.1.1 Physicochemical and biological properties 15
1.1.2 Nomenclature 16
1.1.3 Uses and regulations 16
1.1.4 Sources of PFASs in the Swedish environment 17
1.1.5 Sources of human exposure to PFASs 17
1.1.6 Guidance values 18
1.1.7 Biomonitoring of PFASs in Sweden 18
1.2 Approach of the risk assessment 19
1.2.1 Exposure assessment 19
1.2.2 Hazard assessment 20
1.2.3 Risk characterization 21
1.3 Selection of compounds 22
2. HumAn ExPOSurE 25
2.1 Indirect exposure via the environment – Snapshot studies 25
2.1.1 Samples taken before 2006 (not considered for risk characterization) 25
2.1.2 Samples taken after 2006 (considered for risk characterization) 27
2.2 Indirect exposure via the environment – Temporal trend studies 28
2.2.1 Samples taken before 2006 (not considered for risk characterization) 28
2.2.2 Samples taken after 2006 (considered for risk characterization) 29
2.3 Occupational exposure 33
2.4 Exposure assessment results/discussion 35
3. EnvirOnmEnTAl ExPOSurE 36
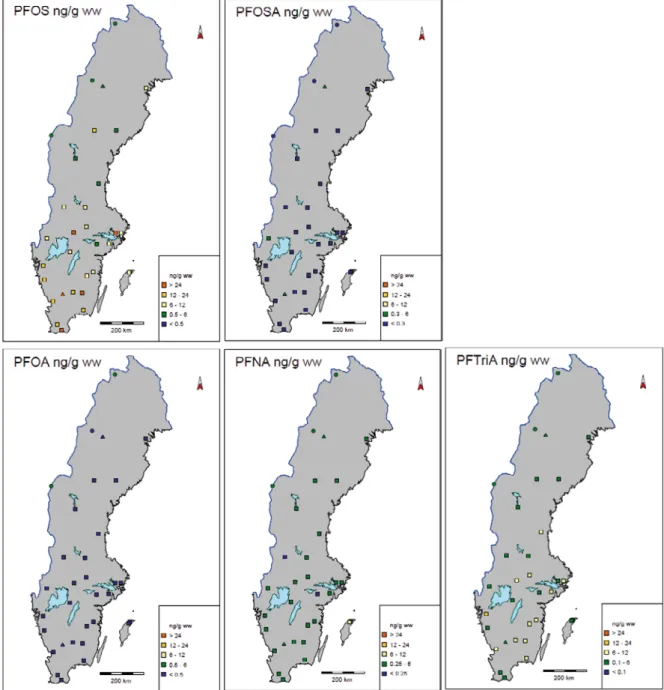
3.1 Snapshot studies 36
3.1.1 Samples taken before 2006 (not considered for risk characterization) 36
3.1.2 Samples taken after 2006 (considered for risk characterization) 38
3.2 Temporal trend studies 44
3.2.1 Samples taken before 2006 (not considered for risk characterization) 44
3.2.2 Samples taken after 2006 (considered for risk characterization) 46
3.3 Discussion/Conclusion 55
4. HumAn HAzArd ASSESSmEnT 56
4.1 Toxicokinetics of PFASs 56
4.1.1 Absorption 56
4.1.3 Metabolism 57
4.1.4 Excretion 57
4.2 Toxicity 59
4.2.1 Acute toxicity, corrosivity/sensitization, genotoxicity 59
4.2.2 Subacute, subchronic and chronic toxicity (incl. carcinogenicity) 59
4.2.3 Reproductive toxicity 59
4.2.4 Mode of action 60
4.3 Points of departure for individual PFAS congeners 61
4.3.1 Availability and selection of data 61
4.3.2 Points of departure for individual PFAS congeners 62
4.4 Derivation of derived-no-effect-levels (DNELs) 78
4.5 Epidemiological data 82
4.6 Hazard assessment results/discussion 83
5. EnvirOnmEnTAl HAzArd ASSESSmEnT 85
5.1 Toxicity to mammals, birds and fish 85
5.2 Points of departure for individual
PFAS-congeners 86
5.3 Hazard assessment results/discussion 98
6. riSk cHArAcTErizATiOn 100
6.1 Human health 100
6.1.1 Risk characterization results/discussion 104
6.2 Environment 105
6.2.1 Risk characterization results/discussion 112
7. cOncluSiOn 113
7.1 Human health 113
7.2 Environmental health 114
8. dATA gAPS And fuTurE rESEArcH nEEdS 115
9. AcknOwlEdgEmEnTS 116
SWEDISH ENVIRONMENTAL PROTECTION AGENCY REPORT 6513
Environmental and Health Risk Assessment of Perfluoroalkylated and Polyfluoroalkylated Substances (PFASs) in Sweden
9
Sammanfattning
Denna rapport sammanfattar resultatet av ett projekt för att ta fram information och ny kunskap gällande möjliga miljö- och hälsorisker av perfluoralkylerade och polyfluoralkylerade ämnen (PFAS) i Sverige. Projektet har utförts i form av en riskbedömning, bestående av en exponeringsbedömning med svenska monitoringdata för 23 utvalda PFAS i människor, däggdjur, fågel och fisk, en farobedömning med toxikologiska data på däggdjur, fågel och fisk för de utvalda ämnena och en riskkaraktärisering för människa, däggdjur, fågel och fisk. Detta är den första hälso- och miljöriskbedömningen som undersöker ett stort antal PFAS, individuellt och i kombination.
I den hälsorelaterade exponeringsbedömningen valdes två populationer ut – människor exponerade indirekt via miljön (dvs. allmänbefolkningen) och en yrkesexponerad grupp – professionella skidvallare. Exponeringsdata i form av PFAS-halter i blod och serum användes. Resultatet visade att de undersökta PFAS-kongenerna förekom i serum i låga ppb-halter (ng/ml) i allmänbefolk-ningen. I en liten subpopulation av allmänbefolkningen som ätit kontamin-erad fisk kunde högre ppb-halter av PFOS uppmätas. I den yrkesexponkontamin-erade gruppen förekom avsevärt högre koncentrationer av vissa kongener, t ex PFNA och PFOA som uppmätts i höga ppb- eller låga ppm- halter (µg/ml), ca 125 och 200 gånger högre än i den allmänna befolkningen. Tidstrendstudier i den allmänna befolkningen visade att halterna av PFOS, PFDS, PFOSA och PFOA i serum förefaller minska, medan halterna av PFBS, PFHxS, PFNA, PFDA och PFUnDA istället förefaller öka.
I den hälsorelaterade farobedömningen användes främst data och slutsatser från redan existerande faro- eller riskbedömningar, som kompletterades med nytillkomna eller andra relevanta data. Två toxikologiska endpoints som identifierades som gemensamma för PFAS användes: 1) levertoxicitet, och 2) reproduktions/utvecklingstoxicitet. För kongener som saknade toxikologiska data eller interndoser gjordes en ”read-across”, dvs. extrapolering av data, till den närmaste mest potenta kongenern för respektive endpoint. Andra toxiko-logiska endpoints som uppvisade lägre effektnivåer än lever- eller reproduk-tionstoxicitet beaktades också. Resultatet av farobedömningen visade att de olika PFAS-kongenerna var relativt lika avseende deras potens för lever- och reproduktionstoxicitet, med utgångspunkter (på engelska ”point-of-departure”) på 4–89 µg/ml serum respektive 4–> 60 µg/ml serum. Användbara toxiko-logiska data med interndoser fanns tillgängliga för 4 av 15 kongener i allmän-befolkningen och 5 av 17 kongener för de yrkesexponerade. För några kongener kunde ytterligare toxikologiska endpoints identifieras (immuntoxicitet, påverkan på bröstkörtelutveckling, fetma) vid väldigt låga effektnivåer – vid eller under nuvarande exponeringsnivåer för allmänbefolkningen. Epidemiologiska studier visade motstridiga resultat.
Riskkaraktäriseringen visade inte på någon risk1 för lever- eller
reproduktions-toxicitet i allmänbefolkningen, vare sig för enskilda kongener eller i kombi-nation. I den subpopulation som ätit kontaminerad fisk kunde däremot en risk för levertoxicitet påvisas baserat på uppmätta PFOS-halter. För de yrkes-exponerade skidvallarna kunde en risk för levertoxicitet identifieras, baserat på enskilda kongener och i kombination, samt för reproduktionstoxicitet baserat på den samlade PFAS-exponeringen. Det bör dock understrykas att denna grupp omfattar ett mycket begränsat antal människor i Sverige.
I den miljörelaterade exponeringsbedömningen valdes 5 arter/grupper ut med följande vävnadsmatriser: 1) säl (lever), 2) utter (lever), 3) fågel (ägg), 4) marin fisk (lever) och 5) högexponerad sötvattensfisk (muskel), baserat på förekomsten av PFAS i dessa arter. Alla dessa finns i, eller är kopplade till, den akvatiska miljön och visar på hur PFAS sprids till miljön. I de terrestra arter som granskades var halterna av PFAS signifikant lägre. PFOS var den domin-erande kongenern i alla arter och kunde uppmätas i låga ppm-nivåer eller höga ppb-nivåer i säl och utter, fågelägg och högexponerad sötvattensfisk, och i låga ppb-nivåer i marin fisk. I säl och utter kunde en nedåtgående trend för halter av sulfonater och en ökande trend för halter av karboxylater urskiljas. I ägg från pilgrimsfalk var alla uppmätta kongener långkedjiga och en tidstrends-tudie visade att nivåer av sulfonater var oförändrade eller nedåtgående, och att karboxylater med en kedjelängd av 11–15 kol minskar, men att PFNA och PFDA ökar. I marin fisk innehåll alla detekterade kongener sex eller fler kol för sulfonater, och nio eller fler kol för karboxylater, vilket troligen återspeglar den högre biokoncentrationsfaktorn (BCF) för långkedjiga kongener. PFAS-halterna var betydligt högre i högexponerad sötvattensfisk än i marin fisk.
I den miljörelaterade farobedömningen användes för säl och utter samma toxikologiska endpoints och utgångspunkter som i den hälsorelaterade faro-bedömningen, baserat på deras gemensamma toxikologiska dataunderlag, men med skillnad i de specifika kongener som undersökts samt att halter i lever användes som interdos istället för serum. Användbara toxikologiska data med interndoser i lever var tillgängliga för 4 av 17 kongener, varav data för övriga kongener behövde extrapoleras. För fågel togs enbart data från reproduktions-toxicitetsstudier med interndoser uppmätta i ägg i beaktande, vilka fanns tillgängliga för 5 av 15 kongener, varav de övriga behövde extrapoleras. Få relevanta studier på reproduktionstoxicitet av PFAS i fågel fanns tillgängliga, och i dessa kunde endast effekter påvisas för PFOS. Dataunderlaget på PFAS i fågel kan därför anses osäkert med avseende på toxiska effekter, effektnivåer och de extrapoleringar som gjorts. För fisk så fanns data tillgängliga för 5 av 17 kongener och toxiska effektnivåer och utgångspunkter bör betraktas som högst osäkra beroende på att olika typer av studier, arter, och endpoints har
1 Med ”risk” (engelska ”concern”) avses inte att det idag nödvändigtvis finns hälso- eller miljöproblem pga. av
SWEDISH ENVIRONMENTAL PROTECTION AGENCY REPORT 6513
Environmental and Health Risk Assessment of Perfluoroalkylated and Polyfluoroalkylated Substances (PFASs) in Sweden
11
använts, vilket gör dem väldigt svåra att jämföra mellan olika kongener. Dessa extrapoleringar är därför högst osäkra.
Resultatet av riskkaraktäriseringen för säl och utter visade på risk för lever-toxicitet och reproduktionslever-toxicitet för enskilda kongener och/eller i kombi-nation. Det bör poängteras att slutsatser gällande säl och utter är baserade på genomsnittsnivåer av PFAS vid den sista tidpunkten i tidstrendstudier, och att nivåerna kan vara högre på individnivå, vilket skulle resultera i lägre säker-hetsmarginaler. För reproduktionstoxicitet i fågel kunde en risk påvisas, där de högsta halterna i pilgrimsfalksägg (provtagna 2006) översteg de halter i ägg där en studie visat toxiska effekter, och där den genomsnittliga halten var nära de toxiska effektnivåerna. Det kan därför inte uteslutas att halterna av PFOS i dessa ägg kan ge upphov skadliga effekter. För marin och högexpon-erad sötvattensfisk indikerar tillgängliga data ingen risk för skadliga effekter. Det bör dock tydliggöras att data för fisk, monitoring såväl som toxicitetsdata och dess extrapoleringar är förknippade med en hög grad av osäkerhet p.g.a. brister i dataunderlaget.
Summary
This report summarizes the outcome of a project to present new information and knowledge about possible environmental- and health risks of perfluoro-alkylated and polyfluoroperfluoro-alkylated substances (PFASs) in the Swedish popula-tion and in Swedish biota. The project was carried out as a risk assessment, consisting of an exposure assessment with Swedish biomonitoring data for 23 PFASs measured in humans, mammals, birds and fish, a hazard assess-ment with toxicological data from studies on mammals, birds and fish for the selected compounds and a risk characterization for humans, mammals, birds and fish. This is the first environmental and health risk assessment investigat-ing a large number of PFASs, individually and in combination.
In the human exposure assessment, two populations were identified and selected – individuals exposed indirectly via the environment (i.e. the general population) and an occupationally exposed subpopulation – professional ski waxers. The exposure data used consisted of PFASs levels in blood and serum. The result showed that PFAS congeners were found at low ppb (ng/ ml) concentrations in serum in the general population. In a small subpopula-tion eating contaminated fish, PFOS was found at higher ppb concentrasubpopula-tions. In the occupationally exposed, the levels of some congeners were significantly higher than in the average population, i.e. PFNA and PFOA reaching high ppb and low ppm (µg/ml) levels in serum, being approximately 125 and 200 times higher than in the general population. Temporal trend studies in the general population showed that the levels of PFOS, PFDS, PFOSA and PFOA seem to decrease, whereas, the levels of PFBS, PFHxS, PFNA, PFDA and PFUnDA in serum seem to increase.
In the human hazard assessment, toxicity data and conclusions were pri-marily based on already existing hazard- and/or risk assessments and sup-plemented with additional published toxicological data of relevance. Two toxicological endpoints common for PFASs were identified and selected: 1) hepatotoxicity and 2) reproductive toxicity. For congeners lacking toxicologi-cal data or internal dose measurements a read-across was performed to the closest most potent congener for the respective endpoint. In addition, other endpoints showing lower effect levels were also considered. The result showed that the PFAS congeners were relatively similar with regard to their hepa-totoxic and reproductive toxic properties, with points of departure (PODs) ranging from 4–89 µg/ml serum and 4–> 60 µg/ml, respectively. However, relevant toxicological data with internal doses were available for 4 of 15 congeners in the general population and for 5 of 17 in the occupationally exposed. For some congeners, other endpoints were identified at very low doses (e.g. immunotoxicity, impaired mammary gland development, obesity), similar to or below current human exposure levels. Epidemiological studies on PFASs showed inconsistent results.
SWEDISH ENVIRONMENTAL PROTECTION AGENCY REPORT 6513
Environmental and Health Risk Assessment of Perfluoroalkylated and Polyfluoroalkylated Substances (PFASs) in Sweden
13
The risk characterization did not indicated any cause for concern2 for
hepato-toxicity or reproductive hepato-toxicity in the general population, neither for congeners assessed individually nor in combination. PFOS levels in the subpopulation that consumed contaminated fish were, or were close to, being of concern. For the occupationally exposed ski waxers a cause for concern was identified for hepa-totoxicity based on single and combined PFAS exposure, as well as for repro-ductive toxicity based on combined PFAS exposure. It should be noted, that this group comprises a very limited number of people in Sweden.
In the environmental exposure assessment, five species/subgroups with cor-responding tissues were identified and selected: 1) seals (liver), 2) otters (liver), 3) birds (eggs), 4) marine fish (liver), and 5) highly exposed freshwater fish (muscle) based on the presence of PFASs in these species. All of these are pre-sent in or connected to the aquatic environment, demonstrating how PFASs enter the food chain via this route. In contrast, PFASs-levels were significantly lower in the terrestrial species examined. PFOS was the dominant congener in all species, often present at levels one to three orders of magnitude higher than the other congeners, and found at low ppm (µg/g) or high ppb (ng/g) levels in seals and otters, bird’s eggs and highly exposed freshwater fish, and at low ppb levels in marine fish. In seals and otters, there was a tendency for levels of sulfonates to decrease and carboxylates to increase. In peregrine falcon eggs, all PFASs detected were long chain congeners and temporal trends showed that the levels of sulfonates were either unchanged or decreasing. For carboxy-lates, the levels of congeners with 11–15 carbons were decreasing, but increas-ing for PFNA and PFDA. In marine fish, all congeners detected contained six or more carbons for sulfonates and nine or more for carboxylates, likely reflecting the higher bioconcentration factor (BCF) for the long chain congeners. In highly exposed freshwater fish, PFASs levels were significantly higher than in marine fish.
In the environmental hazard assessment, hepatotoxicity and reproductive toxicity were assessed for seals and otters, and the PODs were derived from the same toxicological database as for the human hazard assessment but with hepatic concentrations used as internal dose. Toxicological data with hepatic PFASs-levels were available for 4 of 17 congeners assessed; thus data for the other congeners had to be extrapolated. For birds, only data from reproduc-tive toxicity studies with PFASs-levels in eggs were considered, which was available for 5 of 15 congeners, and data for the other congeners had to be extrapolated. Few relevant studies on the reproductive toxicity of PFASs in birds were available, with effects being shown only for PFOS, hence the data can be considered uncertain with regard to effects and effect levels, and con-sequently, the extra polations were uncertain. For fish, toxicological data were
2 ”Concern” does not necessarily mean that a threat to human health and/or the environment exists, but show that
there is an inadequate margin between current exposure levels and toxic effect levels, and that further refinement of the risk assessment and/or preventative measures to reduce the exposure levels may be needed (see section 1.2.3).
available for 5 of 17 congeners but are highly uncertain due to different spe-cies, study durations and endpoints used in the different studies.
The result of the environmental risk characterization indicated a cause for concern for seals and otters for hepatotoxicity and reproductive toxicity, for either individual congeners and/or all congeners combined. It should be noted that the conclusions regarding seals and otters are based on the average PFASs-levels at the latest time-point in temporal studies, and that the PFASs-levels can be higher on an individual basis, which would result in lower safety margins than presented herein. For reproductive toxicity in birds, a cause for concern was indicated for PFOS where the highest level in peregrine falcons eggs (sampled in 2006) exceeded the toxic effect level identified in one study and where the average PFOS level is close to the toxic effect level. Thus, it cannot be excluded that these levels of PFOS in the eggs could give rise to adverse effects. For marine as well as freshwater fish, the available data do not indicate any cause for concern, even in waters contaminated by PFOS. However, it should be noted that the data for fish, monitoring as well as toxicity data, were subject to highly uncertain extrapolations.
SWEDISH ENVIRONMENTAL PROTECTION AGENCY REPORT 6513
Environmental and Health Risk Assessment of Perfluoroalkylated and Polyfluoroalkylated Substances (PFASs) in Sweden
15
1. Introduction
1.1 Perfluoroalkylated and polyfluoroalkylated
substances (PFASs)
Perfluoroalkylated and polyfluoroalkylated substances (PFASs) are a large family of man-made highly fluorinated organic chemicals that has been used since the 1950s as components of and precursors for surfactants and surface protectors for industrial and consumer applications. During the last decade, PFASs has been found globally in humans, wildlife and in the environment and recognized as highly persistent environmental contaminants. Initially, most attention were given to perfluorooctane sulfonate (PFOS) and perfluorooctanoate (PFOA), two common PFASs in biota and also the most studied with regard to toxicity and ecotoxicity. Lately, more attention have been given also to other PFASs, however risk assessments for the vast majority of these are lacking.
1.1.1 Physicochemical and biological properties
PFASs are characterized by a partly (poly) or fully (per) fluorinated carbon chain, typically four to fifteen carbons long, and with a functional group at the end. The most common groups of PFASs measured and detected in humans and biota are perfluorinated sulfonates and carboxylates (Figure 1). Due to the strength of the carbon-fluorine bond, PFASs are extremely resistant towards thermal, chemical and biological degradation (Järnberg et al., 2006). In addition, the fluorinated carbon chain is both oil-and water repellent, making PFASs useful in many industrial and consumer applications. However, their resistance to degradation also renders them persistent in the environ-ment. Perfluorinated sulfonates and carboxylates are considered stable end-stage products that will not degrade under any environmental circumstances. However, they can be generated from the transformation of polyfluorinated precursor molecules containing the same “backbone” structure, e.g. fluoro-telomers (Dinglasan et al., 2004). Perfluorinated sulfonates and carboxylates
Figure 1. Schematic chemical structures of perfluorinated sulfonates (1), carboxylates (2) and fluorotelomer alcohols (3), including perfluorooctane sulfonate (PFOS), perfluorooctanoate (PFOA) and 6:2 FTSA.
are strong acids and present mostly in their non-volatile acid forms in the envi-ronment and in biota. Fluorotelomers (e.g. fluorotelomer alcohols, Figure 1), on the other hand, are volatile and can be transported in the atmosphere (reviewed in Houde et al., 2006).
In the environment, PFASs have the potential to bioaccumulate in fish, with the bioconcentration factor (BCF) being proportional to carbon chain length, at least up to 11 carbons (Martin et al., 2003a). PFASs also have a potential for biomagnification in food chains, as shown by the highest levels found in top predators such as polar bear, mink, otter and seal (Giesy and Kannan, 2001, Kannan et al., 2002; 2005, Kelly et al., 2009). In contrast to classical persistent organic contaminants, e.g. chlorinated and brominated compounds, PFASs does not distribute to fatty tissues in living organisms, but to proteins such as albumin in liver, plasma and eggs, and fatty acid binding proteins in cells (Kannan, et al., 2005, Kerstner-Wood et al., 2004, Luebker et al., 2002).
1.1.2 nomenclature
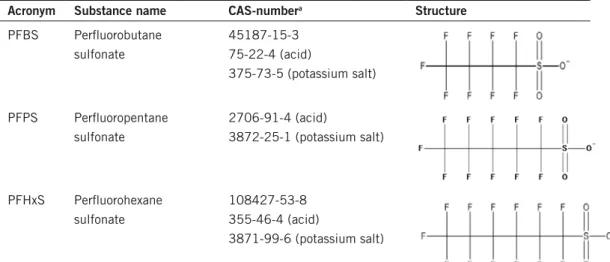
Individual PFAS congeners are named according to the number of carbons on the alkyl chain and the functional group, e.g. the four carbon chain with a sul-fonate group is named perfluorobutane sulsul-fonate (PFBS). There are three main classes of PFAS that are included in this report: perfluorinated sulfonates, per-fluorinated carboxylates and fluorotelomers. For a full list of the compounds assessed in this report, their CAS-number and chemical structure see Table 1.
For many years, there has not been a consistent terminology for perfluoro-alkylated substances. Different and sometimes overlapping abbreviations have been used. Recently, Buck et al. (2011) proposed a terminology and classifica-tion scheme for perfluoroalkylated and polyfluoroalkylated substances, which will also be used herein, e.g.:
• PFASs – Perfluoroalkylated and polyfluoroalkylated substances (singular PFAS).
• PFAA – Perfluoroalkylated Acid. • PFSA – Perfluoroalkylated sulfonic acid. • PFCA – Perfluoroalkylated carboxylic acid.
• Long-chain PFASs – PFSAs with ≥ 6 carbons and PFCAs with ≥ 8 carbons, as originally defined by the Organization for Economic Co-operation and Development (OECD, 2012).
• Homologues – Different PFASs sharing the same functional group, e.g. PFSAs, PFCAs.
1.1.3 uses and regulations
PFASs have been widely used as components of and precursors for surfactants and surface protectors in industrial applications and consumer products, such as impregnating agents for clothing and textiles, as coatings for paper and packaging, in waxes and cleaning agents, insecticides, fire-fighting foams and hydraulic fluids in airplanes (3M, 2000; Kissa, 2001).
SWEDISH ENVIRONMENTAL PROTECTION AGENCY REPORT 6513
Environmental and Health Risk Assessment of Perfluoroalkylated and Polyfluoroalkylated Substances (PFASs) in Sweden
17
By 2002, the largest producer of PFOS and PFOS-related compounds (all pre-cursor compounds that can be degraded to PFOS) discontinued its production of these substances (OECD, 2005). Since then, other risk-reducing measures have also been taken within e.g. the European Union (EU) and the United Nations (UN) to reduce the use of PFOS. PFOS and PFOS-related compounds was prohibited from use in chemical products and articles within the EU in 2008 (EU, 2006) and were in 2009 included in the Stockholm Convention on Persistent Organic Pollutants (UNEP, 2009) as well as in the Convention on Long-Range Transboundary Air Pollution (CLRTAP)(UNECE, 2009), resulting in restrictions on their use. Although PFOS is still produced elsewhere (UNEP, 2008), these measures has led to a markedly decreased use of PFOS (KemI, 2006). To replace PFOS, several manufacturers have moved towards the use of other per- or highly fluorinated compounds, such as fluorotelomers and shorter alkyl chain sulfonates, such as PFBS, sharing similar technical proper-ties as PFOS (KemI, 2006; 2009). There are no restrictions on the use of other PFASs in the EU than PFOS and PFOS-related compounds, though PFOA are kept under review for ongoing risk assessment activities (EU, 2006).
1.1.4 Sources of PfASs in the Swedish environment
There is and has not been any production of PFASs in Sweden (KemI, 2006). PFASs detected in the Swedish environment is likely a result of release from industrial use of these chemicals, from consumer use of products containing PFASs, from leakage from waste disposals and landfills as well as from sewage treatment plants effluents. Aqueous fire-fighting foams (AFFF) have been pointed out as a significant point-source of PFOS and other PFASs (Järnberg et al., 2006, Moody et al., 2003). Also, atmospheric import of volatile precur-sor molecules, e.g. fluorotelomer alcohols that can be degraded to PFCAs (Ellis et al. 2004), is likely (Järnberg et al., 2006).
1.1.5 Sources of human exposure to PfASs
The most significant sources of PFASs for the general population are thought to be food, including drinking water, as well as inhalation of household dust (D’Hollander et al., 2010). Of these, diet has been proposed to be the major exposure route for several PFASs, particularly fish and seafood (Haug et al., 2010), and where the diet may account for as much as 99% and 84% of the total PFOS and PFOA intake, respectively, though dust may also consti-tute a major source on an individual basis (Haug et al., 2011). For infants, breast milk is the major source to PFASs (Haug et al., 2011), in addition to placental transfer of these chemicals during pregnancy (Kim et al., 2011), and may equal the dietary PFASs intake in adults (Thomsen et al., 2010). Occupationally exposed individuals are highly exposed as compared to the general population, likely through inhalation and/or ingestion of aero-sols and dust containing PFASs (ATDSR, 2009). The highest levels of PFASs have been measured in individuals working in production facilities of PFASs (KemI, 2004). The most highly occupationally exposed population in Sweden
are likely professional ski waxers for which the highest levels in this report are presented, due to the presence of PFASs in gliding waxes. No other highly exposed subpopulations have been identified in Sweden.
1.1.6 guidance values
There are no legal limit values for PFASs in Sweden or in the EU. However, to protect human health, limit values have been proposed by the Swedish Environmental Protection Agency (EPA) for PFOS in Sweden of 0.35–1 µg/l in drinking water, and 6 µg/g in food (Naturvårdsverket, 2008). In a risk assess-ment of PFOS and PFOA, the European Food Safety Authority (EFSA) derived tolerable daily intake (TDI) values for PFOS and PFOA of 0.15 and 1.5 µg/kg bw/day (EFSA, 2008). Other European authorities have provided recom-mendations for maximum intake of PFASs in food and water. The United Kingdom (UK) Food Standards Agency’s Committe on Toxicity of Chemicals in Food, Consumer Products and the Environment recommended TDI values for PFOS and PFOA of 0.3 and 3 µg/kg bw/day (COT, 2006a;b). The German Federal Institute for Risk Assessment (BfR) suggested a TDI value of 0.1 µg/kg bw/day for PFOS (German BfR, 2006). In drinking water, the UK’s Drinking Water Inspectorate (DWI) recommends no higher levels than 0.3 µg/l of PFOS or PFOA (DWI, 2009) and the German Federal Environment Agency (German UBA) no higher level than 0.1 µg/l of PFOS and PFOA together (German UBA 2006).
For the environment, limit values of PFOS of 30 and 3 µg/l have been proposed by the Swedish EPA for limnic and marine waters, respectively, and 6 µg/g wet weight (w.w.) in biota to protect predatory animals and humans (Naturvårdsverket, 2008). Recently, within the EU Water Framework Directive (2000/60/EC), environmental quality standard values for PFOS and its deriva-tives was proposed at 0.65 ng/l (annual average) and 36 µg/l (maximum acceptable concentration) in inland surface waters, 0.13 (annual average) and 7.2 µg/l (maximum acceptable concentration) in marine water, and 9.1 µg/kg w.w. in fish (EU, 2012)3.
1.1.7 biomonitoring of PfASs in Sweden
The SwediSh environmenTal moniToring Programme
The Swedish national environmental monitoring programme is coordinated by the Swedish EPA, and consists of 10 different areas, of which “Toxic sub-stances coordination” constitutes one. This area includes screening/monitoring of metals and organic pollutants and an environmental specimen bank at the Swedish Museum of Natural history, Stockholm, in which analyses on compounds can be performed. Data host for this programme is the Swedish Environmental Research Institute, IVL, Stockholm, Sweden. PFASs was first included in the screening during 2001–2003 (Naturvårdsverket, 2005), and
SWEDISH ENVIRONMENTAL PROTECTION AGENCY REPORT 6513
Environmental and Health Risk Assessment of Perfluoroalkylated and Polyfluoroalkylated Substances (PFASs) in Sweden
19
were then, based on being identified as a group of concern, adopted into the regular environmental monitoring.
The SwediSh healTh-relaTed environmenTal moniToring Programme (hÄmi)
Included in the Swedish national environmental monitoring programme is the Health-related Environmental Monitoring Programme (HÄMI). HÄMI started 1993 with the purpose to monitor health effects that may be related to environ-mental factors, including estimation of human exposure to hazardous substances by analysing human blood, breast milk and urine. Data host is the Institute of Environmental Medicine (IMM), Karolinska Institutet, Solna, Sweden.
1.2 Approach of the risk assessment
This risk assessment is for the human health part conducted in accordance with the EU’s chemicals legislation REACH terminology and guidelines (European Chemicals Agency (ECHA), 2012). The environmental part will not be con-ducted according to REACH guidelines, but instead use a combination of a margin of exposure (MOE) approach for all species together with the risk characterization ratio (RCR) approach used within REACH (see descriptions below) for mammals, based on the unconventional approach herein to apply biomonitoring data in wildlife species as a measure of exposure.
1.2.1 Exposure assessment
For the health-related exposure assessment, biomonitoring data from the Swedish population is used (blood and serum levels of PFASs), to be compared to toxicological effect levels. Evaluation of external exposure data of PFASs, such as oral intake via food and drinking water, or exposure via inhalation or dermal contact is not covered within the scope of this project. For the environ-mental exposure assessment, tissue levels of PFASs are used for mammals, fish and birds. Data for the health-related as well as the environmental exposure assessment have been collected from HÄMI and the Swedish environmental monitoring programme, from national and international reports, from the scientific literature and via contact with individual researchers. Publications from 2004 until August 2011 have been included in this report, subsequent to the previous risk assessment on PFOS by KemI (KemI, 2004). Studies are pre-sented in chronological order based on the time-point of collection of samples for the study.
The exposure data used for the risk characterization will consist of expo-sure levels of PFASs in blood/serum or tissues from the latest time-point in a temporal study or from a sample in a snapshot study taken no earlier than 2006, on the basis that samples ≥ 5 years old are considered out of date for this assessment. Temporal trend evaluations have been based on levels from 2000 and onwards. Where available, the highest levels from selected key
studies and the highest levels of the latest time-points in temporal trend studies, respectively, have been used in order for the assessment to be conservative. The advantage of using serum and tissue levels of PFASs as opposed to external expo-sure is that these internal concentrations represent an integrated expoexpo-sure for the respective PFAS congeners, irrespective of the source, e.g. precursor molecules that can be metabolized to e.g. PFOS and PFOA. Also, using serum and tissue levels eliminates uncertain extrapolations of external dose-response relationships between species and from animals to humans due to large differences in kinetics. For the assessment of human health, two exposure groups are considered:
1. Individuals exposed indirectly via the environment (i.e. the general population).
2. Occupationally exposed individuals (professional ski waxers). For the environmental assessment, five subgroups are evaluated:
1. Seals (liver). 2. Otters (liver. 3. Birds (eggs). 4. Marine fish (liver).
5. Highly exposed freshwater fish (muscle).
1.2.2 Hazard assessment
For the human and the environmental hazard assessment of the 23 individual PFAS congeners included in this project, toxicity data and conclusions will pri-marily be used from already existing hazard- and/or risk assessments and sup-plemented with additional published data of relevance, i.e., studies showing lower effect levels or other relevant information. This is a pragmatic approach needed in order to cover all substances within the time-frame of the project. The supplementary data are derived from literature searches in Pubmed. For congeners lacking toxicological information or internal dose measurements, a read-across to the closest most potent congener for the respective endpoint will be performed.
In the human hazard assessment, all PFAS congeners included in the human exposure assessment will be assessed. Also, congeners that have been identified in mammals in the environmental exposure assessment will be included in the human hazard assessment part, since toxicity data from mammals are used for both humans and mammals.
For the environmental hazard assessment, all compounds identified in the exposure assessment for mammals, birds and fish will be included. For birds, levels in eggs in toxicity studies will be used for comparison to PFASs levels in eggs in the exposure assessment. For fish, tissue levels of the respective PFASs in the exposure assessment will be used for comparison to tissue levels in toxicity studies. If no tissue levels are available from the critical toxicity study, an estimation of tissue concentration will be made based on
extrapola-SWEDISH ENVIRONMENTAL PROTECTION AGENCY REPORT 6513
Environmental and Health Risk Assessment of Perfluoroalkylated and Polyfluoroalkylated Substances (PFASs) in Sweden
21
Points of departure (PODs) will be identified in the toxicological data sets, i.e. No-Observed-Adverse-Effect-Levels (NOAELs), Lowest-Observed-Adverse-Effect-Levels (LOAELs), No-observed-effect concentrations (NOECs) or Benchmark dose (BMD) levels. Internal dose-metrics (levels in serum, liver, eggs, muscle) at critical effect levels will be used. From the PODs, a “safe” exposure level will be derived by the use of appropriate assessment factors (AFs) resulting in endpoint-specific Derived-No-Effect-Levels (DNELs):
DNEL = POD (e.g. NOAEL, LOAEL, BMD)/AFs
For further information on the methodology to derive DNELs, see guidance documents from ECHA (ECHA 2010, 2011).
1.2.3 risk characterization
For the assessment of risks to human health, the risk characterization will be conducted for all individual congeners by deriving risk characterization ratios (RCRs), i.e. comparing DNELs with exposure levels for the respective PFASs to evaluate whether there exists a risk or not:
RCR = Exposure/DNEL. Ratio < 1 = risk is of no/minor concern, ratio of > 1 = risk is of concern
For further information on the methodology to derive RCRs, see guidance documents from ECHA (ECHA, 2008).
In addition, a cumulative risk characterization and evaluation will be performed for all congeners combined. This is accomplished by addition of the respective RCR values for individual PFAS congeners:
RCRCumulative = ∑ RCRX + RCRY + RCRZ...; Ratio < 1 = risk is of no/minor concern, ratio of > 1 = risk is of concern
This method to sum the RCR values is justified by the structural, physico-chemical and toxicological similarities between the PFAS congeners. However, different types of toxicity studies have been used herein (long-term, short-term etc.) and “read-across” extrapolations performed, all adding uncertainties. These uncertainties are compensated for by applying different assessment factors before calculating the RCRs for the individual congeners. When adding the RCR values in the cumulative evaluation, these uncertainties are taken into account in the individual RCR values. A similar approach has been used by e.g. the Danish Environmental Protection Agency (Danish EPA) in a cumulative health risk assessment of phthalates (Danish EPA, 2011).
For the environmental risk assessment, a margin of exposure approach (MOE) will be used for all species assessed.
MOE = POD/exposure. For this assessment a MOE of 100 is considered sufficient.
In addition, for mammals, a cumulative risk characterization will be performed using the same REACH-methodology as for human health, in order to allow for a comparison of RCR values to the human situation. This latter approach is not, however, suitable for birds and fish in this assessment based on that dif-ferent endpoints are being used in the evaluation of toxicological data for these species and due to large uncertainties in extrapolations of toxicological data for these species.
For both the human health and the environmental risk assessment, a RCR of > 1 and a MOE of ≤ 100, respectively, indicate that risks are of concern. The expression “concern” does not necessarily mean that there is a threat to human health and/or the environment, but rather shows that there is an inad-equate margin between current exposure levels and toxic effect levels, and that preventative measures may be needed in order to reduce the exposure levels. Also, further refinement of the assessment can be done, for instance by improving the hazard assessment to obtain a more comprehensive database and/or by improving the exposure assessment (ECHA, 2009).
1.3 Selection of compounds
The PFASs assessed in this report consist of the congeners that have been studied within the Swedish Health-Related Environmental Monitoring Programme (HÄMI) and the Swedish Environmental Monitoring Programme as well as within individual research projects and reported to be present in the blood of the Swedish population and in Swedish biota. For a full list of the compounds, their CAS-number and their chemical structure see Table 1.
Table 1. PfASs covered within this project and their acronyms, cAS-number and structure. Acronym Substance name cAS-numbera Structure
PFBS Perfluorobutane sulfonate 45187-15-3 75-22-4 (acid) 375-73-5 (potassium salt) PFPS Perfluoropentane sulfonate 2706-91-4 (acid) 3872-25-1 (potassium salt) PFHxS Perfluorohexane 108427-53-8
SWEDISH ENVIRONMENTAL PROTECTION AGENCY REPORT 6513
Environmental and Health Risk Assessment of Perfluoroalkylated and Polyfluoroalkylated Substances (PFASs) in Sweden
23
Acronym Substance name cAS-numbera Structure
PFHpS Perfluoroheptane sulfonate 375-92-8 (acid) 60270-55-5 (potassium salt) 68259-07-4 (ammonium salt) PFOS Perfluoroctane sulfonate 45298-90-6 1763-23-1 (acid) 2795-39-3 (potassium salt) 4021-47-0 (sodium salt) 29081-56-9 (ammonium salt) PFOSi Perfluorooctane sulfinate 647-29-0 (acid) PFOSA Perfluoroctane sulfonamide 754-91-6
EtFOSA N-ethyl perfluorooctane
sulfonamide 4151-50-2 PFDS Perfluorodecane sulfonate 126105-34-8 335-77-3 (acid) 2806-16-8 (potassium salt) 67906-42-7 (ammonium salt) PFBA Perfluorobutanoate 45048-62-2 375-22-4 (acid) 2218-54-4 (sodium salt) 10495-86-0 (ammonium salt) PFPeA Perfluoropentanoate 45167-47-3 2706-90-3 (acid) 68259-11-0 (ammonium salt) PFHxA Perfluorohexanoate 92612-52-7 307-24-4 (acid) 2923-26-4 (sodium salt) 21615-47-4 (ammonium salt) PFHpA Perfluoroheptanoate 120885-29-2 375-85-9 (acid) 20109-59-5 (sodium salt) 6130-43-4 (ammonium salt) PFOA Perfluoroctanoate 45285-51-6 335-67-1 (acid) 2395-00-8 (potassium salt) 335-95-5 (sodium salt) 3825-26-1 (ammonium salt)
Acronym Substance name cAS-numbera Structure PFNA Perfluorononanoate 72007-68-2 375-95-1 (acid) 21049-39-8 (sodium salt) 4149-60-4 (ammonium salt) PFDA Perfluorodecanoate 73829-36-4 335-76-2 (acid) 3108-42-7 (ammonium salt) PFUnDA Perfluoroundecanoate 196859-54-8 2058-94-8 (acid) 4234-23-5 (ammonium salt) PFDoDA Perfluorododecanoate 171978-95-3 307-55-1 (acid) PFTrDA Perfluorotridecanoate 862374-87-6 72629-94-8 (acid) PFTeDA Perfluorotetradecanoate 365971-87-5 376-06-7 (acid) PFPeDA Perfluoropentadecanoate 1214264-29-5 141074-63-7 (acid) PFHxDA Perfluorohexadecanoate 1214264-30-8 67905-19-5 (acid) 6:2
FTSA 1,1,2,2-Tetrahydroper-fluorooctanesulfonate 425670-75-327619-97-2 (acid)
SWEDISH ENVIRONMENTAL PROTECTION AGENCY REPORT 6513
Environmental and Health Risk Assessment of Perfluoroalkylated and Polyfluoroalkylated Substances (PFASs) in Sweden
25
2. Human exposure
There are a number of biomonitoring studies where blood or serum/plasma levels of PFASs have been measured in the Swedish population and that are included herein. Most commonly, serum levels are measured and used for comparisons between studies. A ratio of 1:1 between serum and plasma levels for PFOS, PFOA and PFHxS has been shown (Ehresman et al., 2007) and levels in these two matrices are therefore directly comparable to each other, whereas a ratio of approximately 2:1 exists for serum or plasma to whole blood for the same PFAASs. Consequently, whole blood levels of these PFASs can be multiplied by a factor of 2 to give their corresponding serum levels, and it can be assumed that this is the case also for other PFAAs, based on their similar physicochemical properties. The non-charged congener PFOSA was however shown to distribute to a greater extent to whole blood than to plasma (Kärrman et al., 2006). Levels of different PFASs in breast milk were shown to be approximately 1–12% of their corresponding serum levels (Kärrman et al., 2007; Table 5).
2.1 Indirect exposure via the environment
– Snapshot studies
2.1.1 Samples taken before 2006 (not considered for risk characterization)
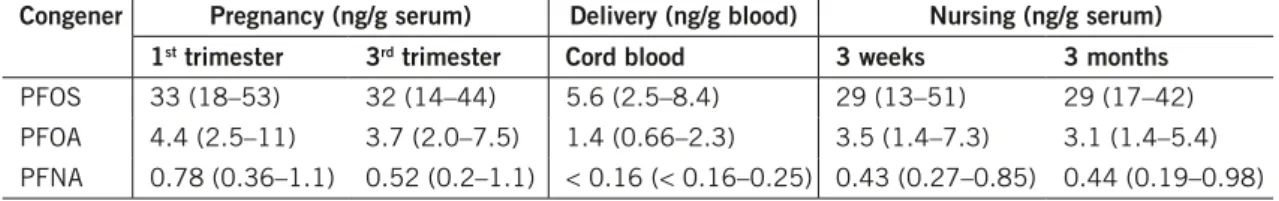
Glynn et al. (2008) performed a study where levels of PFOS, PFOA and PFNA were analysed in mothers from Uppsala and their neonates. Blood samples were drawn during 1996–1999 from 19 primipara pregnant women during the first trimester, the third trimester and after three weeks and three months post-delivery, respectively, as well as in cord blood. The result showed that the levels of PFOS in maternal serum as well as in cord blood were highest among the congeners analysed, followed by PFOA and PFNA (Table 2). The levels in cord blood as compared to maternal serum were lower for all compounds (after conversion to serum levels), however to various extents, indicating a difference in the rates of placental transfer between the congeners.
Table 2. levels of PfOS, PfOA and PfnA in serum from pregnant and nursing women and in cord blood sampled during 1996–1999. The results are presented as medians (range). Source. glynn et al. (2008).
congener Pregnancy (ng/g serum) delivery (ng/g blood) nursing (ng/g serum) 1st trimester 3rd trimester cord blood 3 weeks 3 months
PFOS 33 (18–53) 32 (14–44) 5.6 (2.5–8.4) 29 (13–51) 29 (17–42)
PFOA 4.4 (2.5–11) 3.7 (2.0–7.5) 1.4 (0.66–2.3) 3.5 (1.4–7.3) 3.1 (1.4–5.4) PFNA 0.78 (0.36–1.1) 0.52 (0.2–1.1) < 0.16 (< 0.16–0.25) 0.43 (0.27–0.85) 0.44 (0.19–0.98)
Berglund et al. (2004) analysed blood for PFOS and PFOA sampled during 1997–2000 from 108 women (19–56 years, median age 40 years) with high fish consumption from different parts of Sweden. The results showed that the level of PFOS was on average 18 ng/ml whole blood and 2.0 ng/ml for PFOA (Table 3).
Table 3. geometric mean levels of PfOS and PfOA in whole blood samples (ng/ml) of Swedish women with high fish consumption (n=108) 1997–2000. Source: berglund et al. (2004). congener mean range
PFOS 18 3.0–67
PFOA 2.0 0.40–4.8
Kärrman et al. (2006) determined the levels of 12 PFASs – PFBS, PFHxS, PFOS, PFOSA, PFDS, PFHxA, PFOA, PFNA, PFDA, PFUnDA, PFDoDA and PFTeDA in whole blood sampled 1997–2000 in 47 males (age 19–46) and their mothers (age 47–75) primarily from southern Sweden. Overall, PFOS was detected at the highest mean concentrations (16 ng/ml), followed by PFOSA, PFOA and PFHxS (Table 4). These PFASs were detected in all samples. PFHxDA, PFNA, PFDS, PFDA, and PFUnDA were not detected in all samples and at levels close to the detection limit. PFDoDA and PFTeDA could only be identified but not quantified and PFBS was not detected at all.
Table 4. geometric mean levels of detected PfASs in whole blood (ng/ml) in Swedish males and females sampled 1997–2000. Source: kärrman et al. (2006).
Sex n whole blood PfOS PfOSA PfOA PfHxS PfnA PfundA
All 66 Mean 16 3.0 2.4 1.5 0.3 0.1 Range 1.7–37.0 0.4–22.9 0.5–12.4 0.4–28.4 < 0.1–1.9 < 0.1–0.7 Males 40 Mean 17 3.2 2.6 1.9 0.2 0.1 Range 1.7–37.0 0.8–22.9 0.5–12.4 0.4–28.4 < 0.1–1.9 < 0.1–0.6 Females 26 Mean 16 2.6 2.1 1.1 0.3 0.1 Range 4.6–32.8 0.4–9.5 0.8–4.1 0.4–2.5 < 0.1–1.0 < 0.1–0.7
Sex n whole blood PfdA PfHxA PfdS PfdodA PfTedA PfbS
All 66 Mean 0.1 – – < 0.1 < 0.1 < 2 Range < 0.1–0.6 < 0.1–1.6 < 0.1–4.5 < 0.1 < 0.1 < 2 Males 40 Mean 0.1 – – < 0.1 < 0.1 < 2 Range < 0.1–0.5 < 0.1–1.1 < 0.1–2.4 < 0.1 < 0.1 < 2 Females 26 Mean 0.1 – – < 0.1 < 0.1 < 2 Range < 0.1–0.6 < 0.1–1.6 < 0.1–4.5 < 0.1 < 0.1 < 2
Kärrman et al. (2007) analysed matched breast milk and serum samples from 12 primipara women in different Swedish regions during 2004 for 13 PFASs – PFBS, PFHxS, PFOS, PFDS, PFHxA, PFHpA, PFOA, PFNA, PFDA, PFUnDA, PFDoDA, PFOSA and tetrahydro-PFOS (not included in this risk assessment). The results showed that eight PFASs could be detected in the serum samples, with PFOS showing the highest mean serum concentration followed by PFHxS,
SWEDISH ENVIRONMENTAL PROTECTION AGENCY REPORT 6513
Environmental and Health Risk Assessment of Perfluoroalkylated and Polyfluoroalkylated Substances (PFASs) in Sweden
27
PFOA, PFNA, PFDA, PFUnDA and PFOSA (Table 5). PFDS was detected in only one serum sample. Of the eight PFASs found in the serum samples, five were detected in the matched milk samples. PFOS and PFHxS were detected in all the matched breast milk samples. PFOSA and PFNA were detected in eight and two milk samples, respectively, and PFOA in one sample. The mean ratios between milk and serum (M:S) concentrations were 0.01:1 for PFOS, 0.02:1 for PFHxS, and 0.07:1 for PFOSA. The M:S ratios for PFOA and PFNA were uncertain because of that only one and two milk samples contained levels above the detection limit. There were significant correlations between levels of PFOS and PFHxS in serum and breast milk.
Table 5. levels of PfASs (ng/ml) in matched milk and serum samples from 12 Swedish women in 2004. Source: kärrman et al. (2007).
Serum PfOS PfHxS PfOA PfnA PfdA PfundA PfOSA
N > LOD 12 12 12 12 12 12 9
Mean 20.7 4.7 3.8 0.80 0.53 0.40 0.24
Range 8.2–48 1.8–11.8 2.4–5.3 0.43–2.5 0.27–1.8 0.20–1.5 < 0.10–0.49
milk PfOS PfHxS PfOA PfnA PfdA PfundA PfOSA
N > LOD 12 12 1 2 – – 8
Mean 0.201 0.085 – 0.017 – – 0.013
Range 0.06–0.47 0.03–0.17 < 0.21–0.49 < 0.005–0.02 < 0.008 < 0.005 < 0.007–0.03
M:S ratio 0.01:1 0.02:1 0.12:1 0.01:1 – – 0.07:1
2.1.2 Samples taken after 2006 (considered for risk characterization)
Ericson et al. (2008) measured the levels of 12 PFASs – PFBS, PFHxS, PFOS, PFHxA, PFHpA, PFOA, PFNA, PFDA, PFUnDA, PFDoDA, PFTeDA and 6:2 FTSA in whole blood samples collected in 2007 from nine individuals, four males and five females between the ages 19–65 in Örebro. In total, six indi-vidual PFASs were detected, the dominant being PFOS, with a mean concen-tration of 5.9 ng/ml, followed by PFOA, PFHxS, PFNA, PFDA and PFUnDA (Table 6). PFBS, 6:2 FTSA, PFHxA, PFHpA, PFDoDA and PFTeDA were all under their limits of detection.
Table 6. geometric mean PfASs levels in blood (ng/ml) from Swedish men and women (n = 9) sampled 2007. Source: Ericson et al. (2008).
congener mean range
PFOS 5.9 2.8–13.2 PFOA 1.3 < 0.58–2.2 PFHxS 0.51 0.14–0.89 PFNA 0.40 0.19–0.68 PFDA 0.21 < 0.12–0.35 PFUnDA 0.17 0.06–0.29 6:2 FTSA < 1.82 – PFHpA < 0.12 – PFHxA < 0.11 – PFTeDA < 0.04 – PFDoDA < 0.03 – PFBS < 0.012 –
Hovgard et al. (2009) measured in 2009 the levels of PFOS in blood serum of persons living close to the popular sport fishing lakes Ingsjöarna, where elevated levels of PFOS have been detected in the water as well as in fish, likely due to runoff from the nearby airport Landvetter where fire-fighting foam containing PFOS has been used. Individuals were divided into three groups based on their feeding habits: A) individuals that had consumed fish from the area, B) indi-viduals that had not consumed fish from the area but other kind of fish, and C) individuals that do not, or rarely, consume fish. The results showed that individuals in group A had the highest levels of PFOS in serum with a mean/ median of 43/23 ng/ml serum, followed by group B and C (Table 7).
Table 7. levels of PfOS in blood serum (ng/ml) of people living close to the lakes ingsjöarna sampled 2009. Source: Hovgard et al. (2009).
group n mean/median range
A 13 45/23 3.0–204
B 8 31/20 8.5–83
C 8 12/13 3.9–17
Jönsson et al. (2010) analysed during 2009–2010 the levels of PFHxS, PFOS, PFOA, PFNA, PFDA and PFUnDA in serum samples from 50 males at the age of 18 recruiting for military. The results showed that PFOS was the domi-nant PFAS with a median level of 6.9 ng/ml serum, followed by PFOA, PFNA, PFHxS, PFDA and PFUnDA (Table 8).
Table 8. levels of PfASs in serum (ng/ml) of Swedish males at the age of 18 (n=50) sampled 2009–2010. Source. Jönsson et al. (2010).
congener median range
PFOS 6.9 3.7–19 PFOA 1.9 1.2–3.3 PFNA 0.96 0.49–2.6 PFHxS 0.78 0.38–2.5 PFDA 0.41 0.14–0.65 PFUnDA < 0.1 < 0.1–0.83
2.2 Indirect exposure via the environment
– Temporal trend studies
2.2.1 Samples taken before 2006 (not considered for risk characterization)
Kärrman et al. (2007) analysed pooled milk samples (25–90 women/year) from different regions in Sweden sampled 1996–2004, for 13 PFASs – PFBS, PFHxS, PFOS, PFDS, PFHxA, PFHpA, PFOA, PFNA, PFDA, PFUnDA PFDoDA, PFOSA and tetrahydro-PFOS (not included in this risk assessment). The result showed that PFOS was detected at the highest levels followed by PFHxS and PFNA. The temporal trend show a possible decline in the levels of
SWEDISH ENVIRONMENTAL PROTECTION AGENCY REPORT 6513
Environmental and Health Risk Assessment of Perfluoroalkylated and Polyfluoroalkylated Substances (PFASs) in Sweden
29
2.2.2 Samples taken after 2006 (considered for risk characterization)
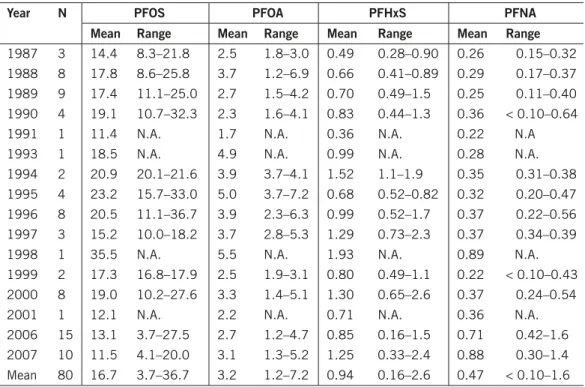
Jönsson et al. (2009) analysed the levels of PFHxS, PFOS, PFOA, PFNA and PFOSA in 80 plasma samples (n = 1–15/group) from females in Lund with an average age of 48 years, taken between 1987 and 2007 and stored in a bio bank. The levels of PFOS were highest of the compounds tested during that time-period, followed by PFOA, PFHxS and PFNA (Table 9). The levels of PFOSA were below LOD for all samples. Although difficult to draw firm conclusions due to small number of samples at some time-points, the authors concluded that over the whole time-period the levels of PFOS was decreasing, the levels of PFNA and PFHxS increasing, and that no temporal trend could be observed for PFOA. However considering the temporal trends from 2000 onwards, no increasing trend for PFHxS can be identified for that time-period.
Table 9. mean levels of PfOS, PfOA, PfnA and PfHxS in (ng/ml) plasma sampled in females from lund between 1987 and 2007. Source: Jönsson et al (2009).
year n PfOS PfOA PfHxS PfnA
mean range mean range mean range mean range
1987 3 14.4 8.3–21.8 2.5 1.8–3.0 0.49 0.28–0.90 0.26 0.15–0.32 1988 8 17.8 8.6–25.8 3.7 1.2–6.9 0.66 0.41–0.89 0.29 0.17–0.37 1989 9 17.4 11.1–25.0 2.7 1.5–4.2 0.70 0.49–1.5 0.25 0.11–0.40 1990 4 19.1 10.7–32.3 2.3 1.6–4.1 0.83 0.44–1.3 0.36 < 0.10–0.64
1991 1 11.4 N.A. 1.7 N.A. 0.36 N.A. 0.22 N.A
1993 1 18.5 N.A. 4.9 N.A. 0.99 N.A. 0.28 N.A.
1994 2 20.9 20.1–21.6 3.9 3.7–4.1 1.52 1.1–1.9 0.35 0.31–0.38
1995 4 23.2 15.7–33.0 5.0 3.7–7.2 0.68 0.52–0.82 0.32 0.20–0.47 1996 8 20.5 11.1–36.7 3.9 2.3–6.3 0.99 0.52–1.7 0.37 0.22–0.56 1997 3 15.2 10.0–18.2 3.7 2.8–5.3 1.29 0.73–2.3 0.37 0.34–0.39
1998 1 35.5 N.A. 5.5 N.A. 1.93 N.A. 0.89 N.A.
1999 2 17.3 16.8–17.9 2.5 1.9–3.1 0.80 0.49–1.1 0.22 < 0.10–0.43 2000 8 19.0 10.2–27.6 3.3 1.4–5.1 1.30 0.65–2.6 0.37 0.24–0.54
2001 1 12.1 N.A. 2.2 N.A. 0.71 N.A. 0.36 N.A.
2006 15 13.1 3.7–27.5 2.7 1.2–4.7 0.85 0.16–1.5 0.71 0.42–1.6
2007 10 11.5 4.1–20.0 3.1 1.3–5.2 1.25 0.33–2.4 0.88 0.30–1.4
Mean 80 16.7 3.7–36.7 3.2 1.2–7.2 0.94 0.16–2.6 0.47 < 0.10–1.6 N.A. = Not applicable.
Figure 2. Temporal trend for PFOS (A) and PFHxS (B) in human composite milk samples from different regions in Sweden 1996–2004. Source: Kärrman et al. (2007).
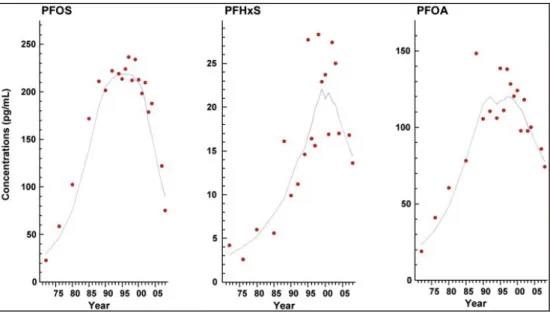
Sundström et al. (2011a) measured the concentrations of PFOS, PFHxS and PFOA in pooled human milk samples (n = 18–116) obtained from mothers in Stockholm between 1972 and 2008. The results showed that PFOS was the predominant PFAS, followed by PFOA and PFHxS (Figure 3). All three analytes showed statistically significant increasing trends from 1972 to 2000, with concentrations reaching a plateau in the 1990s. PFOS and PFOA showed statistically significant decreasing trends from 2001 to 2008. In 2008, the con-centrations of PFOS, PFOA and PFHxS were 0.075 ng/ml, 0.074 ng/ml and 0.014 ng/ml, respectively.
Glynn et al. (2011) investigated temporal trends of nine perfluorinated carboxylates (PFHxA, PFHpA, PFOA, PFNA, PFDA, PFUnDA, PFDoDA, PFTrDA, PFTeDA), four sulfonates (PFBS, PFHxS, PFOS, PFDS) and PFOSA in pooled blood serum from nursing primipara women in Uppsala between 1996 and 2010. The result showed that PFOS, PFHxS and PFOA were the dominant PFAS in the samples (Table 10). There were diverging temporal trends of the studied PFASs, with some congeners showing increasing levels during the study period, whereas others showed decreasing or unchanged levels (Figure 4). The authors concluded that increasing trends was observed for PFBS, PFHxS, PFNA and PFDA, whereas decreasing trends was observed for PFOS, PFDS, PFOSA and PFOA. No significant increasing or decreas-ing trends were observed for PFHpA and PFUnDA. The levels of PFHxA, PFDoDA, PFTrDA and PFTeDA were all below their respective LODs.
For a summary of the human biomonitoring data for the respective congeners in serum that are used for risk characterization and trend analysis of individu-als exposed indirectly via the environment see Table 11. For a summary of breast milk data see Table 12.
SW E DI S H E N V IR O N M E N TA L P R O T E C T IO N A G E N C Y R E P O R T 6 5 1 3
Environmental and Health Risk Assessment of Perfluoroalkylated and Polyfluoroalkylated Substances (PF
ASs) in Sweden
31
Table 10. range of PfASs concentrations (ng/g fresh weight) in 36 pooled samples of serum from first-time mothers in uppsala. Source: glynn et al. (2011).
year n PfbS PfHxS PfOS PfdS fOSA PfHpA PfOA PfnA PfdA PfundA
1996 3 < 0.013–0.021 1.7–2.5 22.7–27.3 0.042–0.26 0.51–0.79 0.075–0.084 2.2–2.9 0.41–0.54 0.18–0.24 0.18–0.23 1997 3 < 0.013–0.029 1.6–2.4 20.3–24.8 0.09–0.15 0.44–0.61 0.080–0.11 2.3–3.1 0.28–0.47 0.25–0.26 0.17–0.29 1998 3 < 0.0130.019 1.2–2.2 20.2–23.1 0.021–0.17 0.41–0.51 0.073–0.14 2.2–2.7 0.42–0.47 0.22–0.25 0.18–0.24 1999 3 < 0.013–0.013 1.8–3.0 20.0–23.0 0.020–0.046 0.51–0.58 0.056–0.12 2.4–3.1 0.33–0.43 0.15–0.19 0.16–0.29 2000 2 < 0.013–0.018 2.5–3.1 18.7–22.0 0.048–0.052 0.36–0.44 0.063–0.094 2.5–2.7 0.38–0.41 0.19–0.19 0.22–0.22 2001 1 0.017 2.0 28.1 0.057 0.57 0.11 3.1 0.65 0.29 0.35 2002 3 < 0.013–0.025 2.3–3.1 17.0–23.2 0.037–0.064 0.19–0.30 0.079–0.13 2.2–3.0 0.38–0.53 0.20–0.30 0.25–0.30 2004 3 < 0.013–0.029 1.9–3.9 13.6–16.6 0.037–0.052 0.07–0.21 0.097–0.107 2.1–2.2 0.46–0.53 0.29–0.33 0.20–0.33 2006 3 0.033–0.069 3.3–5.4 10.7–16.5 0.025–0.043 < 0.040–0.10 0.080–0.093 1.7–2.1 0.45–0.61 0.27–0.31 0.19–0.26 2007 3 0.026–0.037 3.3–4.8 8.8–18.3 0.022–0.057 0.056–0.078 0.064–0.090 1.4–2.4 0.54–0.81 0.22–0.32 0.20–0.27 2008 3 0.052–0.065 4.0–5.2 9.3–11.1 0.021–0.039 < 0.040–0.049 0.058–0.11 1.7–2.6 0.53–0.92 0.21–0.43 0.23–0.29 2009 3 0.054–0.094 4.2–6.2 6.6–7.5 0.024–0.037 < 0.040 0.080–0.12 1.6–2.1 0.74–0.80 0.29–0.39 0.29–0.31 2010 3 0.074–0.108 5.6–8.5 5.0–6.4 0.011–0.035 < 0.040 0.084–0.14 1.6–2.2 0.62–1.0 0.31–0.48 0.21–0.35
Figure 4. Concentrations of perfluorinated alkyl sulfonates in pooled samples (N=36) of blood serum from first-time mothers in Uppsala sampled between 1996 and 2010. The bigger red dots represent the geometric means for the pooled samples for each year and the black horizontal lines
SWEDISH ENVIRONMENTAL PROTECTION AGENCY REPORT 6513
Environmental and Health Risk Assessment of Perfluoroalkylated and Polyfluoroalkylated Substances (PFASs) in Sweden
33
Table 11. Summary table of Swedish human serum biomonitoring data from key studies that will be used for the risk characterization of individuals exposed indirectly via the environment (letters marked in bold), or for temporal trend analysis based on levels from 2000 and onwards. Selected levels represent the highest levels at the latest time-point in a temporal study and/or from a sample being no more than 5 years old.
congener Serum level
(ng/ml) Sampling year Population reference Temporal trend analysisTrend conclusion
PFBS 0.108 2010 Nursing mothers Glynn et al., 2011 ↑ Levels increasing PFHxS 8.50 2010 Nursing mothers Glynn et al., 2011 ↑ Levels increasing
PFOS 27.5 6.44 204 2006 2010 2009 General population Nursing mothers Highly exposed Jönsson et al., 2009 Glynn et al., 2011 Hovgard et al., 2009 ↓ ↓ N.A. Levels decreasing
PFOSA < 0.040 2010 Nursing mothers Glynn et al., 2011 ↓ Levels decreasing PFDS 0.035 2010 Nursing mothers Glynn et al., 2011 ↓ Levels decreasing PFHxA < 0.22a 2007 General population Ericson et al., 2008 N.A. –
PFHpA 0.135 2010 Nursing mothers Glynn et al., 2011 ↔ Levels unchanged
PFOA 5.2 2.17 2007 2010 General population Nursing mothers Jönsson et al., 2009 Glynn et al., 2011 ↔ ↓ Levels decreasing PFNA 2.6 1.0 2009–2010 2010 General population Nursing mothers Jönsson et al., 2010 Glynn et al., 2011 N.A. ↑ Levels increasing PFDA 0.70a 0.482 2007 2010 General population Nursing mothers Ericson et al., 2008 Glynn et al., 2011 N.A. ↑ Levels increasing PFUnDA 0.83 0.353 2009–2010 2010 General population Nursing mothers Jönsson et al., 2010 Glynn et al., 2011 N.A. ↔ Levels unchanged PFDoDA < 0.03 2007 General population Ericson et al., 2008 N.A. –
PFTrDA < 0.15 2010 Nursing mothers Glynn et al., 2011 N.A. – PFTeDA < 0.04 2007 General population Ericson et al., 2008 N.A. – 6:2 FTSA < 1.82 2007 General population Ericson et al., 2008 N.A. –
a=converted from whole blood to serum levels using a factor of 2 according to Ehresman et al
(2007). N.A. = Not available.
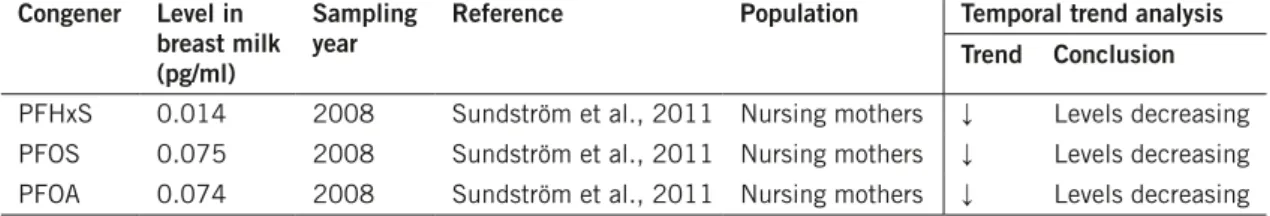
Table 12. Summary table of Swedish human breast milk biomonitoring data and temporal trends. congener level in
breast milk (pg/ml)
Sampling
year reference Population Temporal trend analysisTrend conclusion
PFHxS 0.014 2008 Sundström et al., 2011 Nursing mothers ↓ Levels decreasing PFOS 0.075 2008 Sundström et al., 2011 Nursing mothers ↓ Levels decreasing PFOA 0.074 2008 Sundström et al., 2011 Nursing mothers ↓ Levels decreasing
2.3 Occupational exposure
Nilsson et al. (2010) performed a study during 2007–2008 on eight Swedish and international ski waxing technician’s exposure to PFASs from fluori-nated wax fumes. The technicians were employed by the Swedish and the US national cross-country ski teams and applied fluorinated ski wax for approxi-mately 30 hours/week. Levels of eight perfluorocarboxylates – PFBA, PFPeA, PFHxA, PFHpA, PFOA PFNA, PFDA and PFUnDA, and three
perfluorosul-fonates – PFBS, PFHxS, and PFOS, were analysed in monthly whole blood samples before the season, during the season, and during a 5 month post-sea-son period. The result showed that among the PFASs detected in all samples, PFOA was detected at highest levels, followed by PFNA, PFOS, PFDA, and PFUnDA (Table 13). Among the PFASs, not detected in all samples, PFHpA was detected at highest levels, followed by PFHxA, PFHxS, PFBA, PFPeA and PFBS. Significant correlations were found between the number of working years and levels of perfluorocarboxylates, but no correlations were found for perfluorosulfonates.
Table 13. levels of PfASs in whole blood samples (ng/ml) from Swedish and international ski waxing technicians during 2007–2008. Source: nilsson et al. (2010).
congener PfOA PfdA PfnA PfOS PfundA PfHpA
Range 4.8–535 0.87–24 0.86–163 0.28–27 0.11–2.8 < 0.37–20
congener PfHxS PfbA PfHxA PfPeA PfbS
Range < 0.30–4.3 < 0.08–1.1 < 0.07–12 < 0.06–0.14 < 0.02–0.04
For a summary of the human biomonitoring data for the respective congeners in serum that is used for risk characterization of occupationally exposed indi-viduals see Table 14.
Table 14. Summary table of Swedish human serum biomonitoring data from key studies that will be used for the risk characterization of occupationally exposed individuals based on nilsson et al. (2010). for those congeners where no serum measurements were available, values from people exposed indirectly via the environment have been used (Table 11).
congener Serum level
(ng/ml) Sampling year reference
PFBS 5.6a 2007–2008 Nilsson et al., 2010
PFHxS 8.6a 2007–2008 Nilsson et al., 2010
PFOS 54a 2010 Nilsson et al., 2010
PFOSA < 0.040b 2010 Glynn et al., 2011
PFDS 0.035b 2010 Glynn et al., 2011
PFBA 2.2a 2007–2008 Nilsson et al., 2010
PFPeA 0.28a 2007–2008 Nilsson et al., 2010
PFHxA 24a 2007–2008 Nilsson et al., 2010
PFHpA 40a 2007–2008 Nilsson et al., 2010
PFOA 1070a 2007–2008 Nilsson et al., 2010
PFNA 326a 2007–2008 Nilsson et al., 2010
PFDA 48a 2007–2008 Nilsson et al., 2010
PFUnDA 5.6a 2007–2008 Nilsson et al., 2010
PFDoDA < 0.03b 2007 Ericson et al., 2008
PFTrDA < 0.15b 2007 Ericson et al., 2008
PFTeDA < 0.04b 2007 Ericson et al., 2008
6:2 FTSA < 1.82b 2007 Ericson et al., 2008
a = converted from whole blood to serum levels using a factor of 2 according to Ehresman et al.
(2007).