I
N T E R N A T I O N E L L AH
A N D E L S H Ö G S K O L A NHÖGSKOLAN I JÖNKÖPING
Uppköp &
börsutveckling
En studie om antalet bud, premier och betalningssätten är relaterade till
OMXS index
Kandidatuppsats inom Finansiering Författare: Antar, Joyce
Gholamifar, Donya Viberg, Robert Handledare: Österlund, Urban
Jönköping University
Acquisitions &
Market Performance
A study of the relation of takeover bids, premiums, and financing
meth-ods to the OMXS index
Bachelor’s thesis within Finance Author: Antar, Joyce
Kandidatuppsats inom finansiering
Titel: Uppköp & börsutveckling – En studie om antalet bud, premium och betalningssätt relaterat till OMXS index
Författare: Antar, Joyce, Gholamifar, Donya, Viberg, Robert Handledare: Österlund, Urban
Datum: 2005-12-15
Ämnesord fusioner & uppköp, premium, bud, finansiering, OMXS index
Sammanfattning
Vetenskapligt problem: För att ett företag ska kunna bibehålla konkurrenskraft, långvarig utveckling är ett måste. Växande företag har generellt två val: antingen expandera internt, känt som organisk tillväxt, eller externt genom uppköp och sammanslagningar. Det är allmänt erkänt att i priset som betalas vid ett uppköp är mycket högre än det fastställda marknadsvärdet innan budet. Detta kallas för premium. Vidare finns det flera sätt att finansiera uppköpen, till exempel med kontanta medel eller med egna aktier. Tidigare forskning inom detta område har slagit fast att uppköp och sammanslagningar följer börsutvecklingen, likaså gör de betalda premium. Grundat på detta gör författarna av den här uppsatsen ett antagande att när det förekommer högkonjunktur och börsen går väldigt bra kommer antalet uppköpsbud att öka, och på motsvarande sätt borde premium öka. En ytterligare tes är att betalningssättet också följer börsutvecklingen.
Syfte: ”Det generella målet för denna uppsats är att undersöka uppköp på den Svenska marknaden för
att bedöma om det finns en relation mellan OMX Stockholm index och antalet uppköpsbud, tillika uppköprspremien och betalningssätt.”
Metod: En enkel regressionsanalys kommer att användas för att undersöka om det finns ett samband mellan OMX Stockholm index och antalet bud, där bud kommer vara den beroende variabeln och OMX Stockholm index är den självständiga variabeln. På detta sätt kunde eventuellt signifikanta tidsförskjutningar uppfattas. Detta görs p.g.a. att det tar en viss tid att planera ett uppköp till att lägga ett offentligt bud. Samma regressionsmodell användes på de två följande frågorna; om premierna påverkas av börsindex och hur uppköpen var finansierade. En tioårsperiod valdes för undersökningen, 1994 till 2004, för att kunna inkludera åtminstone en högkonjunktur och en lågkonjunktur. Den underliggande datan är av sekundär typ och därmed används en kvantitativ metod.
Resultat: Författarna yrkar på att det finns en relation mellan uppköpsbud och hur börsmarknaden utvecklas. Detta visar att det viktigta beslutet att genomföra ett uppköp eller sammanslagning kanske inte är helt rationellt genomtänkt som förespråkas. Istället är den påverkad av företagets omgivning, där OMX Stockholm index är en del av det. Inget statistiskt bevis kunde visa att premier ökar när börsen går upp och vice versa.. Inte heller kan betalningssätten kopplas till OMX Stockholm index. Därmed kan inte denna uppsats stödja de tidigare studier som erhållit en positiv korrelation mellan dem.
Title: Acquisitions & Market Performance – A study of the relation of bids, premiums, and financing methods to the OMXS index
Author: Antar, Joyce, Gholamifar, Donya, Viberg, Robert
Tutor: Österlund, Urban
Date: 2005-12-15
Subject terms: mergers & acquisitions, corporate acquisitions, premium, bids, OMXS index
Abstract
Scientific problem: In order to maintain a competitive position in the market, companies need to create an environment of sustained development. Growing companies basically have two choices: expand internally, known as organic growth, or expand externally by a merger or acquisition (M&A). It is widely known that in almost all acquisitions the price paid by the acquiring firm tends to be much higher than the market value of the target firm before the bid, this is called an acquisition premium. There are different ways of financing an acquisition, for example with cash or stock. Previous research within this topic have concluded the M&As follow the market, as well as premiums. Therefore, an assumption made by the authors is that when there is a boom in the market, the stock exchange quota-tion takes a certain movement and the number of acquisiquota-tions that are made increases, as well as the premiums paid, and further to check if the means of payment changes whether there is a bull or bear market.
Purpose: “The general aim of this thesis is to examine acquisitions on the Swedish market in order to
estimate the relation between the OMXS index and the number of acquisition bids, the acquisitions pre-mium and the means of payment.”
Method: To investigate whether a relation between the OMXS and the amount of take-over bids, simple regression analyses was the preferred model, having the bids as being de-pendent upon market performance of the OMXS index. This way, any significant lag ef-fect, the time it takes for a bidder to present a bid offer, could be recognized and used as a benchmark. This model was carried on to the remaining questions as well; whether premi-ums are affected by the stock market, and which way the acquisitions was financed, cash or stock. The time period selected for data collection was 1994 to 2004, allowing the authors a wide enough time-span to interpret at least one bull, and one bear market. The model will be based upon secondary data of market quotes and a quantitative approach will be util-ized.
Results: The authors claim that a relation between the number of acquisition bids and market movement does exist. This evidence shows that an important decision as the one of deciding whether or not to merge or acquire another firm, might not be as rational as tho-ught. Instead, it is influenced on the environment around it, with the OMXS index as one of them. When it comes to the two remaining questions, if premiums and means of pay-ment are affected by the OMXS index, the obtained answers do not provide a positive
rela-Table of contents
1 Introduction ... 4
1.1 Background ... 4 1.2 Problem statement ... 6 1.3 Purpose... 7 1.4 Delimitations... 7 1.5 Basic method ... 8 1.6 Literature study... 102 Frame of Reference ... 11
2.1 Market Efficiency ... 112.2 Bull- and bear markets ... 11
2.3 Methods of acquisition... 14 2.3.1 Merger or Consolidation ... 15 2.3.2 Acquisition of Stock ... 15 2.3.3 Acquisition of Assets... 16 2.3.4 Classifications of acquisitions ... 16 2.4 Synergy ... 17 2.4.1 Synergy foundations ... 17 2.4.2 Premium ... 18
2.4.3 Financing the transaction... 19
2.5 Results from previous research... 19
3 Method ... 21
3.1 Methodological approach ... 21
3.1.1 Primary and secondary data... 21
3.1.2 Induction, deduction, and abduction ... 22
3.2 Mode of procedure ... 22
3.2.1 Population... 22
3.2.2 Data selection ... 22
3.2.3 Data collection ... 23
3.3 Statistical method ... 25
3.3.1 Multiple regression analysis and autocorrelation ... 25
3.3.2 Simple regression analysis ... 26
3.4 Reliability and Validity ... 29
4 Empirical findings and analysis ... 31
4.1 Number of bids and the OMXS index ... 31
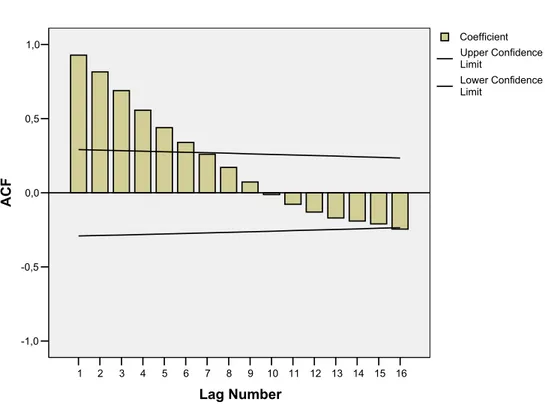
4.1.1 Autocorrelation... 31
4.1.2 Simple regression analysis ... 32
4.1.3 Analysis ... 34
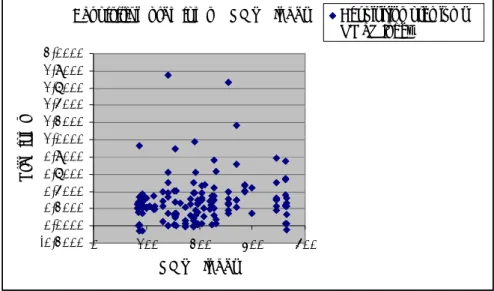
4.2 Acquisition premiums and the OMXS index ... 36
4.2.1 Analysis ... 37
4.3 Means of payment and the OMXS index... 38
4.3.1 Analysis ... 39
5 Conclusion... 41
5.1 Final conclusion... 41
Figures
Figure 1-1 M&A outbreak, 2005. ... 5
Figure 1-2 The Process for conducting the study... 9
Figure 2-1 Bull- and Bear markets in Sweden (Konjunktursinstitutet.se, 2005)13 Figure 4-1 Comparison OMXS & Number of bids 1994-2004 ... 31
Figure 4-2 Autocorrelation analysis - OMXS index... 32
Figure 4-3 Scatter plot, Acquisition premiums & OMXS index. ... 37
Tables
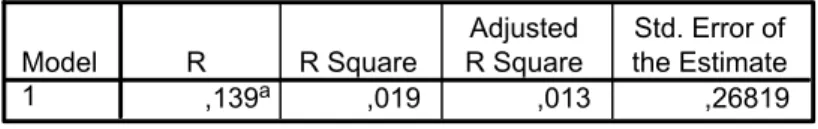
Table 2-1 Characteristics of Bull and Bear Markets (Fontanills, 2001 p.115).12 Table 4-1 Simple regression analysis - Question 1. ... 33Table 4-2 Model summary from SPSS - Question 2. ... 36
Table 4-3 Simple regression analysis - Question 2. ... 36
Table 4-4 Model summary from SPSS - Question 3. ... 39
Table 4-5 Simple regression analysis - Question 3. ... 39
Equations
Equation 1-1 Synergy (Ross et al., 2005, p. 802)... 5Equation 3-1 Acquisition premium (Cash)... 24
Equation 3-2 Acquisition premium (Stocks) ... 24
Equation 3-3 Simple linear regression model (random and non-random components), (Aczel & Sounderpandian, 2006). ... 26
Equation 3-4 Degrees of freedom ... 28
Appendices
Appendix A: Articles for A-list ... 47Appendix B: Articles for O-list... 51
Appendix C: Acquisitions – Target firms on A-list... 57
Appendix D: Acquisitions – Target firms on O-list ... 59
Appendix E: Non - response ... 62
Appendix F: Number of bids... 64
Appendix G: Number of bids & OMXS Index; Question 1 ... 65
Appendix H: Autocorrelation analysis OMXS index... 66
Appendix I: Simple regression analysis – Question 1 ... 67
Appendix J: Premium & OMXS Index – Question 2 ... 69
Appendix K: Means for payment & OMXS Index – Question 3 ... 72
Appendix L: Simple regression analysis: Is there a relation between the means for payment and the acquisition premium? ... 76
1
Introduction
In this chapter the authors will introduce the reader to the background of the subject studied in this thesis. Furthermore, a discussion of the problem and a formulation of the purpose will be given. This section will conclude with an introduction to the method and the literature choice.
1.1
Background
In order to maintain a competitive position in the market, companies need to create an en-vironment of sustained value creation. This can be achieved through growth. Growing companies basically have two choices: expand internally, known as organic growth, or ex-pand externally by a merger or acquisition (M&A), also called inorganic growth. According to Hitt (2001), the later mentioned approach has clearly become one of the most important strategies in the new millennium.
Mergers and acquisitions have existed ever since the beginning of 19th century, when the first industrial corporations began (Rydén, 1971). According to Rydén, there are no statis-tics available about the M&As in Sweden for that time, but one can assume that the strate-gies were applied by Swedish companies as well. During the last 15 years, mergers & acqui-sitions have increased exponentially. In 1998 and 1999 there were more M&As around the world than ever before. Many of them were mega mergers1 but many small and medium sized enterprises (SMEs) were also merged or acquired. As the stock markets reached their peak in March 2000, the mergers and acquisitions started declining (Weston, 2001). Ac-cording to the Swedish business paper, Affärsvärlden (2005), when the stock market prices increases, meaning that it is a bull market, companies rush to merge or acquire other com-panies while they tend to stay away from these activities when the stock prices are decling. In an article published in 1995 it was stated that if the stock market prices keep in-creasing, the number of listed companies on the Stockholm Stock exchange (hence OMXS) will decrease the same year as a result of the acquisitions.
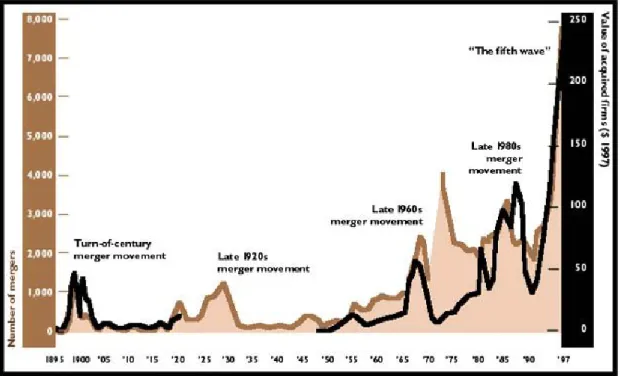
The present mergers and acquisitions are a part of what is called the fifth merger move-ment (Figure 1-1). This merger movemove-ment started in 1993 and is characterized by strategic mega mergers. Also, the fifth merger movement has been the result of a desire to achieve economies of scale and/or scope and market power in order to increase competitiveness in global markets (Weston, 2001). Unlike those of the 1980s, the current mergers are financed primarily with corporate stock, not borrowed money. Today, M&As are an everyday event in any business market, anywhere in the world, based on long-term strategic and economic motives. The phenomenon of acquisitions as a way of growing is unmistakably becoming a corporate-strategy of the highest priority (Hitt, 2001).
Introduction
Figure 1-1 M&A outbreak, 2005.
Usually when a company is mature, the growth will fall and the company will lose market shares to its competitors (Dagens Industri, 2003). Through a merger or acquisition the company can for example, get access to new markets, knowledge and technology (Bild, 1998).
AstraZeneca is one example of a Swedish-British merger, carried out in 1999. Together, Astra and Zeneca built one of the largest medical companies in the world. The two busi-nesses complemented each other and the merger meant a world leading product- and R&D program (Affärsvärlden, 1999).
Synergy effects are the most common motive for mergers and acquisitions. These effects appear when two companies together, perform better than what they would have sepa-rately. As shown in equation 1-1, when the value created by company A and B together is greater than the value created by company A plus company B, there exist synergies (Ross, Westerfield & Jaffe, 2005).
V
AB> V
A+ V
BEquation 1-1 Synergy (Ross et al., 2005, p. 802).
Moreover, synergy effects are important when deciding the price for an acquisition. Often the acquiring company pays a premium price to the acquired firm (Ross et al, 2005). The difference between the price for acquiring a target firm versus the estimate made of its value before the acquisition is called the premium (Burton & Kaliski, 2001). If the synergy effects exceed this premium there will be an increase in the shareholder value (Hitt, 2001). According to Bild (1998), ultimately, the underlying motive for any merger or acquisition is to create an increase in shareholder value.
1.2
Problem statement
According to Heinstedt, when there is a boom in the market, the stock – exchange quota-tion takes a certain movement and the number of acquisiquota-tions that are made increases (Kvarntorp, 2005).
According to Mueller (2003) merger waves have a clear correlation with the stock market prices and economical activities. This study was conducted on the U.S. market, however similar research has been done in the U.K. and the same results were obtained.
The authors also, have the interest to examine the link between acquisitions and the OMXS index. However, to the author’s knowledge, there are no earlier studies regarding this topic on the Swedish market.
Mergers and acquisitions are an essential route for a great number of companies in Sweden. During the last ten years there have been 165 takeovers of Swedish companies listed on the A-list2 and the O-list3 on the OMXS (Affärsdata, 2005). The OMXS index is an reflection of stock price performance from A-and O-listed companies.
Taking the previous discussion into consideration, the first question the authors want to examine is the following:
Is there a relation between the number of bids and the OMXS index?
This thesis will also focus on the difference between the market value of the target firm and the price paid by the acquiring firm, more specifically, the acquisition premium.
According to Formisano (2003), in almost all acquisitions the price paid by the acquiring firm tends to be much higher than the market value of the target firm before the bid. It is a simple rule, the more money a firm is willing to pay comparing to the market value of the target firm, the more hidden benefits (also called synergies) there seem to be for the acquir-ing firm (Formisano, 2003).
Valuation of the potential synergies is an essential process for any firm, given that it most likely will have a great impact on the price. Factors that contribute to a higher premium other than the synergies are, for example, if there are multiple bidders for a takeover, if the acquisition is a strategy by managers to increase the firms’ dominance in the market or if the acquisition is hostile4 (Hitt, 2001).
Looking at earlier acquisitions on the Swedish market, premiums have reached higher than 100 per cent of the market value of the target firms, and in one particular case it reached as high as 167 per cent. This occurred in 2001 when TMP Worldwide Inc. acquired Jobline International. Jobline, a company that was listed on the O-list on the OMXS, was a leading corporation in online recruitment advertising on the European market. TMP, a company within the same industry, had the desire to expand its corporation into the European mar-ket and was determined to take over Jobline. During 2001, Jobline was making big losses
2A-list: list containing large companies with at least 2000 shareholders and 25% equity owned by the
public (Wramsby & Österlund, 2002).
3O-list: list containing companies with at least 300 shareholders and 10% equity owned by the public
Introduction
and TMP saw this as a great opportunity to make a bid. The reason why the premium was so high is that at the time of the bid, the stock price for Jobline was very low, causing a great difference between the bid price and the market value (Dagens Industri, 2004).
Following the above discussion, the authors want to examine:
Is there a relation between acquisition premiums and the OMXS index?
The methods for payment in an acquisition vary from pure cash to exchange of stock and there are cases where firms pay by combining both cash and stocks. The general rule is that larger acquisition transactions are paid with stocks while a lower amount of money is ex-changed in cash (Weston, 2001).
According to Vindegård, spokesperson at OMXS, when expectations about profits in-crease, the stock market prices will increase as well, since people tend to buy more stocks at this point in time (L. Vindegård, personal communication, 2005-12-09). Gugler, Mueller & Yurtoglu (2005) discuss the fact that firms with overvalued stocks have no other choice than exchanging them with other overvalued stock through, for example, a merger or ac-quisition since any other activity would arise the awareness of the overvalued stocks in the market and an immediate correction will take place. Thus, the final question the authors will examine is the following:
Is there a relation between means of payment and the OMXS index?
The authors find these questions significant since an analysis of the relation between the number of acquisition bids and the condition of the market can shed some light on the in-fluence the stock market has on acquisitions. In addition, examining the link between the premium, the means for payment and the OMXS index will create a greater understanding for the complexity of acquisitions.
1.3
Purpose
The general aim of this thesis is to examine acquisitions on the Swedish market in order to estimate the relation between the OMXS index and the number of acquisition bids, the ac-quisition premiums and the means of payment.
1.4
Delimitations
There are three different methods for a takeover; acquisitions, proxy contests, and going-private transactions (Ross et al., 2005). Acquisitions have three element; merger or consoli-dation, acquisition of stock, and acquisition of assets. This thesis will focus on acquisitions and disregard one of its elements, consolidation and instead limit the research to acquisi-tion of stocks, acquisiacquisi-tion of assets and acquisiacquisi-tion through merger. Furthermore, the scope of this study will be delimited to Sweden and the OMXS. In this specific market only companies in the OMXS A-listan (henceforth referred to as A-list) and O-listan (O-list) will be included. The last delimitation for this study is a time span from 1994 until 2004. This specific period is chosen as it is within the fifth merger movement.
1.5
Basic method
According to Trost (2005), the purpose of a thesis has a decisive influence on which method that should be used. The chosen method will permeate the entire thesis (Ejvegård, 2003). Therefore, a short introduction to the method used in this thesis will be presented in this section.
Patel and Davidson (1994) argue that there are basically two alternative approaches, the qu-alitative and the quantitative approach. The ququ-alitative method provides a deeper knowl-edge than the quantitative method. It is characterized by subjectivity and is based on soft figures that can be analyzed to answer questions about why things are in a specific way. The quantitative method on the other hand is more objective and primarily used to meas-ure different kinds of data, by for example, using samples. Furthermore, this method usu-ally delivers more general conclusions; because details are neglected since a large amount of elements are studied (Hussey & Hussey, 1997).
In order to fulfill the purpose of this thesis the authors will use the quantitative approach. The quantitative data is often seen as reliable data since many users prefer data that is based on large selections (Trost, 2005). In this study, a large number of acquisitions need to be included in the data in order for the authors to draw a general conclusion regarding the dy-namic world of M&As. This means that the authors will only present numerical data and exclude all other qualitative information with emotional nature. The qualitative method does not fit the purpose of this thesis since it according to Hussey & Hussey (1997), is a method that should be used when one wants to explain why something occur. Further-more, the authors will use secondary data and a combination of deductive and abductive approach in order to fulfill the purpose of this thesis.
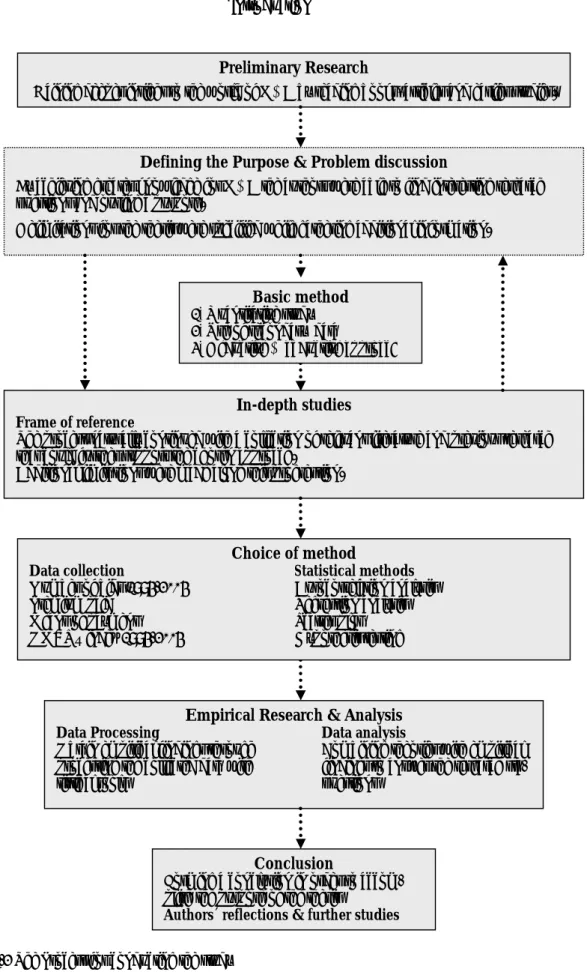
The different stages of the process for conducting this study as well as the choices made by the authors in order to apply accurate methods for collecting and analyzing data are ex-plained in Figure 1-2. Further explanation and justification for the different methods will be presented in the method chapter (Chapter 3) of the thesis.
Figure 1-2 shows that the authors started this study with a preliminary research with refer-ence to the chosen subject, and from this knowledge a problem discussion and a purpose were outlined. At the same time, the authors decided the basic methods that would be used to conduct the study.
While in-depth knowledge about the subject was obtained, the formulations of the problem and the purpose were adjusted and delimitations were formulated in order to make this study as accurate as possible. During this period, the choice of method was formulated lea-ding to a clear idea on how to perform the empirical research. Consequently, the data col-lection began and after compiling the relevant data the authors began analyzing the data by using the chosen statistical methods.
Throughout the process of analyzing the results, the authors used the in-dept knowledge gained from the literature research and a conclusion was drawn in order to accomplish the purpose of this research.
When the study was completed, it was easy to look back at the process in order to reflect upon other paths that could have been chosen. Moreover, ideas regarding further research were gained.
Introduction
Figure 1-2 The Process for conducting the study
Preliminary Research
Gaining deeper insight to the world of M&A by reading books, articles and earlier studies.
Defining the Purpose & Problem discussion
By achieving greater knowledge for M&A the authors were able to find interesting research questions and outline a purpose.
Delimitations for the thesis were specified while gathering additional information.
In-depth studies
Frame of reference
The process naturally continued with a collection of relevant literature and previous research that could further support the chosen approach.
Additional limitations were made along this progression.
Empirical Research & Analysis
Data Processing Data analysis
Obtain empirical findings through Combining theories with empirical processing the collected data with findings to answer the research sta-tistical tools questions
Conclusion
Forming a conclusion in order to accom-plish the purpose of the thesis
Authors´ reflections & further studies
Choice of method
Data collection Statistical methods
Number of bids 1994-2004 Autocorrelation analysis Premium paid Regression analysis Means of payment Scatter plot OMXS – index 1994-2004 Hypothesis testing
Basic method
1) Quantitative study 2) Use of secondary data
1.6
Literature study
Writing a thesis is a process that starts long before anything is put on paper. Before writing this thesis, the authors´ knowledge about M&As was limited, thus, it was needed to ap-proach the subject with an open-mindedness of where to find relevant information.
In order to create a frame of reference, in-depth knowledge about the chosen subject is needed (Figure 1-2). Literature regarding market efficiency, market conditions, methods for acquisitions, synergies, and premiums has been studied.
The authors used textbooks, other research thesis’s, internet web pages, articles, and data-bases to find a suitable theoretical base. It is important to use relevant search words in or-der to find the best available literature (Ejvegård 2003). The ones used most frequently dur-ing the literature study of this thesis are the followdur-ing: M&A, synergy, bull, bear, market ef-ficiency, premium and takeover bid. The database used most often was the Ebrary, a large collection of works in an electronic library. Also, other databases such as Affärsdata, Julia,
Libris, and Diva were used. Moreover, a reference book, Börsguide was used in order to
lo-cate the companies that have been deregistered from the A- and O-list. Most of the infor-mation was found in the library of Jönköping University. Search engines such as Google and
AltaVista were also used and articles about M&As from TT Nyhetsbyrån, Direkt, and Way-maker were studied in order to complete the literature studies with recent journal articles.
Frame of Reference
2
Frame of Reference
This chapter presents theories and figures which will provide the reader with additional knowledge about M&As as well as other theoretical information relevant to the purpose. The chapter will provide a further understanding for the chosen subject and act as a foundation for the collection of empirical data and analy-sis.
2.1
Market Efficiency
The efficient market hypothesis (EMH) implies that the share price mirrors all the informa-tion available in the market. If new informainforma-tion is presented, it will rainforma-tionally and immedi-ately be reflected in the stock price (Fama, 1991). The hypothesis basically says that in an efficient market, abnormal results will be impossible to attain. According to EMH, as prices respond only to information available in the market, and, because all market participants are privy to the same information, no one will have the ability to out-profit anyone else. Thereby, it is not attainable to predict future information, and thus, it becomes impossible to predict future share prices (Fama, 1991).
There are three different classifications of the EMH, which are aimed at reflecting the de-gree to which it can be applied to markets.
1. Strong efficiency – This is the strongest degree. It states that all information in a mar-ket, whether public or private, is accounted for in the stock price, including insider information.
2. Semi-strong efficiency – This form implies that all public information is calculated into
a stock’s current stock price.
3. Weak efficiency – This type claims that all past prices of a stock are reflected in to-day’s share price (Fama, 1991).
Studies concerning the efficiency of markets, especially USA, shows that the American market is in the form of semi-strong efficiency. It is assumed that the Swedish market has great resemblance with the U.S. market and therefore the Swedish market can be regarded to be efficient in the same sense as the U.S. market (Wramsby & Österlund, 2002).
2.2
Bull- and bear markets
Identifying cycles in a financial market is highly important for investors as an analysis of the market condition is used as a tool for foretelling possible changes in price movements (Power, 2001). An investor should stay updated on whether his/her savings, spending and investments are in line with the business cycles, or whether there is inconsistency (Dagnino, 2001).
Cycles in the financial market consist of both upward and downward trends. Bull markets are characterized by a market condition with rising prices for securities (Figure 2-1). This condition also holds when prices are expected to rise. Bull markets are often used in relation to the change in stock markets except it also concerns currencies, commodities and bonds
as well. The price of everything that is traded is a function of a bull market (Burton & Kaliski, 2001).
Economic recovery, economic boom and investor psychology are often followed by a bull market. Investors in a bull market tend to be optimistic about future results and their inten-tion is to profit from this market condiinten-tion. Financial analysts constantly try to predict price changes in the market but this is an almost impossible task as psychological effects from investors usually play a dominant role in the markets (Burton & Kaliski, 2001).
The reverse condition of a bull market is naturally a market with decreasing prices, namely a bear market (Powers, 2001). A bear is an investor who trusts that the market prices are declining and intends to profit from this condition (Burton & Kaliski, 2001).
This investor will either try to seize an opportunity to purchase securities at a low price or enforce an investment that gives the right to sell stocks at a given date and for a right price, namely options or forwards (Plummer, 2003).
When a bull trend is approaching, investors worry about making financial losses. At the same time there is a concern of missing out on profits among investors in a bear market. The greed among the bears prevents them from selling too much of their investment (Plummer, 2003).
Table 2-1 Characteristics of Bull and Bear Markets (Fontanills, 2001 p.115).
In order to understand the economical condition in Sweden during 1994 until 1996, one must recognize the situation between 1990 to 1992. In 1991, the Swedish crown was tied to
Bull Market
Bar graph of daily prices are above 200day moving average.
Interest rates are steady or declining. Unemployment numbers are increasing. Inflation is steady or dropping.
Earnings reports show increases compared to last year, same quarter.
Advance/ decline line is consistently positive (more winners than losers).
Market closes at the high for the day. Strong volume on up days, and rallies for several days in a row.
Trend line is clearly positive.
Bear Market
Bar graph of daily prices are below 200day moving average.
Interest rates are increasing.
Unemployment numbers are dropping. Inflation is on the rise.
Earnings are declining when compared to previous year.
Advance/ decline line is negative (more losers than winners).
Market sells off toward the close, or at the lows for the day.
Weak volume on up days. Big vol. on down days. Trend line is clearly negative.
Frame of Reference
Furthermore, a massive taxation reform was carried out during 1990-1991, contributing to the increase of real rate of interests after tax for the households. The outcome was that the households stopped taking loans, and started paying off their debts, resulting in decreases in demand and increases in unemployment. At this time, the real-estate prices started de-clining and crashed after a short period. When this happened the banks had large credit losses. Many Swedish banks were on the verge of bankruptcy and the budget deficit kept increasing. This is when the Swedish government entered, helping the banks and cleared up the inflation, but they could not resist the market situation and had to let the Swedish crown become flexible in November 1992. From this point forward, the Swedish financial policy was tightened and the system was cleared up and reconstructed until 1996 (Söder-sten, Andersson, Bergman, Ekholm, Eklund, Hakkala, Holmlund, Jacobsson, Kokko, Ly-bek, Norrman, Schön, 2000).
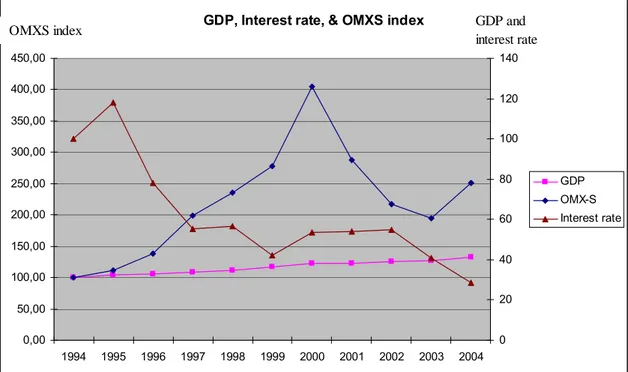
GDP, Interest rate, & OMXS index
0,00 50,00 100,00 150,00 200,00 250,00 300,00 350,00 400,00 450,00 1994 1995 1996 1997 1998 1999 2000 2001 2002 2003 2004 0 20 40 60 80 100 120 140 GDP OMX-S Interest rate
OMXS index GDP and
interest rate
Figure 2-1 Bull- and Bear markets in Sweden (Konjunktursinstitutet.se, 2005)
According to Dagnino (2001) economic growth leads to higher interest rates and this causes a negative effect on stocks. A rise in interest rates leads to a decrease in the growth of money supply and stock prices. As shown in Figure 2-1, this was the case in 1994 until 1997 when the interest rate was very high in the beginning of 1994, and even higher in 1995, before it started decreasing as the OMXS index improved.
When the Asia crises occurred in 1997, the international business cycles were affected re-sulting in some effects on the OMXS index and a decrease in demand (Björklund, 1998). The largest and most recent event in the stock market history was the IT boom and subse-quent crash in the latter part of the 1990’s. A simplified version of the episode is that tech-nological firm’s stocks began to rise abnormally fast, even though most of them had not generated any profit at all. Following this, the hype of all IT companies really began and the performance of the majority of stocks was based on speculation. This, however, were pro-ne to dissolve. And by March 2000, the fall began, and it held on for years until the
begin-ning of 2003, when it started to grow again (Affärsdata, 2001). The progress and decay of the stock market in those years are depicted in Figure 2-1.
Sweden’s economical development is controlled by the international development, but in the short-run it is mainly the European and the American economy that have an effect on the Swedish economy. The international business cycle has during the last ten years been favorable for the Swedish economy. Still, Sweden has not recovered from the earlier loses, and is still on the 13-14th place raking of the 30 OECD-countries (Hägglund, 2004).
During the last ten years, Sweden has had an average economical growth of 2, 9 percent per year. Comparing this number with EU-15, Sweden has exceeded it with 0, 8 percent. Many argue that the high growth is partly because of the fact that Sweden decided not to enter the Monetary Union, while countries like France, Germany, Italy and Spain lost growth doing so (Hägglund, 2004).
Economic growth can be measured by using the gross domestic product (GDP). GDP is the total value of services and goods that are produced in a country during a particular time period plus net exports. The periods vary from a yearly period to quarterly and monthly (Burton & Kaliski, 2001).
There are three diverse methods for measuring GDP. The nominal GDP is the market va-lue of all goods and services that are produced in a country. This is affected by price mo-vements, and another measure for the GDP where the prices are held constant, is the real GDP. The third measure for total output is potential GDP and it consists of the maximum output that can be produced in a country during a given period. The maximum output is calculated without any influence by pressure for rising prices (Dominick, 2003).
According to Nieh (2003), the entire macroeconomic fundamentals share the common trends with M&A activities in the long run. In the short-run, the GDP has the strongest in-terrelationship with M&As, while the stock price takes the second place. Overall, the eco-nomic circumstances influence the waves of M&A.
2.3
Methods of acquisition
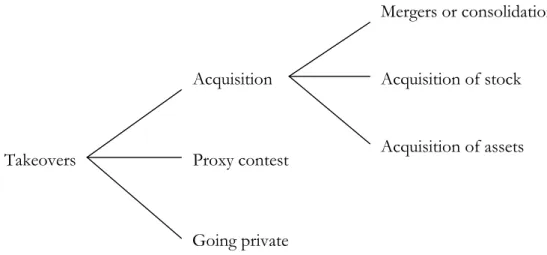
The term takeover is a general and imprecise term referring to the transfer of control of one group of shareholder to another. According to Näringslivets Börskommite (NBK) (2003) rules for public takeovers, normally 90 % is required, but technically, a majority is enough, i.e. 51 %. This can be done through three methods; acquisitions, proxy contests, and going-private transactions (Figure 2-3).
Frame of Reference
Figure 2-3. Acquisition activities (Ross et al. 2005, p. 845).
A proxy contest is an attempt to gain control of a firm by soliciting a sufficient number of stockholder votes to replace existing management (Ross et al. 2005). An example is when PeopleSoft sent proxies to their shareholders, urging them to vote for the boards nominees of management and reject Oracle’s hostile takeover offer (Privata Affärer, 2004). When a firm is going private all of the equity shares of a public firm are purchased by a small group of investors. Often, the group includes members of the current management. This is also called a leveraged buyout (LBO), because a large sum of the money needed to buy up the stocks is usually borrowed, hence the leverage (Ross et al. 2005).
However, the main focus in this study is limited to acquisitions; there are three elementary procedures that a firm can employ when acquiring another firm; (1) merger or consolida-tion, (2) acquisition of stock, and (3) acquisition of assets, depicted in Figure 2-3 (Ross et al. 2005).
2.3.1 Merger or Consolidation
A merger is absorption of one firm by another. The acquiring firm keeps its name and identity, and it attains all of the assets and liabilities of the acquired firm. After a merger, the acquired firm ceases to exist as a business entity (Ross et al. 2005, Olve, 1988).
A consolidation works the same way as mergers, except that a whole new business entity is created. In a consolidation, both firms terminate their previous legal existence and become part of the new firm. The characteristic between the acquired and acquiring firm is insig-nificant (Ross et al. 2005, Olve, 1988).
2.3.2 Acquisition of Stock
Another way to obtain control of another firm is to purchase the firm’s voting stock in ex-change for cash, shares of stock, or other securities. This can be done with the use of a ten-der offer. A tenten-der offer is a public offer to buy shares of the target firm. It is made by one firm directly to the shareholders of the other company. The offer should be communicated to the target firm’s shareholders via press releases and public announcements (Ross et al. 2005, NBK, 2003).
Aspects of choosing the acquisition of stock option: Takeovers Acquisition Proxy contest Going private Mergers or consolidation Acquisition of stock Acquisition of assets
1. No shareholder meetings must be held and no vote is required. If the shareholders do not like the offer, they may reject it and they will not tender their shares.
2. The bidding firm can deal directly with the shareholders of a target firm by using a tender offer. The target firm’s management and board of directors can be circum-vented.
3. Acquisition of stock is often unfriendly (Ross et al. 2005).
In July 1st, 1999, a new regulation regarding companies listed on the OMXS were intro-duced. It stated that if one had less than 40 percent of the votes in a company and acquired stocks that increased the amount of holdings to 40 percent or more, one was obligated to leave a public offer to buy further stocks of the company within 4 weeks. The offer to buy stocks also includes subscription of stocks as well as conversion or other type of acquisi-tions that increase the holdings of shares (OMXS, 2005).
Shareholders, who already had 40 percent of the stocks of a company, when the new regu-lations took effect, were not comprised by this law if they were to buy more stocks and in-crease their assets (OMXS, 2005).
The limit for the obligation to leave a public offer to buy more stocks was decreased to 30 percent in September 1st, 2003. The change of the implementation of the new law this time was that even owners of 30-40 percent of the stocks were affected by the regulations and thus they had to make a public offering in order to buy more stock (OMXS, 2005).
Furthermore, the buyer has one month after the date of purchase to cancel the purchase-agreement if the purchase was done by mistake. The purchase-agreement is cancelled if the buyer sells a percentage of his stocks so that his total holding of shares is less than 30 percent of the votes. In this case the buyer does not need to make a bid for more stocks to other stockholders of the company (OMXS, 2005).
2.3.3 Acquisition of Assets
An additional method of acquisition is by buying most or all of a company’s assets. This accomplishes the same thing as buying the company. However, in this case the target firm does not necessarily cease to exist; it just sells its assets. It is up to the stockholders of the target company to decide whether or not to dissolve the firm (Ross et al. 2005).
2.3.4 Classifications of acquisitions
Acquisitions are typically divided into three classifications. These classes can be used to de-scribe what sort of strategy the acquiring firm relies on for the takeover decision. The first class is the horizontal acquisition, and it is referred to as acquisitions of firms operating within the same industry as the bidder. The firms are competitors. An example could be when an oil company purchases another oil company. The next classification is the vertical acquisition, and it comprises of firms at different steps of the production process. When the bidder and the target firm are not related to each other, it is called a conglomerate ac-quisition. An example could be if a computer firm purchases a food company (Ross et al. 2005).
Frame of Reference
2.4
Synergy
According to Campbell and Goold (1998, p. 133), synergy “refers to the ability of two or more
units or companies to generate greater value working together than they could working apart”. The
atten-tion is to give the acquiring firm gains in two sources: (1) to improve the operating effi-ciency based on economies of scale or scope; and (2) the sharing of one or more skills (Harrison and St. John, 1994).
As synergies are directly related with value creation in an M&A, they are critical to be achieved as soon as possible after the integration of the two firms. It is highly important that the integration of the businesses has been successful and efficient since the synergies derive from the collaboration of the two firms (Hitt, 2001).
For managers, synergies exist when they find ways for the two companies together to cre-ate more value than the sum value they would have crecre-ated as separcre-ate businesses. As for shareholders, the synergies exist when their financial results from the combined firm are greater than what they would have obtained through their independent portfolio diversifi-cation (Weston, 2001).
Having said this, firms must take into consideration that mergers and acquisitions does not always create the greatest value. They must examine the acquisition activity in relation to the value that could be created through another strategy. Even in the abnormal cases where the acquiring firm does not pay a premium, synergies are difficult to achieve. So, when firms pay a premium, often a very high one, the creation of synergies must be great in order to create economic value (Hitt, 2001).
2.4.1 Synergy foundations
According to Hitt (2001), there are four foundations for the creation of synergies. These are (1) strategic fit, (2) organizational fit, (3) managerial fit, and (4) value creation. Although this is four independent foundations, it is the combination and existence of these that will create synergies in the combined firm.
Strategic fit "…refers to the effective matching of strategic organizational capabilities." (Harrison and St. John, 1994, p.180). In order to create synergies that generate competitive advantages and improvement of shareholder capital, the joint firm needs to exist of a combination of firms or businesses that are strong and/ or weak in different business activities. If this is not the case, the new firm will be provided with the same capabilities (or lack of capabili-ties) that the separate firms had, while the scale of the strengths or weaknesses will be greater (Hitt, 2001).
The second foundation, organizational fit, arises when the two firms’ management proc-esses, systems, cultures and structures are fairly alike (Harrison and St. John, 1994). This means that the firms should have characters that are compatible. The importance of this foundation arises since, as mentioned before, synergies can not exist if the firms do not tegrate and the lack of organizational fit oppresses and in some cases even prevent the in-tegration of the two businesses. (Hitt, 2001).
In order to create synergies there is a need for an active management of the acquisition process. These managers should recognize the extent of integration matters and the com-monness of human resource concerns that often occur when occupied in efforts to create synergies (Marks and Mirvis, 1997).
Value creation is the last of the four synergy creation foundations. Basically, the cost asso-ciated with the development and use of synergies must be less than the benefits that can derive from them. These costs can be divided in three categories, (1) purchasing premium, (2) financing the transaction, and (3) integration of the acquired business into the existing organizational structure (Hitt, 2001). Although in this thesis the focus will be on the acqui-sition premium and the means for payment.
2.4.2 Premium
The investment value of a target firm is its value to a specific buyer. It is to recognize the buyer’s attributes and the synergies and other integrative benefits that can be achieved through the acquisition. This value will be different to each potential buyer because of the different synergies that each can achieve through the acquisition. It is important for the well-informed buyer and seller to determine these synergies in advance so that they can ne-gotiate with this knowledge (Clemente and Greenspan, 1998).
The increase in investment value over the company’s fair market value, which is the price at which both buyer and seller agree to do business, is referred to as the control premium. But this term is seen to be misleading. Although the typical buyer does acquire control of the target firm through the acquisition, the premium that is paid is often to achieve the syner-gies that the combination of the two firms will create (Clemente & Greenspan, 1998)
Premiums paid are based on competitive factors, consolidation trends, economies of scale, and buyer and seller motivation. These are facts that again underline the need to carefully understand value and industry trends before negotiations begin (Spilka, 2005).
As stated earlier in this thesis, the premium is calculated by taking the price paid minus the market value of the target firm. In order to work out this calculation, the stock price for the target firm is needed. Usually the stock price that is listed one business day before the bid is used. But in some cases an average of the stock price during 10, 22 or 30 days before the bid is calculated and that value is used instead for comparison with the price paid (Affärs-data, 2005).
2.4.2.1 Valuation risk
Valuation involves translating the expected synergies, for example reduced cost or increase in market share into increased future earnings and cash flows for the firms. Valuation is not a precise science since it is difficult to forecast the expected benefits. Due to this fact, the bidder is exposed to valuation risk. When there is a high valuation risk, the acquirer may pay too much for the acquisition. In other words, the acquisition premium increases due to the valuation risk (Warner, 2002).
The method of paying for the acquisition can decrease the effects of valuation-risk. If the purchase is financed with a share-for-share exchange, any future loss due to errors in valua-tion will be shared with the stockholders. However, on the other hand, if the acquisivalua-tion is financed by cash, the bidder is alone with all losses. The choice of method is also influ-enced by tax concerns and the bidder’s financial structure policy (Warner, 2002).
Frame of Reference
2.4.3 Financing the transaction
When the price for an acquisition is set, the acquiring firm buys the target firm’s stocks by either using cash, debt, exchanging stocks or a combination of cash and stock. Cash is usu-ally used when it is a small transaction or when a large firm is acquiring a smaller firm. When the price is high ($500 million or more) the exchange is naturally done through stocks as it is a more convenient technique for transactions (Weston, 2001).
According to Hitt (2001), although the largest transactions are financed with stocks, cash is a favored means for exchange in acquisitions. During the 1970s, takeovers with cash trans-actions increased with about 30 percent and today it is still the preferred method for pay-ment.
The general assumption is that stock deals used more frequently than cash as these are the ones discussed in the media. However one should remember that the larger takeovers are the ones typically noticed by the media and as mentioned earlier these takeovers use trans-actions of stocks. Nevertheless, these big deals do not represent a large percentage of the total numbers of takeovers (Weston, 2001).
There are a number of factors that need to be considered when choosing a method for ex-change. The most central issues are accounting treatment, tax considerations, financial re-turns to shareholders and managerial control issues (Hitt, 2001).
2.5
Results from previous research
Maule was one of the first to discuss whether the numbers of mergers are related to general economic activity. The study compared two studies made during the periods 1895 – 1904 and 1919 – 1939 and came to the conclusion that there is no relation between the fluctua-tions in the numbers of mergers and business cycles. However, the secondary data used from the study for the first period was proved to be incomplete and biased as there was not enough information needed regarding the mergers. Quarterly merger data could not be used as this was not available for the period 1895 – 1904 and only a comparison of the consolidations could be made (Eis, 1970).
In the book The Corporation, Mueller (2003) discusses the five merger waves and their re-lation to other economical factors. Firstly, it states that mergers come in waves and sec-ondly, it states that all these merger waves have a clear correlation with the stock market prices and economical activities. According to Mueller a proof for this is the Great Crash in stock market prices on Wall Street which was followed by a great crash in the merger ac-tivities. Furthermore, there is econometric work that establishes that stock prices either tend to slightly lead or coincide with the number of mergers. Although these studies have been performed on the U.S market, similar researches has been conducted on the United Kingdom market.
In a study by Gugler et al. (2005) four hypotheses were outlined in order to test merger waves. The first two assumed that managers maximize shareholders’ wealth, mergers gen-erate wealth and that acquirers earn positive abnormal returns. The study failed to confirm these hypotheses. On the other hand, the authors successfully showed that during a stock market boom the shares in a company are overvalued and managers tend to exchange these shares for other overvalued shares of the target firm, and pay a premium to do so. The au-thors discuss the option for the company to instead retiring their debt, or buying other as-sets that are not overvalued. As companies do not do this, an explanation for the behavior
is given. According to the authors, an announcement of a swap of equity for debt or pur-chase of assets would signal that the firm’s shares are overvalued and lead to an immediate market correction. This leaves the firm with no other option than exchanging their over-valued shares with those of other firms. As a conclusion for the study, the authors stated that at some point in time the shareholder optimism begins to rise. In the theories behind why the share prices should rise, there are theories about certain industries or firms that will have a positive effect on the market. So as the market is going towards a bull and com-panies have overvalued shares, firms start to acquire the firms that are behind the boom in the market, creating a merger wave.
Furthermore, Gugler et al. (2005) describes a lag effect for M&As. As discussed previously, when there is a boom in the market companies’ desire to acquire other companies more frequently. The author, however, also stated that a company can not purchase another company overnight. This creates a delay in the merger wave, when comparing it to the stock market prices as the acquiring firms need some time to recognize their target com-pany and place a bid. This effect is called the lag effect and can differ depending on the strength of the boom and the time span between two booms.
Method
3
Method
In this chapter, the first section will present a short discussion about primary and secondary data, following with reasoning for the choice of inductive, deductive, or abductive approach. The second section will give a de-scription of the population, the data selection and the data collection method. Moreover, the statistical meth-ods used will be presented. In the end of the chapter a discussion about the validity and reliability of the re-search will be held.
3.1
Methodological approach
In basic method (section 1.5), a description of the qualitative and the quantitative ap-proaches were given. Furthermore, the authors’ reasoning for the choice of the quantitative approach was presented and the authors stated that secondary data and a combination of the deductive and abduktive approaches will be used. The following section will discuss the underlying motive for the stated choices.
3.1.1 Primary and secondary data
There are two types of data that can be collected; primary data and secondary data. Pri-mary data are information collected specifically for the problem invested by the researcher. This type of data collection will have no problem with the fit of the data since the re-searcher collects data designed to fit the problem (Churchill, 1996). Examples can be per-sonal interviews or surveys. Secondary data is data that already exists and that has been col-lected for another purpose. This kind of data is most commonly since it consists of all writ-ten material in one area of investigation (Churchill, 1996). Examples can be documents, books and published statistics. Secondary data can be used when conducting both qualita-tive and quantitaqualita-tive method (Hussey & Hussey, 1997. According to Churchill (1996), a disadvantage with secondary data is the fit and accuracy of the data.
The secondary data for this thesis is collected from OMX, Börsguide, Scandinavian information
exchange (SIX) and Affärsdata. OMX is the leading provider of market services and solution
for finance- and energy markets in the Nordic and Baltic countries. It exists of two divi-sions; OMX Technology and OMX Exchanges (OMXSgroup.com, 2005). Affärsdata is a business database with historical articles and publications by major newspapers such as
Dagens Nyheter, TT Nyhetsbanken, Affärsvärlden and Waymaker. Börsguide is a reference book
over all the companies in the Stockholm Stock Exchange, The new market (Nya Marknaden) and Nordic growth market- list (NGM- listan). Every company is presented on an own page containing stock history, business ratio, biggest owner and activity (Fi-nansportalen.se, 2005). SIX’s rage is exhaustive regarding financial information within the areas of news, stocks, interests, currency, funds and index, especially for the Nordic market (SIX.se, 2005).
An important fact to take into consideration when choosing to use secondary data is that the information may be biased since the information may have been gathered for another purpose then the one intended. This however is not a concern in this case, since the au-thors intend to use statistical data that have not been processed earlier. The information can at times be meant to be interpreted in a different way than done in this study (Bryman, 2000). The authors have however been aware of this risk and have tried to cross-check the information with other sources when possible.
3.1.2 Induction, deduction, and abduction
The development in scientific methodology is due mainly through two aspects; induction and deduction. An inductive approach is when an occurrence can be generalized, if it has been observed in a number of different cases, and from this way theory is evolved from empirical data. Deduction is where the conclusions of single events are gathered from ear-lier theories (Eriksson & Wiedersheim-Paul, 1999).
There is however, a third approach to consider; abduction. The abductive approach in-volves the starting point to be exerted from an empirically relevant issue. This, however, does not mean that the investigation disregards from those theoretical perspectives that underlies the deductive approach. The combination of both inductive and deductive can denote earlier cases to be used as inspiration to discover and increase the comprehension (Kirkeby, 1994).
The choice of logic in this thesis involves generating a general idea of how M&As is af-fected by market performance. Thus, it is needed to analyze data to find patterns or schemes in a set of observations, and as a result locate a common set of rules that can be applied generally; also it is of the essence to limit the subjectiveness level of the thesis. Thus, the utilized approach will be a combination of deductive and abductive.
3.2
Mode of procedure
As the in-depth study was completed, and the methodological approaches were chosen, the mode of procedure for conducting this study began. Following, the authors will give a de-scription and rationalize around the population, data selection and data collection for the study.
3.2.1 Population
The authors have gathered information regarding all acquisitions made on the A –and O-list on Stockholm’s stock exchange from Börsguide, OMX and Affärsdata for the time period 1994-01-01 to 2004-01-01. The original population contained 165 acquisitions; where 68 were located on the A-list and 97 on the O-list, disregarding companies that entered con-solidations and/or conglomerates and those firms not listed on any of the two stock lists. 3.2.2 Data selection
Since there was limited time for writing this thesis, effort was needed to focus on specific areas in order for the collected data to be reliable and valid. The delimitations are already mentioned in chapter one, but a further explanation is given in this section.
The authors believed that narrowing down the geographical area to a country will make the investigation more relevant, seeing as comparing the data needed between different coun-tries is time-consuming. Also, the risk for the result to be biased is great since the time limi-tation will not allow for a thorough study of the different market conditions. Hence, Swe-den has been chosen for the geographical area of this investigation.
The companies listed on the A- and the O-list were selected since they have a great impact on the OMXS index that is used in this thesis, and also since they are the largest companies
Method
In order to answer the first question of this research “Is there a relation between the number of
bids and the OMXS index?” a time period needs to be set. It would be extensive and hardly
viable to examine an unlimited period of time. The authors believe that in order for the re-sults to be useful the time period should be within the fifth merger movement, since it is the current wave of M&A. Hence, the chosen time span is 1994 until 2004. The authors will look at the date when the first bid was placed since it is on this date the interest for a purchase of the target company was publicly announced.
To be able to answer the second question “Is there a relation between acquisition premiums and the
OMXS index?” the premium paid had to be derived either from press releases or calculated.
No consideration will be given to the dividends since it is paid out on a later date, as well as to debentures5, since they are based on the trustworthiness of the issuer, i.e. it can lead to being worth nothing (Burton & Kaliski, 2001).
3.2.3 Data collection
To accomplish the study’s demands the following information is required:
1. Acquisitions of target firms listed on the A- and the O-list, with bid dates during the period 1994-01-01 to 2004-12-31. This information have to contain:
a) Date of the takeover bid b) Premium paid
c) The used financing method; cash, stock, or both 2. OMXS index data per quarter, 1994-01-01 to 2004-12-31.
To find the bids made 1994 until 2004, the authors reviewed a collection of publications of
Börsguide that ranges from 1994 to 2005. These publications offer (among other
informa-tion) a specific list of companies being deregistrated from the Stockholm stock exchange each year. The list also states why the company was delisted, where only acquisitions were selected for this study.
In addition, the dates of the acquisitions, as well as the names of the target firms, and the acquiring companies are covered there as well. Finally, information on whether the target firm was listed on the A- or the O-list is provided. This data was later checked with infor-mation from OMXS and any discovered errors were corrected. In order to find out the ac-quiring company’s original bid date for each acquisition, articles from Affärsdata were used (Appendix A & B) and all the dates were checked again with OMXS’s database. Bid dates for four companies could not be found, and after contacting them and other organizations or companies that have information regarding these kind of occurrences without any re-sults, the authors decided to treat them as non-response and therefore excluded them from the study. Additional information regarding non response is provided in appendix E.
From Affärsdata, further information was gathered to locate the premiums paid by the pur-chasing companies and the means for payment. The authors read through the various arti-cles in order to find relevant information. List of the titles of the artiarti-cles, dates and sources are provided in Appendix A and B.
5 A certificate of debt, which has no collateral. It is backed by the credit of the borrower, not by physical
In the majority of articles, the needed premiums, calculated from the stock prices on the business day before the bid was announced, were already available and further calculation was thus not needed. For the remaining posts, when the takeover was financed with cash, the authors examined the stock price of the target firm the day before the bid was an-nounced, and then, compared it to the official bid price. In cases were the takeover were financed through stocks, the authors calculated the premium by comparing the stock prices of the target- and the acquiring company the day before the bid with the bid price. The for-mula for calculating the takeover premium percentage, when paid with cash is: bid price minus stock price of target firm on the day before the bid, divided by the stock price of the target firm on the day before the bid (Equation 3-1).
(PO– PB )/ PB
Equation 3-1 Acquisition premium (Cash)
Where,
PO = Offer price
PB = Stock price of target firm before public offer
The formula for calculating the takeover premium percentage, when paid with stocks is: the acquiring firm’s stock price before the bid is placed times the number of offered stocks minus the target firm’s stock price before the bid date times the number of stocks ex-changed, divided by the target firm’s stock price before the bid date times the number of stocks exchanged (Equation 3-2).
(SA * XA– ST * XT) / (ST * XT)
Where,
SA = The stock price of the acquiring firm before the bid is placed XA = The number of offered stocks by the acquiring firm
ST = The stock price of the target firm before the bid is placed XT = The number of stocks exchanged
Equation 3-2 Acquisition premium (Stocks)
14 non-responses were discovered for the acquisitions premiums during the data collection process. Also here, efforts were made to contact other sources in order to fill in the gaps. Organizations like SIX, OMXS, Aktiespararna, Affärsvärlden, Börsdata, Fondbörsen and the ac-quiring companies in question were contacted. As a result many premiums were found and the non-response in this section decreased from 35 to 14 for the sample to analyze ques-tion two (see Appendix C, D & E).
Regarding the means for payment (cash, stock or a combination of both), information was obtained from the articles (Appendix A & B) as well. No additional non responses were added to this sample.
Method
2. Acquisitions of target firms listed on the O-list (Appendix B) 3. Number of bids made per quarter and year (Appendix F).
The OMXS index for the period 1994 – 2004 was obtained by contacting the information section at OMXS. Henrik Acklen, the information adviser at OMXS, emailed the informa-tion needed (Appendix G). The received file was originally a monthly index ranging from 1994 –until 2004 and consequently the authors calculated a mean index for each quarter. After the data collection was completed, the authors excluded two acquisitions that were completed in 1994 since the bids were placed in 1993 and consequently these were not in the time span of this research. If they would not have been excluded the data would have been biased since all the bids in 1993 are not included. Moreover, all the bids that were placed in 2004 are included, even if the acquisition were completed the following year. When the authors had compiled the necessary data, statistical tools were needed in order to conduct empirical research and analyze the results (Figure 1-2). Statistical tools are the key element when dealing with quantitative data and to draw meaningful inferences that lead to accurate and significant conclusions (Aczel & Sounderpandian, 2006).
3.3
Statistical method
In order to fulfill the purpose of this thesis and;
“...estimate the relation between the OMXS index and the number of acquisition bids, the acquisition pre-miums and the means of payment.”
a statistical tool that measures the dependence of one variable to another are needed. More precisely, the authors needed to examine whether the number of bids, the acquisition pre-mium and the means of payment are in any way dependent on the OMXS index. The fun-damental way of investigating the dependence of one variable with another is with a fit straight line through the data (Helsel & Hirsch, 1992). Hence, regression analyses were per-formed. Regression analysis is one of the most important statistical methods in business and economics. It is a formula that describes a real-world situation mathematically, (Aczel & Sounderpandian, 2006), offering an answer to how well the variables in the model are re-lated. There are two types of regression analyses, multiple and simple regressions (Aczel & Sounderpandian, 2006). In this study, simple regression analysis was used. However, an ex-planation for the multiple regression analysis and why it could not be used is given below. 3.3.1 Multiple regression analysis and autocorrelation
In regression analyses, the variable of interest is often dependent on more than just one additional variable. When one wants to conduct a study where several independent vari-ables are expected to influence the dependent variable, a multiple regression analysis should be used (Aczel & Sounderpandian, 2006).
According to G. Shukur, a professor in statistics, (personal communication, 2005-11-25) when analyzing time series data6, such as the OMXS index, one can use the stock market