Determinants of Foreign Direct
Investment in Ireland
Bachelor’s thesis within Economics
Author: Kamilya Baibekova
Anh Nguyen Tran Hoang Head supervisor: Martin Andersson Deputy supervisor: Dimitris Soudis
Bachelor’s Thesis in within Economics
Title: Determinants of FDI. The case of Ireland Author: Kamilya Baibekova, Anh Nguyen Tran Hoang Tutor: Martin Andersson, Dimitris Soudis
Date: 2010-08-13
Keywords: FDI, Ireland, determinants of FDI, Irish Miracle, OLI paradigm
Abstract
Exceptionally high FDI inflows into Ireland have been one of the main resources of Irish rapid economic growth, and earned the country a title of “Celtic Tiger”. The goal of this thesis is to find out the driving sources behind this high inward investment and to examine whether Ireland has truly enjoyed higher amounts of FDI inflows than predicted by the model.
This thesis analyzes the determinants of foreign direct investment in Ireland. The determinants being examined are GDP, GDP per capita, infrastructure, labor productivity, education and trade openness. The analyzed period is from 1997 to 2007 and data is collected for 30 OECD member states. With the help of the pooled regression we were able to obtain the following results: GDP, GDP per pita, infrastructure and education have a significant effect on FDI and FDI per ca-pita inflows. However, labor productivity and trade openness turned out to be less significant in attracting FDI to Ireland. Moreover, based on the results, infrastruc-ture had an unexpected negative sign, while the rest of the variables indicated ex-pected positive relation to FDI.
Table of Contents
1
Irish Miracle ... 4
2
The Role of Government ... 7
3
Theories of FDI ... 10
3.1 The OLI Paradigm ... 11
3.2 Determinants of FDI within OLI framework... 13
3.3 Existing Empirical Evidence ... 15
4
Specifications of variables and data collection... 17
4.1 GDP ... 17 4.2 GDP per capita ... 17 4.3 Labor Productivity ... 17 4.4 Education ... 18 4.5 Infrastructure ... 18 4.6 Trade Openness ... 19 4.7 Dummy Variables ... 19
5
Empirical analysis and findings ... 21
5.1 Limitations ... 21
5.2 Models ... 21
5.2.1 Test for Total FDI. ... 22
5.2.2 Test for FDI per capita ... 22
5.3 Regression results ... 22
6
Discussion ... 27
7
Conclusion and suggestion for further studies ... 30
References ... 31
Appendix ... 34
Table 1 OECD Member States ... 34
Table 2 Matrix correlations ... 35
Table 3 Summary statistics ... 36
Table 4 Regression Output 1 ... 36
Table 5 Regression Output 2 ... 37
Table 6 Regression Output 3 ... 38
Abbreviations
FDI Foreign Direct Investment MNE Multinational Enterprise GDP Gross Domestic Product EU European Union
OECD Organization for Economic Co-operation and Development IDA Investment Development Agency
R&D Research and Development
IPC International Product Cycle Paradigm IMF International Monetary Fund
UNCTAD United Nations Conference for Trade and Development WDI World Development Indicators
CSO Central Statistics Office Ireland
1
Irish Miracle
From one of the poorest to one of the richest countries in Europe Irish economy became an envy of the world’s economies in just one decade1
. Before Ireland stood on the path of success, its persisting dreadful performance raised a question of Ireland falling to the rank of “third world countries” (Coulter, ed. 2003). 1979 –86 for Ireland was a period of the deep recession, with two digit unemployment rate, high inflation, massive popula-tion decline and large napopula-tional debt. However, being a part of UK had a positive effect on Ireland leaving it with the mass of endowments for economic success2. The expan-sion of Irish economy began in 1987 with the launch of Programme for National Re-covery, and with the help of European Structural Funds coming along with EU mem-bership since 1973. The result of the expansion reached colossal numbers which were sustained for a long period. Between 1994 and 2007 Ireland had an average economic growth of 7.7 per cent, while its GDP was 150 per cent of the average EU indicator (Sweeney, 2008).
From the perspective of economic growth Ireland’s thriving transition has been a phe-nomenal case, followed by a number of attempts to replicate by other developing coun-tries. Convergence of Irish economy with OECD countries has clearly had the greatest effect on the “miracle” transition. While in the context of economic growth, the conver-gence hypothesis represents the most commonly studied aspect of growth, the effort to identify growth determinants is perhaps the main area of contemporary growth research. Therefore, after studying a number of research papers we have found that majority of them find common grounds in identifying three main growth determinants of Irish boom (Garcimartín, et al., 2008). According to Garcimartín, these growth determinants are: Open Economic Policies, Social Partnership and FDI Inflows.
Although the first two determinants, which are government initiated, can partly explain Ireland’s phenomenal growth, it’s recognized that FDI inflow is the leading source of economic development (Driffield & Love, 2007). Foreign direct investments contribute
1
Given decade is referred to years from 1987 to 1997 by Coulter ed., (2003), McSharry and White (2000) and Gunnigle et al (2001)
2
Among the endowments are developed banking system and the language inheritance (O’Rourke, 1992). However, according to the author membership with United Kingdom, one of the richest countries, was the main advantage for Ireland as “capital was free to flow between the two countries”.
to the growth of the recipient country in many different ways. The impacts include de-velopment of human capital, capital accumulation, increasing efficiency due to competi-tion and resource allocacompeti-tion, improving of domestic financial markets and reducing of the local capital costs (Todaro, 2002).
While potential importance of FDI on the host country, and thus, the development of FDI incentives is recognized in the world, some issues regarding foreign direct invest-ment in the case of “Irish Miracle” remains unclear. These issues are- what factors has Ireland manipulated to attract such a vast amount of investments? What incentives has this country developed for Multinational Enterprises (MNEs) to choose Ireland as their recipient country? And which of these factors had the greatest impact on FDI inflows in the Republic of Ireland?
As mentioned earlier, a number of studies have been done to shed light on the rapid and sudden economic growth in Ireland (e.g. MacSharry and White, 2000; Barry, 1999). Most of these studies discuss the incentives that attract inward investments to Ireland, however, not the amount of FDI that the country receives. As the result, it is not clear whether Ireland has truly enjoyed greater inflows of FDI then predicted by the model. Given that previous studies have been focusing on the growth factors of Irish Miracle, this study aims to analyze the determinants that have attracted FDI inflows to Ireland and to investigate whether Ireland has secured itself larger amounts of inward invest-ment than it is expected by the model during 1997 and 2007. In order to obtain better results in our empirical analysis we will focus on the more recent decades, both because of the significant changes that have occurred and because of the better data coverage. However, before moving on to the theoretical discussion and empirical results, we will provide an overview of Irish industrial policy environment in which foreign investments have grown.
While current section of this study discusses Irish Miracle phenomenon and FDI as one of the factors of Ireland’s growth, the following section reviews the industrial policy context that played a great role in promoting FDI inflows. Further on, section 3 provides theoretical framework of this thesis, including earlier studies related to the incentives for investment by MNEs. Section 4 discusses specifications of variables and data
collec-provides the discussion of the results, and finally, section 7 presents the conclusion and suggestion for further studies.
2
The Role of Government
For over four decades Ireland’s major priority has been attracting foreign direct invest-ments to the country. Through its proactive and dynamic use of industrial policy and improving free trade environment Ireland has been striving for implementation of the employment creation strategy. The need to create jobs came from the historically high unemployment rate and emigration.3 Therefore eradicating unemployment became a key to an agreement between people, trade unions, employees and government sector on the importance of inward investment. As a result, the strategy started operating in 1960s us-ing industrial incentives to promote export oriented growth caused by FDI firms. At the early stages one of these incentives to attract investment was financial support given by Irish government to sustain industrial development in the form of advanced factories. However, later the level of support varied broadly depending on the investment charac-teristics, sector and location. With the time this process of financing FDI projects be-came even more selective leading to the investments in new sectors with global growth potential and stronger FDI prospects, such as electronics and pharmaceutical at that time. During 1970s, when US economy was on the peak of its economic performance and the global transport costs finally fell, it was a good time for Ireland to identify US as the largest market source for FDI. Consequently, already in 1991 the share of em-ployment in US owned companies accounted for 45 per cent and rose to over 61 per cent by 1999.
Later on, as old goals get fulfilled new ones come on the way, and so does for Irish in-dustrial policy strategy. Accordingly, the next height was recognized by Irish policy makers as creation of industrial clusters, especially in the priority sectors, as it creates the benefits for the country of being a sole producer and distributor within the EU. With the development of strategy, policy makers improve their approaches for already estab-lished policies. For example, after having identified the growing sectors, Investment Development Agency of Ireland (IDA Ireland) initiates contacts with the companies that could benefit from investing in Ireland and therefore strive to convince them to visit the country for a special project proposal. While the country is moving towards the main goal of eradicating unemployment, the role of its government agencies is becoming
3
more significant with the time. At the moment, Ireland has three different government institutions operating within industrial policy plan. They are: IDA Ireland (deals with foreign-owned industry); Enterprise Ireland (works with indigenous industry); and For-fas (develops the policy framework in which two other agencies work on their tasks). As we have pointed out before, the pro-FDI development strategy adopted by Irish poli-cy makers included the use of industrial incentives to promote foreign investments to the country. These incentives mainly represented the combination of fiscal incentives and financial incentives. When talking about fiscal incentives initiated by Ireland one immediately thinks about exceptional corporate tax regime. From the mid-1950s all companies establishing their business in Ireland were entitled for 15 years-tax-holiday on profits from export activities. Later it is been recognized that this incentive went against the principles of the Treaty of Rome and in 1980 was replaced with the prefe-rential tax rate of 10 per cent and in 1990 to 12.5 per cent. See Figure 1 below. While in the competition for FDI other countries in Europe were reducing their corporate tax rates, Ireland sustained its fiscal policy, as it’s been recognized as a vital instrument in attracting FDI inflows to Ireland.
Figure 1. Corporate Tax Rates
Source: PricewaterhouseCoopers, Tax Brochure 2010, p.15
The other component of Ireland’s policy incentives, which is financial aid, has been de-signed to support companies that open their operations in Ireland. This support was giv-en in the form of cash grants with repaymgiv-ent only whgiv-en the company fails to meet the
employment objectives agreed by them and the state agencies. At the start this incentive operated as automatic investment grants, given as a fixed percentage of the cost of the new factory. Later, the range of the financial aid was widened, and included along with the investment grants, training grants, low-interest loans, technology transfer support, subsidized rents and R&D grants.
Throughout the years Irish policy has, relative to other countries, emphasized the impor-tance of both minimizing bureaucratic costs as well as establishing policy certainty for incoming investors. Policy certainty has been achieved mainly through policy continuity and consistency, while fiscal certainty - by providing investing firms with the long and certain time horizon. On the other hand, financial uncertainty has been minimized by providing cash grants with no repayment as long as companies meet the initial targets, agreed upon (Ruane, 2006).
3
Theories of FDI
Theories and concepts of foreign direct investment emerged in the mid-1950s, when the first MNEs originating in US started to invest in the growing markets of Latin America and Europe, where they recognized the advantage of postwar reconstruction efforts. In its turn, these globalization activities by MNEs gave researchers and analyst the empiri-cal base for studying activities of multinationals along with behavior patterns and deci-sions of FDI.
One of the first theories attempting to explain the reasons for growth by MNEs and their decisions to produce abroad was founded in 1960 by S. H. Hymer. His theory is based on the assumption that investors have to exploit the imperfections of the market abroad; since foreign investments carry higher risks and cost, like different language, cultural barriers and possibility of discrimination. As a result, the investing firm must possess a monopolistic advantage or a firm-specific advantage, which is derived from market im-perfections. This advantage, among others, includes technology, brand name, manageri-al skills and scmanageri-ale economies (Hymer, 1960). Yet, the Theory of Firm-Specific Advan-tages has little to say about the actual decisions about FDI.
The concept of firm-specific advantages has been further developed in the Transaction Cost theory, which suggests that variety of factors, like firm-specific and host-country specific factors can influence the cost and benefits associated with establishment of dif-ferent FDI modes. The core explanation of international market entry modes in the transaction cost theory is based on the use of the firm-specific advantages in cross bor-der operations (Demirbag et. al., 2008) According to Hennart and Park (1993), there are two types of firm specific advantages: first, is the managerial skills or technical exper-tise that can be separated from the company; and second type is rather difficult to sepa-rate and can be tightly bound to organization. For the first type of firm specific advan-tage, the parent company can combine its resources with resources and advantages of the acquired firm, while for the second type, such a combination may not be possible due to the embedded recourses of investing MNE. In this case FDI takes place in the form of greenfield investment4. (Hennart and Park, 1993).
4
Greenfield Investment and Mergers & Acquisitions are the entry modes of foreign direct investment, which we will discuss further in the next subsection of the paper.
Soon after that, French scholar R. Vernon constructed the International Product Cycle (IPC) Paradigm, where he analyzes international trade and foreign investments by (US) corporations to the postwar Europe. According to that theory, during the natural life-cycle of products corporate leaders face three types of decisions: to produce at home, to export or to transfer production to foreign markets. At the same time, Vernon claims that the product life consists of another three phases. At the innovation phase, compa-nies benefit from temporary monopoly due to the new product launches at home market. At the maturity phase, due to the high competition companies face the challenge of adopting an internalization strategy, and if they fail to do so they seek for export mar-kets. Finally, during standardization phase, striving to identify countries with low cost production sites, companies undertake foreign investments to defeat their leadership po-sition (Vernon, 1966). Although, Vernon provided a useful explanation of decisions by US companies to shift production overseas, after that the international economic situa-tion has changed drastically. Nowadays, decisions of firms are lead not by products reaching certain life cycle, but by strategic reasoning.
In the Follow-the-Leader theory developed by F. T. Knickerbocker in 1973, author ana-lyzes behavior of MNEs and the competitive market. The main idea of the theory is based on the results of empirical study on 187 US MNE’s and their activities during 1948 and 1967. Knickerbocker discovered that in the oligopolistic industries companies that undertake FDI are followed by other competitors from the home country with de-fensive investment into that market. This phenomenon has been observed in 45 per cent of the cases. However, it doesn’t explain the motivation for initial investment by the market leaders (Knickerbocker, 1973)
3.1
The OLI Paradigm
In this thesis we will focus our attention on the OLI Paradigm Theory as the most com-prehensive theory that can explain all types of internalization and motives for FDI, giv-en the existing advantages for foreign investors. The OLI paradigm or Eclectic theory was formulated in 1981 by a well-known economist J. H. Dunning. In his theory Dun-ning sets out a framework for explaiDun-ning level and patterns of FDI activities of firms. According to the paradigm, the reasons for firm to undertake foreign production depend
on the combination of ownership-specific advantage, internalization-specific advantage and location-specific advantage.
An ownership-specific advantage is referred to as a competitive advantage that a firm must have in the home country prior to shifting production abroad. These advantages are based on the Hymer’s concept of firm-specific advantages; since OLI paradigm comes as the result of this concept, and includes: technology, know-how, resources and etc. According to Johnson (2005), ownership advantage can be transferred to a foreign country, as it can move between different locations.
A location-specific advantage is defined as a country-specific characteristics and loca-tion-bound endowments offered by recipient countries to investing firms. This advan-tage also includes market size, political stability, physical infrastructure and other fac-tors that add further value to the country’s competitive advantage. Location advantage tries to explain the reasons why it is more beneficial for companies to become multina-tionals and shift the production abroad. As Johnson argues, this is the only advantage that can never be transferred to another country, and therefore, if the home country pos-sesses the best location advantages then a firm operates at home and exports goods to serve foreign markets (Johnson, 2005).
Final, internalization advantage is determined by Dunning as the way firms choose to use their ownership advantage. This component tries to explain why MNEs prefer to undertake FDI rather than export, licensing or other type of entry mode. In the case of absence of international advantage, multinationals will choose to license their operation in order to serve the demand of the markets abroad (Johnson, 2005). The advantage in-cludes such factors as: control over human capital, desire to minimize the risks of ex-change rate fluctuations etc.
However, OLI paradigm is mainly focused on motives for investment and explains why MNEs move productions abroad or undertake other ways of international production, like exporting or licensing. Therefore, the main weakness behind this theory is reflected in rather limited discussion of multinationals’ behavior, excluding such crucial moments as, discussion of entry modes and different types of foreign production in depth. Since our paper is focused specifically on foreign direct investments, it is crucial to distin-guish between the two different entry modes as investment alternatives for MNEs. First
mode, Greenfield Investment, is characterized by establishment of a new production plant by investing company in the recipient country. It is argued that the establishment mode decision of Greenfield investment depends mainly on the effective combination of MNE’s resources and local assets (Gatignon and Anderson, 1988). Second mode, Brownfield Investment (or Mergers and Acquisitions), is described as the mode that takes place in the form of acquirement of an equity share in an existing foreign entity. What’s more, an acquiring company may decide to establish a wholly owned subsidiary alone or involve a partner (joint ventures) (Dikova and Van Witteloostuijn, 2007). Ac-cording to Gatignon and Anderson (1988), the latter mode is based on the need for con-trol over the subsidiary’s assets (Gatignon and Anderson, 1988).
3.2
Determinants of FDI within OLI framework
As it is been said before, OLI paradigm is widely used by scholars to explain interna-tional trade and behavior of foreign direct investment. The advantages presented by Dunning provide the grounds for studying factors that affect promotion of FDIs. Among different determinants of these advantages, in our thesis we will mainly focus on the factors comprising location-specific advantages as the aim of our study is to analyze the effects of the host country characteristics on FDI inflows, particularly in Ireland. There-fore, we assume that Ireland already possess both, internalization and ownership advan-tages, letting FDI to be determined only by the fluctuations in the variables of location-specific advantages.
Every multinational corporation before undertaking FDI considers different locations with various factor endowments. The decision of specific location choice is based on the motives for FDI. According to Dunning, there are three motives for MNEs to invest into foreign country. They are: market-seeking, resource-seeking and efficiency-seeking.
The motive behind market-seeking FDI is to exploit the new markets. A market-seeking company invests in a host country in order to serve its demand for goods. In this case the same production activities are replicated in several locations to satisfy the local de-mand, resulting in horizontal FDI. The main factors that encourage this type of FDI are
market size and market growth of the host country; the access to regional and global markets, the market structure.
A firm with the resource-seeking FDI invests in the foreign country order take advan-tage of its natural resources or agricultural production. While market-seeking FDI is de-signed to serve only the local market, resource-seeking type of FDI is intended to serve the local, home and third country markets. The main determinants of resource-seeking FDI include natural resources, raw materials and complementary factors of production. Efficiency-seeking FDI is described by investments undertaken in order to minimize production costs. It takes place when market-seeking investments as well as resource-seeking investments have been already realized. This type of FDI is considered to be a vertical investment and include: sufficiently skilled labor, business related policies, trade policies and physical infrastructure (Dunning, 1997).
Although Dunning’s OLI Paradigm provides rather clear explanation of motives behind multinationals’ decisions to undertake FDI, the theory however lacks the discussion of strategic behavior by MNEs and especially location strategy. In the present economy, where the competitive advantage is the crucial element for a strong position in the mar-ket, it is recognized that the main source of advantage comes from the management of the firm’s dynamic capabilities (R&D and design), making knowledge activities increa-singly important for firms. Therefore, according to Le Bas (2007), the choice of location is the key element for understanding how MNEs build and maintain their knowledge ac-tivities and hence, competition in the market (Le Bas, 2007).
Kuemmerle (1999) first called these knowledge activities locating strategies as Home-base Exploiting and Home-Home-base Augmenting strategies. In the former case, the motiva-tion behind investment is to exploit the existing dynamic capabilities in foreign envi-ronments. A firm possessing a competitive advantage in a technological field in its home market seeks to exploit it abroad, mainly in regions that are weaker in this field. Home-base augmenting strategy, on the other hand, is described by targeting technolo-gies in which the firm has a relative advantage at home and the host country is also rela-tively strong. Such R&D activities are aimed at monitoring or acquiring competitive ad-vantages which are complementary to those already possessed by the firm so as to aug-ment a firm’s existing stock of knowledge (Kuemmerle, 1999).
3.3
Existing Empirical Evidence
Analyzing previous studies conducted on the determinants of FDI in Ireland we came across the fact that various studies suggest different points of view on the reasons of Ireland’s attractiveness to FDI. Some research studies favor the impacts of institutional factors, like political stability and freedom from corruption, and others focus on the role of macroeconomic variables, such as trade openness and business freedom.
One of the first studies on Irish FDI determinants have been conducted in the 1990s by Barry F. and Bradley J. In their study “FDI and Trade: The Irish Host-Country Expe-rience” authors argue that such factors as educated labor force, improved physical infra-structure, fiscal stabilization policies and EU regional aid increased the attractiveness of Ireland as a base for an inward foreign direct investment. The research also detected that liberalization of the trade agreement was found to be significant and therefore is a cru-cial prerequisite for motivating large FDI inflows (Barry F., Bradley J., 1997).
Later, after one decade, Barry F. conducted an extensive review of the literature on the effects of Irish factors on the FDI inflows. His study presents more complex view on the determinants of inward investment that leads to “institutional co-evolution” of Ireland. The results demonstrate the range of major FDI factors as follows: (i) EU membership, macroeconomic stability, Western European governance standards, an English-speaking environment and a legal and business system familiar to US corporations, (ii) a low corporation tax rate, (iii) the skills and experience of the Industrial Development Agency (IDA), (iv) the quality of the telecommunications infrastructure, (v) an educa-tional system that is integrated to a large extent with the country’s FDI-oriented devel-opment strategy, and (vi) an institutional system configured to respond rapidly to changes in the global FDI environment. (Barry F., 2007)
On the other hand, the study by Gunnigle and McGuire (2001), where authors review the location decisions of US multinational corporations (MNCs), focuses on the impact of labor issues on the inflow of US foreign direct investment to Ireland. According to their research results, low corporate tax regime came out as the most significant deter-minant in attracting US FDI to Ireland. However, the results also suggest that the other variables such as labor cost and its quality had less significant but still important effect on location decisions of American MNCs (Gunnigle and McGuire, 2001).
According to the studies by Breathnach (1998), the remarkable increase in the foreign direct investments in Ireland is mainly attributed to the significant policy changes estab-lished by the state agency responsible for attracting FDI, Industrial Development Agen-cy. Moreover, his analysis suggest that IDA is not the only responsible source of high FDI inflows, and that availability of skilled labor, advanced infrastructure and high ex-penditure on Research and Development (R&D) were the additional determinants of inward investment to Ireland (Breathnach, 1998)
Mold (2003) conducted an econometric research on developed European countries, where Denmark, France and Germany were included in the “core” group and Ireland, Greece and Portugal – in the “peripheral” group. In this analysis he examined the out-ward FDI of US manufacturing affiliates and got the results, where only market size and exchange rate variability were significant, followed by the relative labor unit cost. While observing that factor-related characteristics, such as local cost of capital, did not seem to affect the location choice, he found that FDI inflows were significantly different in the two groups of countries: higher in “peripheral” group, with 63% and lower in the “core” group, with 31% (Mold, 2003).
Gilmore et al. (2003) in their research on determinants of FDI, analyze the motivations and satisfaction levels associated with FDI inflows in two economies: Northern Ireland and Bahrain. The results of the analysis showed that expected importance of the cheap labor cost was lower than anticipated, whereas the availability of skilled labor was found as significantly more important motivation than labor cost. It was also revealed that the influence of the host governments was significant in attracting FDI and acted as the greater attracting factor in the Northern Ireland. And most importantly, the issue of cultural closeness to home that has not been extensively analyzed in the previous stu-dies, showed significant results in attracting FDI as a motivating factor of location (Gilmore et al., 2003)
Previous studies have identified and tested a substantial list of variables that might have an impact on the inflows of foreign direct investments. Yet, very little attention has been paid in the previous works to the discussion of the real volumes of FDI that have been attracted by Ireland from the clever use of its factors. Therefore, by analyzing the inflows of FDI to Ireland our research differs from other studies and contributes to the knowledge on the field.
4
Specifications of variables and data collection
In this section we will present the description of variables that we will use for the test of determinants of FDI in Ireland. As mentioned earlier, those determinants represent the most commonly studied factors that showed significant results in the previous research papers. This section ends with the table summarizing explanatory variables and their expected signs.
4.1 GDP
The GDP is presented as a proxy for market size, which, among others, is the main de-terminant of market-seeking FDI. The growth of GDP indicates development of the economy, resulting in the job-creation, increased output and expansion of the economy. As the result, MNE’s are willing to invest in those countries in order to serve the host country demand for goods (Culem, 1988). Therefore, we expect the sign of coefficient for GDP to be positive and have a significant effect on inward investments. The data for GDP is collected from the OECD Stat Extracts, 2010.
4.2 GDP per capita
While absolute GDP measures the size of the market, GDP per capita indicates the qual-ity of market demand. GDP adjusted for population, measures the welfare of people in the economy, the purchasing power of population and the standard of living in the coun-try (Johnson, 2005). The higher GDP per capita, the greater demand for more advanced goods, which in its turn leads to increased sales and gains from profit. According to Grosse and Trevino (1996), the market size as expressed by GDP per capita has a strong positive influence on the FDI inflows (Grosse and Trevino, 1996). Thus, we expect the sign of coefficient to be positive and have a strong effect on FDI. The data for GDP per capita is gathered from the OECD Stat Extracts, 2010.
4.3 Labor Productivity
Labor productivity is presented by a proxy for unit labor cost measured as nominal GDP per hour of work. It determines the efficiency of labor in the economy and
competitive-ative relationship between the unit labor cost and the foreign direct investment. On the other hand, the unit labor cost reflects to some extent the quality of labor supply thus, making wage or labor cost to be competitive measurements in the labor market (Cars-tensen and Toubal, 2004) Nevertheless, due the former reason, assuming that investors seek for lower cost of production, we expect the coefficient of unit labor cost to be neg-ative and have a significant effect on FDI inflows. The data for labor productivity is ex-tracted from the OECD Stat Extracts, 2010.
4.4 Education
We measure this variable as the number of students enrolled by age divided by popula-tion of the country. We divide by populapopula-tion in order to adjust for the size of the coun-try since in most of the cases bigger countries have bigger results. Since education indi-cates the quality of the skilled labor in the country, population with the higher education level can perform more complicated tasks on the market. As the result, skilled labor at-tract foreign investors as they don’t only care about the labor cost but also care about the quality of the labor. Therefore we expect the coefficient of education variable to be positive and to have significant effect on foreign direct investment. The data for educa-tion is obtained from OECD Stat Extract, 2010.
4.5 Infrastructure
It is crucial for the every country to have developed quality industrial or physical infra-structure in order to attract FDI. The infrainfra-structure can be measured by transportation, telephone lines, electricity, internet, telecommunication or number of airports and sea-ports. The accessibility of infrastructure is one of the elements for investment decision. As the result, there is a tendency for enterprises to choose the country with a higher in-frastructure endowment; thus it is obvious that countries with more developed infra-structure are expected to attract more FDI. For this determinant, the variable “fixed lines and mobile phone subscribers (per 100 people)” has been used as a proxy due to the availability of data and application of it by previous studies. The coefficient for this va-riable is expected to have a strong positive relationship with FDI inflows. The data is collected from the World development indicators database of the World Bank, 2010.
4.6 Trade Openness
Trade openness is another essential determinant besides the market size of the host country that multinationals take into account when looking for the export possibilities and access to the neighbor markets. According to Dunning (2002), the greater the trade openness the more favorable it is for the efficiency-seeking FDIs. Countries that are more open to FDI therefore assumed to receive substantial amounts of foreign invest-ment. In this study we measure trade openness as the percentage of total export and im-port divided by GDP and multiplied by 100. We expect the sign of coefficient for trade openness to be positive and have a significant effect on FDI inflows. The data on ex-ports and imex-ports of goods and services as a percentage of GDP were collected from the World development indicators database (WDI), World Bank.
4.7 Dummy Variables
In our model we include dummy variable for FDI inflows, D(FDI), due to the transfor-mation of the data for inward FDI indicators. FDI inflows for OECD countries showed negative values as well as zero values, therefore, the transformation of the data to avoid the minus sign was necessary in our analysis. We found the highest negative value and added it to all the FDI inflows for every country in each year. As the result, D(FDI) takes the value of 1 for zero FDI inflows, and 0 otherwise.
We also include D(Year)t, dummy variable for each year, in order to account for the time effects that might influence the regression results. According to Gujarati (2004), these time effects can be characterized by technological changes, tax policies, wars in the country ect (Gujarati, 2004). Since we have 11 years, from 1997 to 2007, we intro-duce 10 dummies and exclude the dummy for 1997 in order to avoid the dummy trap.
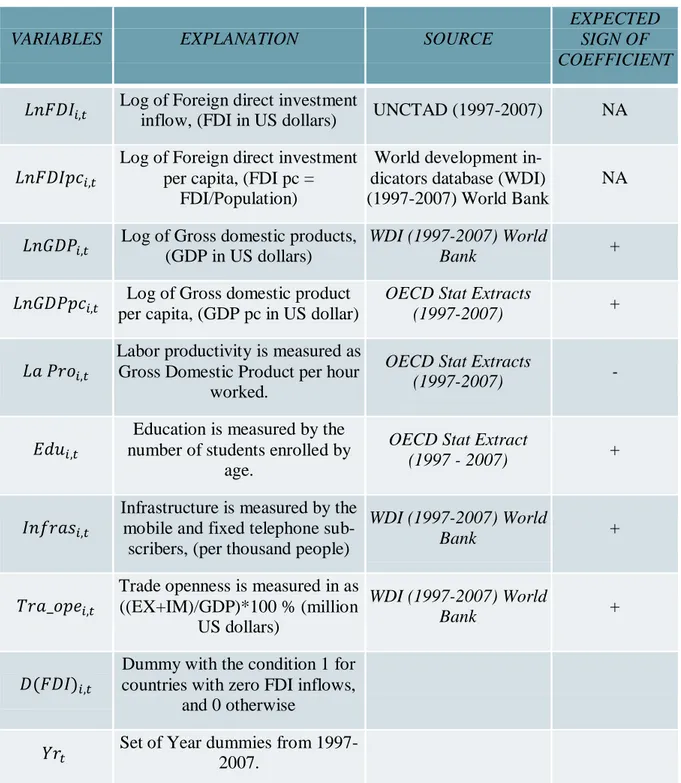
Table 1, on the next page, summarizes the explanatory variables and their expected ef-fect on the dependent variables.
Table 1. Summary of variables
VARIABLES EXPLANATION SOURCE
EXPECTED SIGN OF COEFFICIENT Log of Foreign direct investment
inflow, (FDI in US dollars) UNCTAD (1997-2007) NA Log of Foreign direct investment per capita, (FDI pc =
FDI/Population)
World development in-dicators database (WDI) (1997-2007) World Bank
NA
Log of Gross domestic products, (GDP in US dollars)
WDI (1997-2007) World
Bank +
Log of Gross domestic product per capita, (GDP pc in US dollar)
OECD Stat Extracts
(1997-2007) +
Labor productivity is measured as Gross Domestic Product per hour worked.
OECD Stat Extracts
(1997-2007) -
number of students enrolled by Education is measured by the age.
OECD Stat Extract
(1997 - 2007) +
Infrastructure is measured by the mobile and fixed telephone sub-scribers, (per thousand people)
WDI (1997-2007) World
Bank +
Trade openness is measured in as ((EX+IM)/GDP)*100 % (million US dollars)
WDI (1997-2007) World
Bank +
countries with zero FDI inflows, Dummy with the condition 1 for
and 0 otherwise
Set of Year dummies from
5
Empirical analysis and findings
This section we begin by discussing limitations of the analysis, followed by presentation of regression models together with the output table and conclude with highlights of the main results.
5.1
Limitations
A selection of 30 OECD member states is used and 11 years, from 1997- 2007 have been sampled for our analysis. As mentioned earlier, variables for the test have been se-lected based on the previous studies, however not all of them were included in the mod-el. Due to limitations, such as the lack of data for certain variables or the nature of va-riables’ constant numerical indicator we faced constraints and could not extend the model further. Among the excluded variables are corporate tax rate, governmental poli-cies, cultural relation between MNEs and host countries, expenditure on R&D and the exchange rate variability. Although it is widely recognized by economists that Ireland’s exceptionally low corporate tax rate is one of the key factors attracting FDI to Ireland, in most of the countries the rate of tax do not change throughout the years, therefore given variable was not considered in the model. Moreover, the role of government is another critical element in Ireland’s economic success. As we have seen in chapter 2, it can be measured by many proxies, such as government aid, tax cuts, investment grants or simply by presence of IDA. Yet, the governmental policy effect, could not be fully captured due to the statistical homogeneity of the sample.
5.2
Models
The regression models were designed to test the factors that influence FDI per capita and total FDI inflows. For our test we use ordinary least squares (OLS) method, where FDI and FDI per capita are dependent variables, and GDP, GDP pc, labor productivity, trade openness, infrastructure and education are independent variables. Both of the models have been based on the theoretical framework discussed earlier in this thesis. For our empirical analysis we conducted four different regressions: (i) testing total FDI on the total GDP and the rest of variables; (ii) testing total FDI on the total GDP and the rest of variables with dummy variables for each year; (iii) testing FDI per capita on the
GDP per capita and the rest of variables; (iv) testing FDI per capita on the GDP per ca-pita and the rest of variables with dummy variables for each year.
5.2.1 Test for Total FDI.
where stands for FDI inflows into OECD member states in country i and in time t(97-07)
5.2.2 Test for FDI per capita
where stands for FDI per capita inflows into OECD member states in coun-try i and in time t(97-07)
5.3
Regression results
In this section we combine four regression results into one table. The individual results can be found in the appendix, Tables 4-7. Further, we will discuss the results and draw the attention to the key indicators.
Table 2. Regression results
Coefficients
Regression 1 FDI (no year dummies)
Regression 2 FDI (with year
dummies)
Regression 3 FDI pc (no year
dummies) Regression 4 FDI pc (with year dummies) Constant p-value t-stat 3,536 ,000 16,460 3,433 ,000 15,721 -3,185 ,000 -5,902 -3,600 ,000 -6,391
p-value t-stat ***,408 ,000 10,427 ***,440 ,000 10,740 p-value t-stat ***,368 ,000 4,725 ***,395 ,000 5,023 p-value t-stat ***,155 ,002 3,204 ***,169 ,000 3,522 ***,245 ,000 6,599 ***,253 ,000 6,793 p-value t-stat ***,318 ,000 4,521 ***,319 ,000 4,592 ***-,451 ,000 -10,533 ***-,436 ,000 -10,077 p-value t-stat ***-,151 ,001 -3,311 ***-,149 ,001 -3,318 *-,068 ,064 -1,858 *-,061 ,095 -1,676 p-value t-stat ,078 ,165 1,391 *,106 ,069 1,822 ***,278 ,000 6,393 ***,296 ,000 6,723 p-value t-stat -,061 ,189 -1,316 *-0,086 ,066 -1,843 **-,084 ,024 -2,267 ***-,099 ,008 -2,652 p-value t-stat ,033 ,606 ,516 -,009 ,866 -,169 p-value t-stat ,302 ,067 1,034 ,012 ,827 ,219 p-value t-stat ,089 ,111 1,708 ,010 ,848 ,192 p-value t-stat **,658 ,029 ,443 -,028 ,596 -,531 p-value t-stat ,005 ,935 ,082 -,039 ,470 -,723 p-value -,030 ,650 -,049 ,360
t-stat -,454 -,916 p-value t-stat -,060 ,369 -,900 -,082 ,133 -1,507 p-value t-stat *-,122 ,067 -1,841 **-,113 ,038 -2,082 p-value t-stat ,040 ,551 ,596 -,056 ,304 -1,030 p-value t-stat ,036 ,595 ,533 -,057 ,296 1,046 R2 ,371 ,414 ,599 ,614 R2 adjusted ,358 ,382 ,591 ,593 F- value ***29,861 ***12,969 ***75,747 ***29,205 ***sig. at 1% **sig. at 5% *sig at 10%
Results from table 2 are given for all regressions. In the current section of our research we intend to highlight the key findings of our empirical analysis and in the following section provide the interpretation of the specified results. From the table 2 we see that the F value of each regression outcome is highly significant, which suggests that partial slopes of coefficients in each regression are not equal to zero, thus, there is a significant relationship between the variables.
Moreover, we observe that value is increasing with each regression, implying that independent variables provide better explanation of variability in FDI per capita rather than variability in total FDI. The highest value of is recorded in regression 4 and equals to 0,614. This value is higher than the average and indicates that 61,4% of the change in FDI per capita is explained by the change in the dependent variables.
Considering coefficients of explanatory variables, GDP, GDP pc, Education and Infra-structure show statistically high significant results in each regression, which indicates that all of these variables are significant determinants of FDI and FDI pc. Given obser-vation supports the findings of Mold (2003), Gilmore et al (2006) and Barry & Bradley (1997) that have been discussed earlier, and go in line with the theory of determinants of FDI by J. Dunning (1981).
With the help of the table we also observe that all the coefficients of explanatory va-riables have the expected signs, except for . According to the table 1, variable Infrastructure was expected to have a plus sign, and thus a positive relationship with FDI and FDI pc. However, the opposite has been observed in the regressions 3 and 4, which suggests a negative relationship between Infrastructure and inflows of FDI per capita.
While GDP, GDP pc, Education and Infrastructure showed significant results in all re-gressions, Labor productivity and Trade openness turned out to be less significant in 2 out of 4 regressions. As can be seen from the table 2, Labor productivity show statisti-cally significant results in the regressions for total FDI inflows, but less significant re-sults in the regressions for FDI per capita. In order to determine whether the coefficient of Labor productivity is significant in regressions 3 and 4 we conducted a t-test and aplied 10 % level of significance. According to the test, value=0,064<0,10 and p-value=0,095<0,10. Thus, we reject the null hypothesis ( : =0) and conclude that there is a significant relationship between Labor productivity and inflows of FDI pc. Trade openness, on the other hand, shows high significance in relation to FDI per capi-ta, and less significant result in the regression for total FDI inflows including year dummies. Moreover, it shows no significance whatsoever in the regression for total FDI inflows excluding year dummies, although the coefficient is positive as expected. Test-ing for individual significance of Trade Openness’s β-coefficient, with the p-value=0,069<0,10 (from regression 2), we reject the null hypothesis ( : =0) and conclude that there is a significant relationship between Trade openness and total FDI inflows when accounted for the time effects.
Further on, we notice that the coefficient of the dummy variable for FDI inflows has an increasing significance with each given regression. The regression with the most
signif-icant D(FDI) is the fourth, that is, the model for FDI per capita including year dummy variables.
Finally, in the second part of the output table, we can see that several of the year dum-mies indicate statistically significant results in years, such as 2001 and 2005. As given dummy variables are only included in 2 regressions, the results can be observed in re-gression 2 and 4, the tests of FDI and FDI pc respectively.
6
Discussion
In the current chapter we will discuss main findings presented in the previous section, followed by the discussion of fractions of FDI inflows to Ireland. Before we proceed to the detailed discussion of key indicators from the regression output table, it is worth mentioning that after having tested for multicollinearity, autocorrelation, and heterosce-dasticity, no severe degrees have been detected.
The results of all the four models are relatively significant. In two out of four regression outputs value is higher than the average, which suggests that the model for testing FDI per capita has a better fit than the test for total FDI. Furthermore, the regression ta-ble identifies GDP, GDP per capita, Education and Infrastructure as significant determi-nants of FDI and FDI pc as their coefficients display high significance.
However, not all the signs for the above mentioned variables turned out as we predicted. Infrastructure variable shows a negative sign in the two regressions (for FDI pc), while the opposite has been expected. According to the theory of determinants of FDI, infra-structure is one of the core factors of efficiency-seeking FDI (Dunning, 1981) and thus, should have a positive relationship with inward investments. Interpretation of the unex-pected sign could be either based on the assumption that infrastructure truly has a nega-tive relationship with foreign direct investments per capita, or that the minus sign results from the incorrect proxy data for a given variable.
Although the coefficient for labor productivity, in all regression outputs, resulted with a negative sign, as we predicted, its significance level didn’t go in line with our expecta-tions. From regressions 3 and 4 we can observe that Labor productivity variable has less significance in relation to FDI pc. We relate the low significance of this variable to the assumption that Ireland, as other OECD countries, has relatively high unit labor cost in comparison to developing countries, therefore the role of labor productivity was not as crucial in attracting FDI to Ireland as the role of other determinants. As Gilmore et al. (2003) observed in their studies, the availability of skilled labor was found as signifi-cantly more important motivation for FDI than the labor cost.
Based on the results in Table 2, we can see from regressions conducted for testing no-minal FDI, that the trade openness appear to be insignificant and faintly significant in
theory of Dunning (2002), where according to the author, higher openness of the coun-try towards FDI leads to the greater inflows of investment. Nevertheless, we assume that the reason of a low significance of trade openness variable in regression 2 lies in the presence of other highly significant variables in the model. Therefore, compared to oth-er variables influencing FDI, trade openness turned out to be less significant.
Finally, the last remarkable finding underlined in table 2 is associated with the dummy variable, which shows statistically significant results in years 2001 and 2005. As men-tioned earlier, these dummy variables, assigned for each year from 1997 to 2007, ac-count for the time effects, i.e. for the events occurring at that time that might have an ef-fect on inflows of FDI. According to UNCTAD (2001), Information and Communica-tion Technologies (ICT) crisis which began with the dot-com bubble burst in 2000 re-sulted in a vast global decline of the telecom oriented FDI. This decline was mainly brought by the collapse of cross border merger and acquisition (M&As) companies in developed countries (UNCTAD, 2001). Therefore we assume, that this global decline in FDI has reflected in the shift of investment in Ireland and further in the significant dummy variable of year 2001 in our regression output.
While the downturn of FDI inflows in Ireland in 2001 was affected by the global ICT cri-sis, the negative FDI in 2005 most probably was a result of the inter-affiliate loan ad-vances and repayments from resident foreign-owned enterprises. As Central Statistics Of-fice of Ireland (CSO) (2005) states, in 2004 Ireland has experienced a significant drop in FDI inflows from EU and Caribbean countries. Moreover, CSO clarifies that the signifi-cant disinvestment during 2004 and 2005 was due to the impact of sizeable dividend repa-triations by Irish-based enterprises of European and Central American MNEs (CSO, 2005).
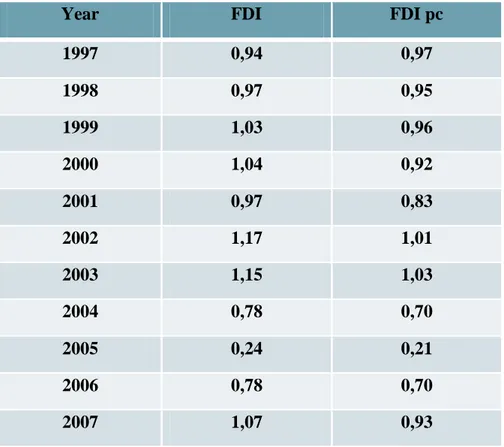
Further on, we will conclude this discussion by evaluating the ratio of actual FDI in-flows to expected FDI inin-flows as well as actual FDIpc to expected FDIpc. With the giv-en ratios we are aiming to analyze whether Ireland has received more FDI and FDIpc inflows than our model predicts. Fractions are presented in Table 3 and calculated for each year, from 1997 to 2007. Calculations are made for FDI inflows and FDI per capita inflows including year dummy variables, that is, regressions 2 and 4 respectively.
The ratios are calculated the following way:
and
Where nominator indicates the exponential of the actual FDI Inflows/ FDIpc inflows and denominator represents the exponential of the predicted FDI inflows/ FDIpc in-flows.
Based on the table, if the ratio is less than 1 it indicates that Ireland did not receive more FDI inflows than predicted by the model, in a given year. However, if the ratio is great-er than 1 then the result is opposite and Ireland has received more FDI inflows than pre-dicted by the model. According to the table, only during the years 2002 and 2003 Irel-and has collected more FDI inflows Irel-and FDI per capita inflows together than it was pre-dicted by the model. Viewed separately, high fraction of FDI inflows adjusted for popu-lation have been collected by Ireland only in two out of eleven years. Total FDI in-flows, on the other hand, have high ratios in five out of 11 years. Given results imply that during 1997 and 2007 Ireland has attracted less FDI inflows and FDI per capita in-flows than it was predicted by the model.
Table 3. Fractions of FDI inflows to Ireland
Year FDI FDI pc
1997 0,94 0,97 1998 0,97 0,95 1999 1,03 0,96 2000 1,04 0,92 2001 0,97 0,83 2002 1,17 1,01 2003 1,15 1,03 2004 0,78 0,70 2005 0,24 0,21 2006 0,78 0,70 2007 1,07 0,93
7
Conclusion and suggestion for further studies
The goal of this thesis was to find out the driving sources behind highly increased FDI inflows to Ireland and to examine whether Ireland has truly enjoyed higher amounts of FDI inflows rather than predicted by the model. We were interested in studying foreign direct investment into Ireland as it served as one of the main resources of Irish rapid economic growth and lead to a title of “Celtic Tiger”.
Overall, four linear models were applied to test total and per capita FDI on explanatory variables. Models provided a better fit in the estimation of FDI per capita, yet all regres-sions produced many significant results. Among all variables, GDP, GDP per capita, in-frastructure and education were found significant in both sets of the models, together with the labor productivity and trade openness being less significant. Moreover, from the table of fractions of FDI inflows and FDI per capita we discovered that despite the clever manipulation of FDI incentives and a strong pro-FDI policy Ireland did not at-tract more FDI inflows than it was expected by the model during 1997 and 2007. For further studies we would suggest to analyze a longer period of time for target coun-tries and include among other factors corporate tax rate and expenditure on research and development in order to obtain more valuable results. Moreover, we would suggest to lag the variable trade openness to have a better estimation of the factors of FDI inflows. Also it could be of great importance to test the causality effect between FDI inflows and its factors to determine what affects what. Finally, it would be interesting to analyze how the FDI determinants in Ireland have changed over time.
References
Barry, F. Foreign direct investment and institutional co-evolution in Ireland, Scandinavian Economic History Review p.55 (3) 2007, pp. 262-288.
Barry, F., Bradley, J. FDI and trade: The Irish host-country experience 1997,Economic Journal 107 (445), pp. 1798-1811.
Breathnach, P. (1998) Exploring the 'Celtic Tiger' phenomenon: causes and consequences of Ireland's economic miracle, European Urban and Regional Studies, 5 (4), pp. 305-316. Buckley, P.J., Ruane, F., (2006) Foreign direct investment in Ireland: Policy implications for emerging economies, World Economy, 29 (11), pp. 1611-162.
Carstensen, K., Toubal, F. (2004) Foreign direct investment in Central and Eastern European countries: A dynamic panel analysis, Journal of Comparative Economics, 32 (1), pp. 3-22.
Coulter, C. (Editor). End of Irish History? Critical Approaches to the Celtic Tiger. Man-chester ,GBR: ManMan-chester University Press, 2003. p iii.
Culem, C.G. (1988) The location determinants of direct investments among industrialized countries, European Economic Review, 32 (4), pp. 885-9045.
Demirbag, M., Tatoglu, E., Glaister, K.W., (2008) Factors affecting perceptions of the choice between acquisition and Greenfield entry: The case of western FDI in an emerg-ing market, Management International Review, 48 (1), pp. 5-389.
Driffield, N., Love, J.H., Linking FDI motivation and host economy productivity effects: Conceptual and empirical analysis, Journal of International Business Studies, (2007), 38 (3), pp. 460-4736.
Dikova D., Van Witteloostuijn A. Foreign direct investment mode choice: entry and es-tablishment modes in transition economies. Journal of International Business Studies. 2007. 38 (6), p. 1013
Dunning, J. H., International Production and the Multinational Enterprise, 1981
Garcimartín, C., Rivas, L.A., De Sarralde, S.D. Accounting for Irish growth: A bal-ance-of-payments - Constraint approach, Journal of Post Keynesian Economics Volume 30, Issue 3, March 2008, pp. 409-433.
Gatignon, H. and Anderson, E. (1988) The multinational corporation’s degree of con-trol over foreign subsidiaries: an empirical test of a transaction cost explanation, Jour-nal of Law, Economics and Organization 4(2): 305–337.
Gilmore, A., O'Donnell, A., Carson, D., Cummins, D. (2003) Factors influencing foreign direct investment and international joint ventures. International Marketing Review
[0265-Gray, A. W.(edition1997), International Perspectives on the Irish Economy. Dublin: Inde-con.
Grosse, R., Trevino, L.J. (1996) Foreign direct investment in the United States: An analy-sis by country of origin Journal of International Business Studies, 27 (1), pp. 139-15513. Guajarati D.N.,(2004) (Fourth Edition) Basic Econometrics. McGraw Hill, Pages 643-644.
Gunnigle, P., McGuire, D. Why Ireland? A qualitative review of the factors influencing the location of US multinationals in Ireland with particular reference to the impact of la-bor issues 2001, Economic and Social Review 32 (1), pp. 43-6713.
Hennart, J-F., Park, Y-R., (1993) Greenfield vs. Acquisition: The Strategy of Japanese Investors in the United States, Management Science, 39 (9), pp. 1054-1070
Hymer, S. H., The International Operations of National Firms: A Study of Direct Invest-ment, 1960.
Jonhson, A. (2005), Host Country Effect of Foreign Direct Investment: The Case of De-veloping and Transition Economies, JIBS Dissertation Series No. 031.
Knickerbocker, F. T., Oligopolistic Reaction and the Multinational Enterprise, 1973. Kuemmerle W., 1999a. The drivers of foreign direct investment into research and de-velopment: an empirical investigation. 30 (1), 1-24.
Le Bas, C., Patel, P. The determinants of augmenting and home-base-exploiting R&D activities: some new results on multinationals’ locational strategies. University of Sussex, 2007, paper No. 164
MacSharry, R., White, P. (2000), The Making of the Celtic Tiger: The Inside Story of Ireland's Boom Economy, Dublin: Mercier Press.
Mold, A. (2003) The impact of the single market programme on the location determi-nants of US manufacturing affiliates: an econometric analysis. J. Common Mark. Stud., pp. 41, 37-62.
O’Rourke, K., Why Ireland Emigrated: A Positive Theory of Factor Flows, Oxford Eco-nomic Papers, New Series, Vol. 44, No. 2 (1992), pp. 322-340
Sweeney, P. Ireland's Economic Success: Reasons and Lessons (International Edition). Edinburgh, GBR: Dunedin Academic Press, 2008. p iii.
Todaro, M.P. (Ed.). Economic Development. New York: Addison Wesley Longman. 2002 Vernon, R., "International Investment and International Trade in the Product Cycle", Quarterly Journal of Economics, 1996, 80:190-207.
Figure 1 Corporate Tax Rates. Source: PricewaterhouseCoopers, Tax Brochure 2010, p.15
Online Databases: OECD Stat Extracts:
http://stats.oecd.org/Index.aspx?usercontext=sourceoecd&reason=0 Word bank
http://data.worldbank.org/
http://data.worldbank.org/topic/infrastructure UNCTAD - FDI statistics website
http://stats.unctad.org/FDI/ReportFolders/reportFolders.aspx?sCS_referer=&sCS_Chos enLang=en
CSO – Central Statistics Office Ireland http://www.cso.ie
Appendix
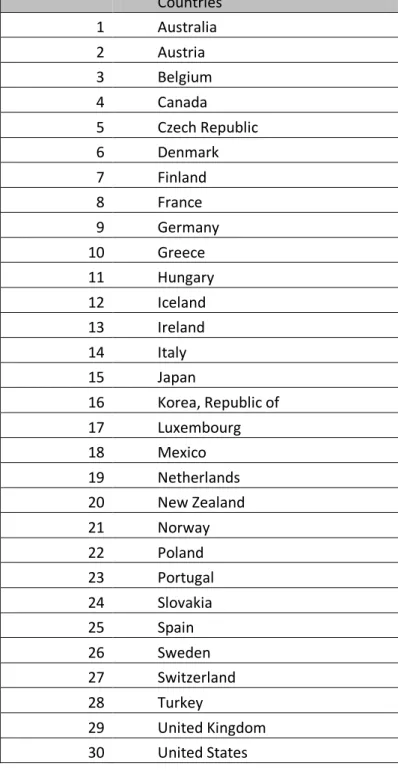
Table 1 OECD Member States
Countries 1 Australia 2 Austria 3 Belgium 4 Canada 5 Czech Republic 6 Denmark 7 Finland 8 France 9 Germany 10 Greece 11 Hungary 12 Iceland 13 Ireland 14 Italy 15 Japan 16 Korea, Republic of 17 Luxembourg 18 Mexico 19 Netherlands 20 New Zealand 21 Norway 22 Poland 23 Portugal 24 Slovakia 25 Spain 26 Sweden 27 Switzerland 28 Turkey 29 United Kingdom 30 United States
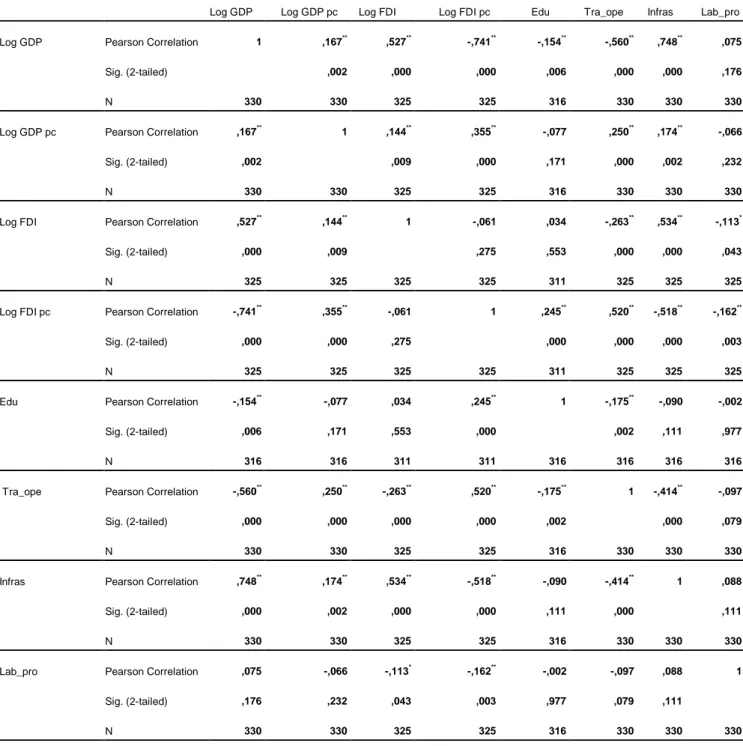
Table 2 Matrix correlations
Correlations
Log GDP Log GDP pc Log FDI Log FDI pc Edu Tra_ope Infras Lab_pro
Log GDP Pearson Correlation 1 ,167** ,527** -,741** -,154** -,560** ,748** ,075
Sig. (2-tailed) ,002 ,000 ,000 ,006 ,000 ,000 ,176
N 330 330 325 325 316 330 330 330
Log GDP pc Pearson Correlation ,167** 1 ,144** ,355** -,077 ,250** ,174** -,066
Sig. (2-tailed) ,002 ,009 ,000 ,171 ,000 ,002 ,232
N 330 330 325 325 316 330 330 330
Log FDI Pearson Correlation ,527** ,144** 1 -,061 ,034 -,263** ,534** -,113*
Sig. (2-tailed) ,000 ,009 ,275 ,553 ,000 ,000 ,043
N 325 325 325 325 311 325 325 325
Log FDI pc Pearson Correlation -,741** ,355** -,061 1 ,245** ,520** -,518** -,162**
Sig. (2-tailed) ,000 ,000 ,275 ,000 ,000 ,000 ,003
N 325 325 325 325 311 325 325 325
Edu Pearson Correlation -,154** -,077 ,034 ,245** 1 -,175** -,090 -,002
Sig. (2-tailed) ,006 ,171 ,553 ,000 ,002 ,111 ,977
N 316 316 311 311 316 316 316 316
Tra_ope Pearson Correlation -,560** ,250** -,263** ,520** -,175** 1 -,414** -,097
Sig. (2-tailed) ,000 ,000 ,000 ,000 ,002 ,000 ,079
N 330 330 325 325 316 330 330 330
Infras Pearson Correlation ,748** ,174** ,534** -,518** -,090 -,414** 1 ,088
Sig. (2-tailed) ,000 ,002 ,000 ,000 ,111 ,000 ,111
N 330 330 325 325 316 330 330 330
Lab_pro Pearson Correlation ,075 -,066 -,113* -,162** -,002 -,097 ,088 1
Sig. (2-tailed) ,176 ,232 ,043 ,003 ,977 ,079 ,111
N 330 330 325 325 316 330 330 330
**. Correlation is significant at the 0.01 level (2-tailed). *. Correlation is significant at the 0.05 level (2-tailed).
Table 3 Summary statistics Descriptive Statistics
N Minimum Maximum Mean Std. Deviation
Log GDP 330 3,8706 7,1380 5,513693 ,6550585
Log FDI inflow 325 2,9637 5,5403 4,672184 ,2519134
Log FDI pc 325 1,6542 5,1142 3,466551 ,5717670
Log GDP pc 330 3,9123 4,9162 4,386541 ,1869001
Infras 330 231 421437 40612,08 65362,702
labor prod 330 ,0000 15313,9000 775,843333 2371,6419729
Valid N (listwise) 311
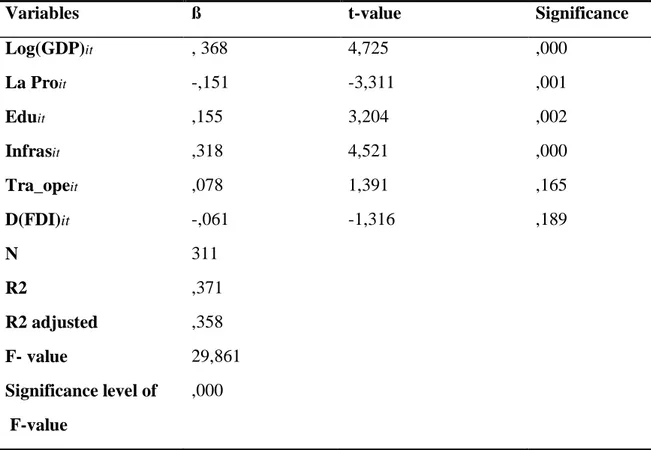
Table 4 Regression Output 1
Variables ß t-value Significance
Log(GDP)it , 368 4,725 ,000 La Proit -,151 -3,311 ,001 Eduit ,155 3,204 ,002 Infrasit ,318 4,521 ,000 Tra_opeit D(FDI)it ,078 -,061 1,391 -1,316 ,165 ,189 N 311 R2 ,371 R2 adjusted ,358 F- value 29,861 Significance level of F-value ,000
Table 5 Regression Output 2
Variables ß t-value Significance
Log(GDP)it ,395. 5,023 ,000 La Proit -,149 -3,318 ,001 Eduit ,169 3,522 ,000 Infrasit ,319 4,592 ,000 Tra_opeit D(FDI) D98 D99 D00 D01 D02 D03 D04 D05 D06 D07 ,106 -0,086 ,033 ,067 ,111 ,029 ,005 -,030 -,060 -,122 ,040 ,036 1,822 -1,843 ,516 1,034 1,708 ,443 ,082 -,454 -,900 -1,841 ,596 ,533 ,069 ,066 ,606 ,302 ,089 ,658 ,935 ,650 ,369 ,067 ,551 ,595 N 311 R2 ,414 R2 adjusted ,382 F- value 12,969 Significance level of F-value ,000
Table 6 Regression Output 3
Variables ß t-value Significance
Log(GDPpc)it ,408 10,427 ,000 La Proit -,068 -1,858 ,064 Eduit ,245 6,599 ,000 Infrasit -,451 -10,533 ,000 Tra_opeit D(FDI) ,278 -,084 6,393 -2,267 ,000 ,024 N 311 R2 ,599 R2 adjusted ,591 F- value 75,747 Significance level of F-value ,000
Table 7 Regression Output 4
Variables ß t-value Significance
Log(GDPpc)it ,440 10,740 ,000 La Proit -,061 -1,676 ,095 Eduit ,253 6,793 ,000 Infrasit -,436 -10,077 ,000 Tra_opeit D(FDI) D98 D99 D00 D01 D02 D03 D04 ,296 -,099 -,009 ,012 ,010 -,028 -,039 -,049 -,082 6,723 -2,652 -,169 ,219 ,192 -,531 -,723 -,916 -1,507 ,000 ,008 ,866 ,827 ,848 ,596 ,470 ,360 ,133
D05 D06 D07 -,113 -,056 -,057 -2,082 -1,030 1,046 ,038 ,304 ,296 N 311 R2 ,614 R2 adjusted ,593 F- value 29,205 Significance level of F-value ,000