Henrik Andersson?, Gunnar Lindberg??
Dept. of Transport Economics, Swedish National Road and Transport Research Institute (VTI), Sweden June 4, 2008
Abstract This study uses the contingent valuation method to elicit individuals’ preferences for their own and others’ safety in road-traffic. Whereas one group is asked about a private safety device for themselves, other groups are asked about safety devices for their children, household, relatives and the public. Support is found for the hypothesis that individuals are not purely selfish when it comes the safety of others.
Key words Safety, Willingness to pay, Altruism, Road-traffic JEL codes D61, D64, H51, I10
? To whom correspondence should be addressed. Corresponding address:
VTI, P.O. Box 55685, SE-102 15 Stockholm, Sweden, e-mail: henrik.andersson@vti.se
?? The authors would like to thank Lars Hultkrantz, Jan Owen Jansson, Olof Johansson-Stenman, and Mikael
Svensson for valuable comments on earlier drafts of this paper. Financial support from Banverket, Vinnova, and V¨agverket is gratefully acknowledged. The authors are solely responsible for the results presented and views expressed in this paper.
1 Introduction
In conventional benefit-cost analysis (BCA) the value of a statistical life (VSL), i.e. the population mean marginal rate of substitution of own wealth for own safety, is used as the benefit measure of safety. That is, the benefit measure is based on the preferences of purely self-interested individuals. In many cases it is clear that people do not act only as self-interested individuals but in a context of social interaction (Becker, 1976; Sen, 1987), and if individuals are not purely self-interested but also concerned about the safety of others, it would seem reasonable, and has been argued, that the value of safety should be augmented by an amount that reflects this altruistic component (Mishan, 1971; Jones-Lee, 1976; Needleman, 1976).
Bergstrom (1982) showed, however, that when individuals can be characterized as pure (or non-paternalistic) altruists, their VSL will be identical to the VSL derived under pure self-interest.1 Hence,
he showed that it will be inappropriate to include an altruistic component in the VSL, and willingness to pay (WTP) for others’ safety should be ignored in BCA.2Jones-Lee (1991, 1992) extended the analysis
and proved that Bergstrom’s result is also valid when preferences are purely paternalistic, but when preferences are safety-paternalistic (cares only about the safety argument in the utility function of others) benevolence should be considered in BCA. Since whether VSL should be augmented or not depends on the form of altruism, and the benefits of reducing the risk can be decisive for the outcome of a BCA, it is important not only to study the magnitude of non-selfishness, but also the form it takes.3
Several studies have empirically examined individuals’ WTP for others’ safety (health). For instance, there is empirical evidence which implies that individuals are safety-paternalistic (V´azquez Rodr´ıguez and Le´on, 2004; Jacobsson et al., 2007; Holmes, 1990). Moreover, Liu et al. (2000), Dickie and Messman (2004) and Chanel et al. (2005) found that mothers and parents were willing to pay more for the safety of their children than for their own safety, Dickie and Gerking (2007) that parents were paternalistic altruists towards their children, and Bateman and Brouwer (2006) and Chanel et al. (2005) that WTP for the entire household is larger than individual WTP.4 However, Leung and Guria (2006) found the
opposite for household WTP, with single household having the highest WTP and inconclusive results
1 Non-paternalistic preferences require that “each individual respect the tastes of others, no matter what he thinks of them” (Archibald and Donaldson, 1976, p. 494). A pure paternalist, on the other hand, is concerned about others but ignores their preferences.
2 The argument that pure altruistic preferences can be ignored in BCA was generalized in Bergstrom (2006) 3 In Sweden, for instance, approximately half of the benefits to society of road projects can be attributable to increased traffic safety (Persson and Lindqvist, 2003).
4 Depending on elicitation format, Bateman and Brouwer (2006) only found weak support for their hypothesis. See also Bateman and Brouwer (2006) for references to other studies that have found a higher value of WTP for child safety.
regarding WTP for child safety. It also seems that most of the empirical evidence shows that individuals are not prepared to pay as much for a public safety measure as for a private measure (Johannesson et al., 1996; de Blaeij et al., 2003; Hultkrantz et al., 2006), even though there is also evidence of the opposite (Viscusi et al., 1988; Ara˜na and Le´on, 2002). Hence, the overall evidence regarding altruism seems inconclusive.
The aim of this study is to further contribute to the empirical analysis of altruism and safety. We explore the domain of selfish and non-selfish safety preferences in a set of questions on road safety, and the safety impact of our good extends from purely private impacts, to impacts on children, the whole household, to relatives and friends and is finally defined as a public good. In order to elicit the preferences for reducing road risk we use the contingent valuation method (CVM) (Mitchell and Carson, 1989; Bateman et al., 2002) on a Swedish sample. Due to the public good characteristic of many public safety programmes and the fact that traffic safety may be achieved through both public programmes and private provision, it is interesting to examine safety both as a private and a public good. By examining respondents’ WTP for different devices (public/private) and for own and others’ safety, we may draw conclusions regarding individuals’ altruistic preferences.
In the following sections 2, 3, and 4 we describe the theoretical framework, how the survey was conducted, the design of the questionnaire, and the empirical models. Section 5 contains the results. Our results indicate that the respondents of our survey are not purely selfish, but are prepared to pay for the safety of children, relatives and friends. Given that people show strong concern for their relatives’ and friends’ safety, we may expect that safety for a public safety measure is valued higher than a private safety device. We find, however, that WTP for the public good is significantly lower compared with the private good. We discuss our findings and draw some conclusions in section 6.
2 The theoretical framework
The theoretical model in this section, due to Jones-Lee (1991, 1992) and Johannesson et al. (1996), is a single-period model in which individuals face two possible outcomes; staying alive or being dead. Let
Vij(.), πij, and yij denote a well-behaved utility function (see, e.g., Varian, 1992), survival probabilities, and wealth, respectively. For simplicity we assume a model with only two individuals and the subscript
i = {1, 2} refers to the individuals with 1 defining the considered individual. The second subscript j = {0, 1} refers to before (0) and with (1) the safety project, with πi0 < πi1. Our utility function can now be written as follows:
which is assumed to be strictly increasing in π1and y1, and non-decreasing in π2and y2. The considered
individual is: (i) purely selfish if ∂V1/∂π2= 0 and ∂V1/∂y2= 0, (ii) a pure altruist or paternalist if both
are strictly positive, and (iii) a safety paternalist if ∂V1/∂π2> 0 and ∂V1/∂y2= 0.5 In the last case the
individual only cares about one aspect regarding others’ well-being, i.e. safety. If, on the other hand, the individual only cares about others’ wealth levels, he/she would be wealth paternalistic.
We start by deriving WTP for a private and a public safety measure following the analysis in Jo-hannesson et al. (1996). Both safety measures affect individuals in the same way, the difference being the characteristic of the good and the way it is financed. The private good is paid for by the individual, whereas the public good is financed through a flat tax. The optimization problems can be written as follows:
V11(π11, y10− p1, π20, y20) = V10, (2)
V11(π11, y10− t1, π21, y20− t1) = V10, (3)
where p1 in Eq. (2) refers to WTP for the private risk reduction and t1 in Eq. (3) is the WTP for the
public safety measure. A selfish and a safety paternalistic individual would report t1= p1 and t1> p1,
respectively. Whereas a pure altruist who believes that t1approximates the WTP of the other individual
would report t1 = p1 (since i = 2 remains at his/her initial utility), if he/she believes that the project
will increase (reduce) the other person’s overall wellbeing he/she would state t1> (<)p1.
We now turn to different scenarios where we examine an individual’s WTP for a private good safety device that will increase the survival probability of someone else. Let p2denote our considered individual’s
WTP for a safety device for i = 2, and the optimization problem may now be written as:
V11(π10, y10− p2, π21, y20) = V10. (4)
It can be shown that p2> 0 when individual 1 is a safety paternalist, a pure altruist or paternalist.
Using Eq. (4) we can also examine intra-household WTP, where we assume that the second individual is a child with zero wealth, i.e. y2= 0. Thus, in this scenario y1 is the household’s wealth level and we
assume that the child’s consumption comes from the wealth of the parent and that expenditures for the child’s risk reduction will be borne by the parent. Unless the parent is wealth paternalistic, p2> 0.
It can also be shown that p2 is the largest when the parent is safety paternalistic. Whether p2 R p1
depends on the parent’s preferences for the safety of his/her child. Finally, let phdefine household WTP
5 Remember, for a pure altruist, (∂V1/∂π2)/(∂V1/∂y2) = (∂V
2/∂π2)/(∂V2/∂y2), since he/she respects the preferences of others (Jones-Lee, 1992; Johansson, 1995).
(p1+ p2≡ ph). When both individuals experience an increase in survival probability, Eq. (4) also implies that ph> p1 for a safety paternalist or a pure altruist or paternalist.
3 Contingent valuation survey
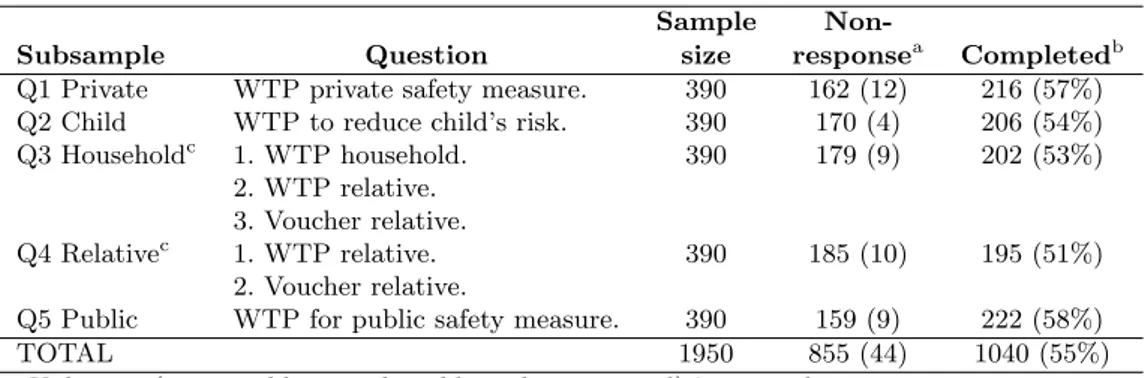
The survey was conducted in the city of ¨Orebro by mail in 1998. Prior to the main survey a pilot was used to both improve the design and decide on the bid levels. The sample in the main survey consisted of 1,950 individuals between 18-76 years of age, and after two reminders the response rate was 55 percent. The sample was split into five groups in order to examine how the respondents’ WTP was affected by which of the following subjects benefited from the safety measure: (i) own, (ii) child, (iii) household, (iv) relatives and friends, and (v) the public. The safety measure for the first four groups was a private good, but a public one in the last subsample. The group that received the question on child safety consisted of households with at least one child younger than 18; addresses to these households were in the mother’s name.6
In order to mitigate the well known problem of individuals’ judgement of small probabilities (Kah-neman and Tversky, 1979; Kah(Kah-neman et al., 1982), including perception of mortality risk (Hakes and Viscusi, 2004; Andersson and Lundborg, 2007), and to make the safety measure more understandable, the risk reduction was presented as an elimination of fatalities and severe injuries in road-traffic.7 An
elimination (in the long run) of fatalities and severe causalities in road-traffic is a national aim of the Swedish transport policy (Vision zero (Prop. 1997/98:56, 1998)), an aim that has received a lot of at-tention in the Swedish media. The city of ¨Orebro was chosen for the survey, since the municipality has prepared a traffic safety programme in accordance with Vision zero. This has also been covered in the lo-cal press, and we, therefore, believe that a scenario with zero fatalities and severe injuries (in accordance with Vision zero) is reasonably credible for the people of ¨Orebro.
3.1 Questionnaire
All questionnaires included information about the number of fatalities and severe injuries in ¨Orebro during 1996 and 1997 and the mean for the period 1993 to 1997, the distribution of the fatalities and severe injuries between modes of transport in a pie-chart, and the actual location of the last year’s accidents on a town map.8 The annual risk was communicated to the respondents in the following way: 6 Addresses for this kind of household were only available in the mothers’ names, which is why questionnaires were only sent out to women.
7 The same scenario was used in Hultkrantz et al. (2006).
8 The average number of fatalities and severe injuries between 1993-1997 was 3 and 16, respectively. The distribution of accidents with severe or fatal outcome was (percent); bicycle 66, car 21, pedestrian 10, moped 2 and motorcycle 1.
¨
Orebro has approximately 120,000 inhabitants. In a group of 10,000 inhabitants, around 2 persons will be killed or severely injured annually in urban traffic if the safety situation is not improved.
[Table 1 about here.]
The five subsamples are found in Table 1 together with sample sizes and response rates. In question-naires Q1-Q4 the safety measure was a private good, whereas in Q5 it was a public good. Both goods were abstract safety devices reducing the risk to zero. The private safety device would reduce the risk to zero for the user of the device and could be rented on an annual basis. The subsample that was asked about a device for themselves (Q1 Private) is used as the reference group in our study and it was presented with the following scenario:
“Assume that a traffic safety device is developed to reduce the fatality and severe injury risk to zero within an urban area, e.g. ¨Orebro. The device may be used by pedestrians, cyclists, and motorists. The device may be rented annually and reduces the risk to zero, as mentioned, but only for the users of the device; it cannot be shared by others. Remember that the rent has to be paid with the annual income of the household.”
The respondents were then asked single bounded dichotomous choice questions:
Would you rent the device for your own use for SEK 200 per year?
In total six bid levels were used, Bid = {200; 1, 000; 2, 000; 5, 000; 10, 000; 20, 000}, where the levels were based on the results of the pilot study.9
The other groups that were asked about the private device (Q2-Q4) were asked similar questions that had been adjusted to fit each scenario. For instance, in Q2 Child the safety device was to be used by one of the respondent’s children younger than 18 and living at home. Moreover, in the question about household safety (Q3 Household), the respondent was asked about a device that would reduce the risk for all members of the household. In the question about total household safety, the bid levels above were doubled, since respondents were asked about a safety device that would reduce the risk for more than one person.
In addition, two subsamples were asked about their willingness to purchase a similar device for a relative or a friend (Q3 and Q4). The subsample Q3 Household was asked about a safety device for a relative/friend after being asked about household safety, whereas Q4 Relative was only asked about a safety device for a relative/friend, this in order to simplify the task (which also eased the budget constraint). Both subsamples were also asked about the number of devices they were prepared to purchase. The scenario was as follows (Q3 Household):
“Assume that you can rent one similar device for someone outside the household (e.g. a relative or a friend). The device can be used where the person lives. The person has not received and will not receive the offer to rent such a device. You have to pay the rent and cannot demand compensation from the person.”
Would you rent the device to someone outside the household (relatives or friends) for SEK 200 per year and person?
“Assume that you got the opportunity to rent additional devices for the same cost (SEK 200 per year and person).”
Would you rent more devices? (0;1;2-10;>10)
Figure 1 describes the questionnaire scheme for relatives’ safety (Q3 and Q4). In both questionnaires, only respondents who were willing to rent the device for relatives were asked if they were prepared to buy their relatives a voucher for free consumption. The purpose of the follow-up question was to be able to distinguish between pure altruistic or paternalistic preferences and safety paternalistic preferences, since only respondents who answer yes to both questions are pure altruists or paternalists. The follow-up question was:
“If you answered yes to the question to rent a device for one person outside the household (relative or friend) for SEK 200 per year, what is your response to the following: Instead of the safety device you can purchase a voucher for SEK 200 per person; he/she can then choose to rent the safety device for one year or use it for some other purpose that he/she would prefer.”
Would you buy a voucher for someone outside the household (relative or friend) for SEK 200 per year and person?
[Figure 1 about here.]
The public good (Q5 Public) was an unspecified safety program and the respondents were assured it would not affect their freedom to choose the transport mode, the quality of the trip, speed or the urban environment. The payment vehicle for the public good was an annual fee earmarked for a traffic safety fund within the municipality. It was highlighted that all other individuals within the municipality also had to pay the fee. This subsample was asked the following question:
Would you pay SEK 200 per year to a traffic safety fund in the municipality to ensure that this programme was introduced in ¨Orebro?
4 Empirical models
We analyze our data using both parametric and parametric estimation techniques. For the non-parametric estimation we use the Turnbull lower bound (TB) estimator of WTP (Turnbull, 1976).10Let
wj and F (wj) denote the bid and the the proportion of no answers to the offered bid. Based on the assumptions that no respondent has a negative or infinitive WTP, i.e. F (0) = 0 and F (∞) = 1, TB mean WTP is estimated by ET B[W T P ] = J X j=0 wj(F (wj+1) − F (wj)) , (5)
where F (wj) should be weakly monotonically increasing. When F (wj) is non-monotonic, the pooled adjustment violators algorithm (PAVA) needs to be used prior to the estimation of Eq. (5) (Turnbull, 1976; Ayer et al., 1955).
When analyzing the data in the parametric model we assume a standard logistic distribution of the acceptance probability (Φ) of the bid for the risk change from π0to π1:
Φ =£1 + e−∆v¤−1, (6)
where ∆v is the expected change in the utility level following from the safety improvement. To examine the acceptance probability we use a logit model (see, e.g., Greene, 2000).
Let X denote a vector of other covariates of the model. When the safety device is a private commodity we can rule out negative WTP (purchase is voluntary) and estimate the mean WTP (w) as the area under the survival function for non-negative WTP values (Johansson, 1995). For the multivariate case mean WTP is estimated as:
w = Z ∞ 0 £ 1 + eα+βw+XΓ¤−1dw = −1 β £ ln¡1 + eα+XΓ¢¤. (7)
where α, β, and Γ denote the constant, the coefficient of the bid, and a parameter vector of the other covariates in the logit regression. Mean WTP for the different safety measures is evaluated by running separate regressions for the subsamples, and then using the same values (the means of the pooled sample) for the variables of X. This way we account for differences of the subsamples, but mean WTP is estimated for an “identical representative individual”. In order to examine the effect of both the safety measure and respondent characteristics on WTP, we also run a regression on the pooled sample. We choose the bid-function approach (Cameron, 1988) instead of the utility-function approach (Hanemann, 1984) for the pooled regression. The reason for choosing the bid-function approach, is because its coefficients show
the covariates marginal effect on WTP, which we believe are of more interest to the readers than their effect on utility.11
5 Results
5.1 Descriptive statistics
In addition to follow-up questions on background characteristics of the respondents, the questionnaire also included questions on the travel patterns of the respondent and his/her household (car mileage, car and bus trips in ¨Orebro, distance walking and cycling) and risk perception. The descriptive statistics for variables used in this study are presented in Table 2.
[Table 2 about here.]
We used a qualitative measure for respondents’ risk perception (lower, same, or higher risk compared to the average). As shown in Table 2, 5 and 17 percent stated that their risk was higher and lower, respectively, than the average in ¨Orebro. Thus, almost 80 percent perceived their risk to be the same as the average. If we compare this to an objective risk estimate, which is based on the respondents’ own travel pattern together with objective risk estimates for the different modes, the average of the estimated objective risks in the sample is close to the objective average risk in the city, 19.6 compared with 20 per 100,000.12 Moreover, the respondents were asked about injury experience as a result of road accidents
and whether they used luminous tags. More than half of the respondents (54 percent) stated that they themselves or someone close to them had been injured as a result of a traffic accident, and over half of the respondents used luminous tags (56 percent).
The descriptive statistics for the different subsamples reveal similar results. The only group that differs from the others is Q2 Child; in this group almost all respondents are women (questionnaire was mailed to the mother), number of children in the household is larger, household income is higher, and respondents are younger. Regarding the whole sample, compared with the general Swedish population, the respondents in the sample are slightly younger, with females overrepresented, and drive more on average (for references, see Andersson, 2007b). Disposable household income is also higher in the sample compared to the general Swedish population (ca. 33 percent).
11 This section has been kept to a minimum. For a more comprehensive description of statistical analysis, see, for instance, Hanemann and Kanninen (1999) or Haab and McConnel (2003).
5.2 Acceptance probability and willingness to pay
The results on probabilities of accepting bids for the different subsamples are shown in Table 3. For the majority of the questions the probabilities are non-increasing with increased bid-level. However, in Q1 and Q4 the proportion of yes answers is non-monotonic with increased bid-levels. The distributions of Table 3 also reveal that to change the safety device for a voucher was only accepted for smaller bid levels.
[Table 3 about here.]
Table 4 shows the result of the follow-up question to the question about relatives’ safety. Of the respondents that wanted to rent at least one device for relatives, over half were prepared to rent more devices. The benevolence goes beyond one and may involve ten or more persons. Between 19 (Q3) and 24 (Q4) percent were prepared to pay the price for a device for the use of relatives or friends. Of these, 14 (Q3) and 18 (Q4) percent were prepared to buy a voucher for their relative’s free consumption, instead of the safety device. The question on the voucher was made conditional on a yes response to the question on relative’s safety device, and thus, only 2.7 (Q3) to 4.3 (Q4) percent of the sample can be said to have purely altruistic or paternalistic preferences, i.e. they were willing to change the safety device for a voucher for free consumption.
[Table 4 about here.]
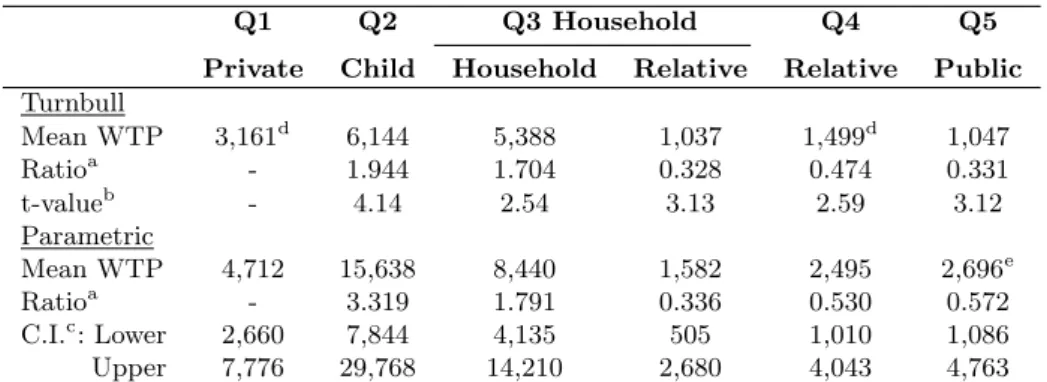
Non-parametric and parametric mean WTP and WTP ratios are shown in Table 5.13 We derive
valuation ratios by relating the WTP for the different subsamples to WTP for Q1 Private. We observe that: (i) child safety is valued twice and three times as high as private safety in the Turnbull and parametric model, respectively, (ii) household safety is valued 70 to 85 percent higher than private safety, (iii) safety for relatives and friends is valued between 33 and 51 percent of private, and (iv) WTP for the public good is 33 to 57 percent of the WTP for the private good. Whereas we can reject our hypothesis of equal means for our Turnbull estimates, only the parametric mean of subsample Q2 is statistically significantly different from Q1 Private.
[Table 5 about here.]
The results of the regression on the pooled sample are shown in Table 6. The subsample that was asked about a private safety device (Q1) is the reference group of the subsamples. The results reveal that WTP for child and household safety is statistically significantly higher than for own safety, whereas
13 The results of the multivariate regressions to estimate the parametric mean WTP have been omitted from the paper, but are available upon request from the authors. The same explanatory variables as in Table 6 were used in these regressions.
WTP for safety for relatives and friends and a public safety measure is statistically significantly lower. Statistical tests also showed that the coefficient estimates of the different subsampels were significantly different (p-value < 0.01), with one exception Q4 Relative and Q5 Public. Regarding the other covariates we find that WTP is increasing with household income but decreasing with the number of adults in the household, and higher and lower among respondents with accident experience and perceived risk lower than the average, respectively.14
[Table 6 about here.]
5.3 Value of statistical cases
The respondents’ WTP reflect their preferences to reduce the risk of both fatalities and severe injuries. This value can be converted to the value of a severe statistical injury (VSSA) by dividing the WTP with the risk reduction (Hultkrantz et al., 2006). In order to derive estimates for the value of a statistical life (VSL) and severe injury risk (VSSI), we employ death-risk equivalents (Viscusi et al., 1991; Persson et al., 2001b). The death-risk equivalents (DRE) express non-fatal outcomes in units of death risks. Let
Ω, r, and p denote the DRE, and the severe injury and fatality risk, respectively, then Ω = VSSI
VSL, (8)
and by assuming the the respondents’ WTP is the sum of their WTP for each risk, VSL and VSSI can be derived as (Hultkrantz et al., 2006),
VSL = WTP
Ω∆r + ∆p, (9)
and
VSSI = Ω · VSL. (10)
In this study we use a DRE equal to 0.154, which is based on the official Swedish values used for BCA (SIKA, 2005). The risk reductions are per 100,000 and are based on the average numbers between 1993-1997, 3 fatalities and 16 severe injuries. In Table 7 we report the values for VSSA, VSL and VSSI for the private and public safety measures. Focusing on the VSL, the TB for the private safety measure is SEK 57.85 million which is 3 times as high as the WTP for the public safety measure. The parametric estimates are higher, but the ratio between the private and the public safety measure is lower, i.e. 1.8.
[Table 7 about here.]
14 The variable High risk was dropped from the regressions since it created a perfect correlation in one of the subsamples.
6 Discussion
This study examines individuals’ WTP for different safety devices and devices for different beneficiaries. Among other things, we find that WTP for a child is higher than private WTP, that WTP for a household is not higher than WTP for a single child, and that WTP for a private good is higher than for a public good. The results concerning child and public WTP are pretty much in line with other findings in the literature (Liu et al., 2000; Johannesson et al., 1996; de Blaeij et al., 2003).
The predominant assumption in the analysis of people’s valuation of safety is that they are selfish. However, our results indicate that they are not purely selfish, but are prepared to pay for the safety of children, relatives and friends. For most of the subsamples the results imply that respondents are either pure altruists/paternalists or safety paternalists. However, when we try to distinguish between the forms of altruistic preferences using the vouchers for the relatives, we find that only between 2.7 − 4.3 percent of the sample may be said to have pure altruistic/paternalistic preferences (they were willing to change the safety device for a voucher).15 This result would imply that individuals are safety paternalists and
that we cannot ignore non-selfish preferences in BCA (Jones-Lee, 1992).
The result of the comparison between the private and public goods is not consistent with this conclu-sion of strong benevolence concerning safety. Given that people show strong concern for their relatives’ and friends’ safety, we expect that safety for all people in ¨Orebro (Q5 Public) is valued higher than private safety (Q1 Private) (Andersson, 2007a). That is not the case. For the public good the results imply that respondents are either impure wealth paternalists or pure altruists who believe that the project will reduce the welfare of others (Johannesson et al., 1996). Previous results have shown that individuals may prefer private rather than public provision of safety (Shogren, 1990). If people believe that public provision of safety will be inefficient they will favor the private alternative. Moreover, the results regarding non-selfish preferences might also have been influenced by “warm glow” (manifested in the act of giving instead of financing welfare anonymously through taxes) (Andreoni, 1989; Crumpler and Grossman, 2008) or “reciprocity” (individuals are willing to contribute to a public good if others also are willing to contribute) (Fehr and G¨achter, 2000; Fehr and Fischbacher, 2002). Reciprocity implies, for instance, that individuals are not prepared to contribute to a public good if serious free riding is expected. Hence, both warm glow and reciprocity can explain the higher WTP for the safety of someone close to oneself (child or household member) compared with WTP for a public safety measure.
15 Our findings are in line with the findings of Jacobsson et al. (2007), who asked subjects to donate either money or nicotine patches to a smoking diabetes patient. When they asked those subjects who were willing to donate patches (41 percent) whether they would have donated more or less money, 19 percent said they would have donated the same amount (81 percent less). Thus, in their study 7.8 percent were prepared to dontate money instead of patches to the diabetes patient.
Hultkrantz et al. (2006) also estimated respondents’ WTP to eliminate fatalities and severe injuries from road traffic in the city of ¨Orebro. Their estimates are based on a parametric model and certainty calibration (Blumenschein et al., 2008), and compared to their estimates of VSSA, VSL, and VSSI ours are close based on TB but higher using the parametric model. For instance, in 2006 price level, our estimates of private and public VSL using TB are SEK 65 and 21 million and based on the logit model SEK 95 and 55 million, whereas theirs were SEK 54 and 20 million. The estimates from our study and Hultkrantz et al. (2006) for a private risk reduction are higher than the official VSL in use in Sweden, SEK 17.31 million (SIKA, 2005), which is based on CVM for a private safety measure (Persson and Cedervall, 1991). These higher estimates could be an effect of the survey design where fatalities and severe injuries would be eliminated, i.e. the estimates may be higher due to a certainty premium (Viscusi, 1989). The usefulness of a direct comparison is, however, limited, since the different values are based on different estimation techniques (non-parametric, parametric, and the use of DRE in two of the studies) and post (certainty) calibration in one of the studies. The values of this study is the range of other Swedish CVM studies, though (Johannesson et al., 1996; Persson et al., 2001a; Johannesson et al., 1996).
In the survey we used a scenario where the safety devices would eliminate the risk of fatalities and severe injuries in road traffic. Even if the people of ¨Orebro are familiar with Vision zero, since it has been given a lot of attention in the city and in Sweden, there is as always the problem with the credibility of the scenario presented in this study. Moreover, the reliability of the CVM in deriving a WTP to reduce health risks has been questioned. Serious problem with embedding, scope and framing effects have been found (Beattie et al., 1998; Hammitt and Graham, 1999). We believe that these problems are most severe when it comes to estimating policy values, such as the VSL, however. The findings in this study on the relationships between respondents’ WTP for own safety, safety for others close to them and for the public therefore contribute to the understanding of people’s altruistic preferences in road safety.
References
Andersson, H. and P. Lundborg: 2007, ‘Perception of own death risk: An analysis of road-traffic and overall mortality risk’. Journal of Risk and Uncertainty 34(1), 67–84.
Andersson, H.: 2007a, ‘Private and Public WTP for Safety - A Validity Test’. Working Paper 2007:14, VTI, Dept. of Transport Economics, Stockholm, Sweden.
Andersson, H.: 2007b, ‘Willingness to Pay for Road Safety and Estimates of the Risk of Death: Evidence from a Swedish Contingent Valuation Study’. Accident Analysis and Prevention 39(4), 853–865. Andreoni, J.: 1989, ‘Impure Altruism and Donations to Public Goods: A Theory of Warm-Glow Giving’.
Journal of Political Economy 97(6), 1447–1458.
Ara˜na, J. E. and C. J. Le´on: 2002, ‘Willingness to pay for health risk reduction in the context of altruism’.
Health Economics 11(7), 623–635.
Archibald, G. C. and D. Donaldson: 1976, ‘Non-Paternalism and the Basic Theorems of Welfare Eco-nomics’. Canadian Journal of Economics 9(3), 492–507.
Ayer, M., H. D. Brunk, G. M. Ewing, W. T. Reid, and E. Silverman: 1955, ‘An Empirical Distribution Function for Sampling with Incomplete Information’. Annals of Mathematical Statistics 26(4), 641– 647.
Bateman, I. J. and R. Brouwer: 2006, ‘Consistency and construction in stated WTP for health risk reductions: A novel scope-sensitivity test’. Resource and Energy Economics 28(3), 199–214.
Bateman, I. J., R. T. Carson, B. Day, M. Hanemann, N. Hanley, T. Hett, M. Jones-Lee, G. Loomes, S. Mourato, ¨Ozdemiro¯glu, D. W. Pearce, R. Sugden, and J. Swanson: 2002, Economic Valuation with
Stated Preference Techniques: A Manual. Cheltenham, UK: Edward Elgar.
Beattie, J., J. Covey, P. Dolan, L. Hopkins, M. W. Jones-Lee, G. Loomes, N. Pidgeon, A. Robinson, and A. Spencer: 1998, ‘On the Contingnent Valuation of Safety and the Safety of Contingent Valuation: Part 1 - Caveat Investigator’. Journal of Risk and Uncertainty 17(1), 5–25.
Becker, G. S.: 1976, The Economic Approach to Human Behavior. Chicago, IL, USA: University of Chicago Press.
Bergstrom, T. C.: 1982, The Value of Life and Safety, Chapt. When is a man’s life worth more than his human capital?, pp. 3–26. Amsterdam, Netherlands: North-Holland.
Bergstrom, T. C.: 2006, ‘Benefit cost in a benevolent society’. American Economic Review 96(1), 339– 351.
Blumenschein, K., G. C. Blomquist, M. Johannesson, N. Horn, and P. Freeman: 2008, ‘Eliciting Willing-ness to Pay without Bias: Evidence from a Field Experiment’. Economic Journal 118(525), 114–137. Cameron, T. A.: 1988, ‘A New Paradigm for Valuing Non-market Goods Using Referendum Data: Max-imum Likelihood Estimation by Censored Logistic Regression’. Journal of Environmental Economics
and Management 15, 355–379.
Carson, R. T. and W. M. Hanemann: 2005, Handbook of Environmental Economics: Valuing
Environmen-tal Changes, Vol. 2 of Handbook in Economics, Chapt. Contingnet Valuation, pp. 821–936. Amsterdam,
the Netherlands: North-Holland, first edition.
Chanel, O., S. Luchini, and J. Shogren: 2005, ‘Does charity begin at home for pollution reductions?’. Document de Travail 57, GREQAM.
Crumpler, H. and P. J. Grossman: 2008, ‘An experimental test of warm glow giving’. Journal of Public
Economics 92, 1011–1021.
de Blaeij, A., R. J. G. M. Florax, P. Rietveld, and E. Verhoef: 2003, ‘The Value of Statistical Life in Road Safety: A Meta-Analysis’. Accident Analysis and Prevention 35(6), 973–986.
Dickie, M. and S. Gerking: 2007, ‘Altruism and environmental risks to health of parents and their children’. Journal of Environmental Economics and Management 53(3), 323–341.
Dickie, M. and V. L. Messman: 2004, ‘Parental altruism and the value of avoiding acute illness: are kids worth more than parents?’. Journal of Environmental Economics and Management 48(3), 1146–1174. Fehr, E. and U. Fischbacher: 2002, ‘Why social preferences matter - the impact of non-selfish motives
on competition, cooperation and incentives’. Economic Journal 112(478), C1–C33.
Fehr, E. and S. G¨achter: 2000, ‘Fairness and Retaliation: The Economics of Reciprocity’. Journal of
Economic Perspectives 14(3), 159–181.
Greene, W. H.: 2000, Econometric Analysis. Upper Sadle River, New Jersey, USA: Prentice-Hall, 4 edition.
Haab, T. C. and K. E. McConnel: 2003, Valuing Environmental and Natural Resources: The Econometrics
of Non-Market Valuation. Cheltenham, UK: Edward Elgar.
Hakes, J. K. and W. K. Viscusi: 2004, ‘Dead Reckoning: Demographic Determinants of the Accuracy of Mortality Risk Perception’. Risk Analysis 24(3), 651–664.
Hammitt, J. K. and J. D. Graham: 1999, ‘Willingness to Pay for Health Protection: Inadequate Sensitivity to Probability?’. Journal of Risk and Uncertainty 18(1), 33–62.
Hanemann, M. and B. Kanninen: 1999, Valuing Environmental Preferences: Theory and Practice of
the Contingent Valuation Method in the US, EU, and Developing Countries, Chapt. The Statistical
Analysis of Discrete-Response CV Data, pp. 302–441. Oxford, UK: Oxford University Press.
Hanemann, W. M.: 1984, ‘Welfare Evaluations in Contingent Valuation Experiments with Discrete Re-sponses’. American Journal of Agricultural Economics 66(3), 332–341.
Holmes, T. P.: 1990, ‘Self-Interest, Altruism, and Health-Risk Reduction: An Economic Analysis of Voting Behavior’. Land Economics 66(2), 140–149.
Hultkrantz, L., G. Lindberg, and C. Andersson: 2006, ‘The Value of Improved Road Safety’. Journal of
Risk and Uncertainty 32(2), 151–170.
Jacobsson, F., M. Johannesson, and L. Borgquist: 2007, ‘Is altrusim paternalistic?’. Economic Journal 117, 761–781.
Johannesson, M., P.-O. Johansson, and R. M. O’Connor: 1996, ‘The Value of Private Safety Versus the Value of Public Safety’. Journal of Risk and Uncertainty 13(3), 263–275.
Johansson, P.-O.: 1995, Evaluating Health Risks: An Economic Approach. Cambridge, UK: Cambridge University Press.
Jones-Lee, M. W.: 1976, The Value of Life: An Economic Analysis. London, UK: Martin Robertsson. Jones-Lee, M. W.: 1991, ‘Altruism and the Value of Other People’s Safety’. Journal of Risk and
Uncer-tainty 4, 213–219.
Jones-Lee, M. W.: 1992, ‘Paternalistic Altruism and the Value of Statistical Life’. Economic Journal 102(410), 80–90.
Kahneman, D., P. Slovic, and A. Tversky: 1982, Judgement under Uncertainty: Heuristics and Biases. New York, NY, USA: Cambridge University Press.
Kahneman, D. and A. Tversky: 1979, ‘Prospect Theory: An Analysis of Decision Under Risk’.
Econo-metrica 47(2), 263–291.
Leung, J. and J. Guria: 2006, ‘Value of statistical life: Adults versus children’. Accident Analysis and
Prevention 38(6), 1208–1217.
Lindberg, G.: 2006, ‘Valuation and Pricing of Traffic Safety’. Ph.D. Thesis, ¨Orebro Studies in Economics 13, Dept. of Economics, Statistics and Informatics, ¨Orebro University, ¨Orebro, Sweden.
Liu, J.-T., J. K. Hammitt, J.-D. Wang, and J.-L. Liu: 2000, ‘Mohter’s Willingness to Pay for Her Own and Her Child’s Health: A Contingent Valuation Study in Taiwan’. Health Economcis 9(4), 319–326. Mishan, E. J.: 1971, ‘Evaluation of Life and Limb: A Theoretical Approach’. Journal of Political Economy
79(4), 687–705.
Mitchell, R. C. and R. T. Carson: 1989, Using Surveys to Value Public Goods. Resources for the Future. Needleman, L.: 1976, ‘Valuing Other People’s Lives’. Manchester School of Economic & Social Studies
44(4), 309–342.
Persson, S. and E. Lindqvist: 2003, ‘V¨ardering av tid, olyckor och milj¨o vid v¨agtrafikinvesteringar -Kartl¨aggning och modellbeskrivning’. Rapport 5270, Naturv˚ardsverket (The Swedish Environmental Protection Agency), Stockholm, Sweden.
Persson, U. and M. Cedervall: 1991, ‘The Value of Risk Reduction: Results of a Swedish Sample Survey’. IHE Working Paper 1991:6, The Swedish Institute for Health Economics.
Persson, U., A. Norinder, K. Hjalte, and K. Gral´en: 2001a, ‘The Value of a Statistical Life in Transport: Findings from a new Contingent Valuation Study in Sweden’. Journal of Risk and Uncertainty 23(2), 121–134.
Persson, U., A. Traw´en, A. Norinder, K. Hjalte, and H. Andersson: 2001b, ‘Relative Risk Values of Non-Fatal Traffic Injuries - A Comparison Between Contingent Valuation, Risk-Risk Trade Off and Standard Gamble Methods’. Swiss Journal of Economics and Statistics 137(1), 117–128.
Prop. 1997/98:56: 1998, ‘Government bill 1997/98:56: Transportpolitik f¨or en h˚allbar utveckling’. Gov-ernment bill by the Swedish GovGov-ernment.
Sen, A.: 1987, On Ethics and Economics. Oxford, UK: Basil Blackwell.
Shogren, J. F.: 1990, ‘The Impact of Self-protection and Self-insurance on Individual Response to Risk’.
Journal of Risk and Uncertainty 3, 191–204.
SIKA: 2005, ‘Kalkylv¨arden och kalkylmetoder - En sammanfattning av Verksgruppens rekommendationer 2005’. Pm 2005:16, SIKA (Swedish Institute for Transport and Communications Analysis), Stockholm, Sweden.
Turnbull, B. W.: 1976, ‘The Empirical Distribution Function with Arbitrarily Grouped, Censored, and Truncated Data’. Journal of the Royal Statistical Society 38(B), 290–295.
Varian, H. R.: 1992, Microeconomic Analysis. New York, NY, USA: W. W. Norton & Company, third edition.
V´azquez Rodr´ıguez, M. X. and C. J. Le´on: 2004, ‘Altruism and the Economic Values of Environmental and Social Policies’. Environmental and Resource Economics 28(2), 233–249.
Viscusi, W. K., W. A. Magat, and A. Forrest: 1988, ‘Altruistic and Private Valuations of Risk Reduction’.
Journal of Policy Analysis and Management 7(2), 227–245.
Viscusi, W. K., W. A. Magat, and J. Huber: 1991, ‘Pricing Environmental Health Risks: Aurvey As-sessments of Risk-risk and Risk-Dollar Trade-Offs for Chronic Bronchitis’. Journal of Environmental
Economics and Management 21(1), 32–51.
Viscusi, W. K.: 1989, ‘Prospective Reference Theory: Toward an Explanation of the Paradoxes’. Journal
Accept a safety device for relatives? Safety paternalistic or pure altruist or paternalist Selfish or wealth paternalist Accept a voucher? Pure altruist or paternalist Safety paternalistic -HH HHHj ©©©© © * ©© © * HHHj Yes No Yes No
Fig. 1 The chosen questionnaire scheme for relative’s safety
Table 1 Subsamples of the survey
Sample
Non-Subsample Question size responsea Completedb
Q1 Private WTP private safety measure. 390 162 (12) 216 (57%)
Q2 Child WTP to reduce child’s risk. 390 170 (4) 206 (54%)
Q3 Householdc 1. WTP household. 390 179 (9) 202 (53%)
2. WTP relative. 3. Voucher relative.
Q4 Relativec 1. WTP relative. 390 185 (10) 195 (51%)
2. Voucher relative.
Q5 Public WTP for public safety measure. 390 159 (9) 222 (58%)
TOTAL 1950 855 (44) 1040 (55%)
a: Unknown (wrong address and could not be contacted) in parentheses. b: Percentage in parentheses excluding unknown.
T able 2 Descriptiv e statistics Q1 Q2 Q3 Q4 Q5 V ariable name Description All Priv ate Child Household Relativ e Public Income Disp osable household income. (1998 prices, USD 1 ≈ SEK 8) 18,299 18,396 20,011 18,505 17,410 17,190 (8,753) (8,095) (8,201) (9,850) (8,614) (8,745) F emale Dumm y equal to one if resp onden t is female and zero otherwise. 0.581 0.468 0.951 0.517 0.477 0.500 (0.494) (0.500) (0.216) (0.501) (0.501) (0.501) Age Age of the resp onden ts. 42.69 45.03 37.20 43.27 43.98 43.76 (14.65) (15.96) (6.82) (15.41) (16.10) (15.39) Driving distance Stated ann ual driving distance. (10 km) 1,514 1,570 1,590 1,419 1,482 1,505 (1,476) (1,401) (1,362) (1,567) (1,554) (1,499) Luminous tag Resp onden t used luminous tag when it is dark outside. 0.561 0.541 0.618 0.591 0.554 0.509 (0.496) (0.499) (0.487) (0.493) (0.498) (0.501) Injury Dumm y co ded as 1 if resp onden t or someone close to him/her 0.536 0.569 0.527 0.550 0.536 0.500 has b een injured as a result of a road acciden t and zero otherwise. (0.499) (0.496) (0.500) (0.499) (0.500) (0.501) Lo w risk a Dumm y equal to 1 if resp onden t stated that his/her risk is 0.170 0.166 0.153 0.163 0.159 0.205 lo w er than the av erage in ¨Orebro and zero otherwise. (0.376) (0.373) (0.361) (0.371) (0.367) (0.404) High risk a Dumm y equal to 1 if resp onden t stated that his/her risk is 0.050 0.065 0.059 0.040 0.031 0.055 higher than the av erage in ¨Orebro and zero otherwise. (0.218) (0.246) (0.236) (0.196) (0.173) (0.228) Child Num b er of children (Age ≤ 18) in the household. 0.559 0.305 2.132 0.428 0.297 0.382 (0.984) (0.706) (0.895) (0.901) (0.705) (0.828) Adult Num b er of adults in the household. 1.093 1.031 1.946 0.946 0.926 1.020 (1.037) (1.044) (0.487) (1.049) (1.052) (1.005) Mean values with standard deviations in paren theses. a: Omitted group, resp onden ts who stated that their risk is the same as the av erage in ¨Orebro.
Table 3 Probabilities of accepting bids
Q1 Q2 Q3 Household Q4 Relative Q5
Bid Private Child Householda Safety Voucher Safety Voucher Public
200 0.658 0.861 0.667 0.410 0.250 0.605 0.217 0.535 1000 0.679 0.704 0.533 0.300 0.111 0.269 0.000 0.297 2000 0.290 0.571 0.351 0.216 0.000 0.235 0.286 0.172 5000 0.163 0.382 0.212 0.121 0.000 0.111 0.000 0.132 10000 0.083 0.324 0.081 0.027 0.000 0.121 0.000 0.027 20000 0.147 0.207 0.074 0.000 0.000 0.000 0.000 0.000
a: The bid levels when asked about household safety were twice the size of the bids in column one. Table 4 Number of demanded safety devices for relatives.
Q3 Householda Q4 Relativea Bidb 1 2 3-11 >11 1 2 3-11 >11 200 7 5 4 0 6 8 9 0 1000 2 1 5 1 4 2 1 0 2000 6 1 1 0 5 3 0 0 5000 1 2 0 1 3 1 0 0 10000 0 0 1 0 2 0 2 0 Proportionc 0.42 0.24 0.29 0.05 0.43 0.30 0.26 0 a: Number of responses.
b: Bid level 20,000 omitted from table since proportion yes answers equal to zero.
c: Of all yes responses
Table 5 Non-parametric and parametric mean WTP
Q1 Q2 Q3 Household Q4 Q5
Private Child Household Relative Relative Public Turnbull Mean WTP 3,161d 6,144 5,388 1,037 1,499d 1,047 Ratioa - 1.944 1.704 0.328 0.474 0.331 t-valueb - 4.14 2.54 3.13 2.59 3.12 Parametric Mean WTP 4,712 15,638 8,440 1,582 2,495 2,696e Ratioa - 3.319 1.791 0.336 0.530 0.572 C.I.c: Lower 2,660 7,844 4,135 505 1,010 1,086 Upper 7,776 29,768 14,210 2,680 4,043 4,763
a: Ratio between WTP for the different subsamples and Q1 Private.
b: t-value for difference in mean estimates between Q1 Private and corresponding subsample. c: 95% confidence intervals. (Bootstrap, 5,000 replications.)
d: PAVA used to estimate WTP since probability vector non-monotonic (Ayer et al., 1955). e: Mean WTP for the Q5 Public was estimated ruling out negative WTP. Allowing for negative WTP reveal the same qualitative relationship between Q1 and Q5.
Table 6 Multivariate WTP regression
Variable Coefficient (Std. Err.)
Q2 Child 7374.618∗∗ (1802.292) Q3 Household 2701.373† (1562.405) Q4 Relative -3834.612∗ (1618.082) Q5 Public -3408.394∗ (1570.538) Incomea 290.945∗∗ (70.193) Female -1814.881 (1154.227) Age 24.525 (38.688) Driving distance -0.371 (0.391) Luminous tag 399.496 (1049.979) Injury 3712.992∗∗ (1034.470) Low risk -3629.260∗∗ (1397.690) Child -398.304 (567.565) Adult -1927.005† (1014.500) Intercept -2826.765 (2821.739) N 942 Pseudo R2 0.206 Significance levels : † : 10% ∗ : 5% ∗∗ : 1% a: Household income per 1,000 SEK.
Table 7 Value of statistical cases in million SEK
Turnbull Parametric
VSSA VSL VSSI VSSA VSL VSSI
Private 16.64 57.85 8.91 24.80 86.23 13.28 Public 5.51 19.16 2.95 14.19 49.34 7.60 VSSA= W T P/∆π, VSL= W T P/(Ω∆r + ∆p), VSSI= Ω·VSL Death risk equivalent, Ω = 0.154
Risk changes per 100,000: (i) severe morbidity and mortality, ∆π = 19, (ii) morbidity, ∆r = 16, and (iii) mortality, ∆p = 3.