JHEP09(2017)020
Published for SISSA by SpringerReceived: June 16, 2017 Revised: August 9, 2017 Accepted: August 13, 2017 Published: September 5, 2017
Measurement of the inclusive jet cross-sections in
proton-proton collisions at
√
s = 8 TeV with the
ATLAS detector
The ATLAS collaboration
E-mail: atlas.publications@cern.ch
Abstract: Inclusive jet production cross-sections are measured in proton-proton colli-sions at a centre-of-mass energy of √s = 8 TeV recorded by the ATLAS experiment at the Large Hadron Collider at CERN. The total integrated luminosity of the analysed data set amounts to 20.2 fb−1. Double-differential cross-sections are measured for jets defined by the anti-kt jet clustering algorithm with radius parameters of R = 0.4 and R = 0.6 and
are presented as a function of the jet transverse momentum, in the range between 70 GeV and 2.5 TeV and in six bins of the absolute jet rapidity, between 0 and 3.0. The mea-sured cross-sections are compared to predictions of quantum chromodynamics, calculated at next-to-leading order in perturbation theory, and corrected for non-perturbative and electroweak effects. The level of agreement with predictions, using a selection of different parton distribution functions for the proton, is quantified. Tensions between the data and the theory predictions are observed.
Keywords: Hadron-Hadron scattering (experiments), Jet physics ArXiv ePrint: 1706.03192
JHEP09(2017)020
Contents1 Introduction 2
2 ATLAS detector 3
3 Data set and Monte Carlo simulations 4
4 Inclusive jet cross-section definition 5
5 Event and jet selection 5
6 Jet energy calibration and resolution 6
6.1 Jet reconstruction 6
6.2 Jet energy calibration 6
6.3 Jet energy scale uncertainties 7
6.4 Jet energy resolution and uncertainties 8
6.5 Jet angular resolution and uncertainties 9
7 Unfolding of detector effects 9
8 Propagation of the statistical and systematic uncertainties 10
9 Theoretical predictions 11
9.1 Next-to-leading-order QCD calculation 11
9.2 Electroweak corrections 13
9.3 Non-perturbative corrections 13
9.4 NLO QCD matched with parton showers and hadronisation 16
10 Results 17
10.1 Qualitative comparisons of data to NLO QCD calculations 17
10.2 Quantitative comparison of data to NLO QCD calculations 21
10.3 Quantitative comparison of data to NLO QCD calculations with alternative
correlation scenarios 24
10.4 Comparisons with NLO QCD calculation including parton showers and
frag-mentation 25
11 Conclusion 27
A Quantitative comparison of data to NLO QCD calculations with alternate
correlation scenarios 29
JHEP09(2017)020
1 IntroductionThe Large Hadron Collider (LHC) [1] at CERN, colliding protons on protons, provides a unique opportunity to explore the production of hadronic jets in the TeV energy range. In Quantum Chromodynamics (QCD), jet production can be interpreted as the fragmentation of quarks and gluons produced in a short-distance scattering process. The inclusive jet production cross-section (p + p → jet + X) gives valuable information about the strong coupling constant (αs) and the structure of the proton. It is also among the processes
directly testing the experimentally accessible space-time distances.
Next-to-leading-order (NLO) perturbative QCD calculations [2, 3] give quantitative predictions of the jet production cross-sections. Progress in next-to-next-to-leading-order (NNLO) QCD calculations has been made over the past several years [4–9]. After the completion of the first calculations of some sub-processes [10, 11], the complete NNLO QCD inclusive jet cross-section calculation was published recently [12].
As fixed-order QCD calculations only make predictions for the quarks and gluons associated with the short-distance scattering process, corrections for the fragmentation of these partons to particles need to be applied. The measurements can also be compared to Monte Carlo event generator predictions that directly simulate the particles entering the detector. These event generators can be based on calculations with leading-order (LO) or NLO accuracy for the description of the short-distance scattering process as well as additional QCD radiation, hadronisation and multiple parton interactions [13].
Inclusive jet production cross-sections have been measured in proton-antiproton colli-sions at the Tevatron collider at various centre-of-mass energies. The latest and most precise measurements at √s = 1.96 TeV can be found in refs. [14,15]. At the LHC, the ALICE, ATLAS and CMS collaborations have measured inclusive jet cross-sections in proton-proton collisions at centre-of-mass energies of √s = 2.76 TeV [16–18] and √s = 7 TeV [19–23], and recently the CMS Collaboration has also measured them at √s = 8 TeV [24] and √
s = 13 TeV [25].
This paper presents the measurement of the inclusive jet cross-sections in proton-proton collisions at a centre-of-mass energy of √s = 8 TeV using data collected by the ATLAS experiment in 2012 corresponding to an integrated luminosity of 20.2 fb−1. The cross-sections are measured double-differentially and presented as a function of the jet transverse momentum, pT, in six equal-width bins of the absolute jet rapidity, |y|. Jets
are reconstructed using the anti-kt jet clustering algorithm [26] with radius parameters
of R = 0.4 and R = 0.6. The measurement is performed for two jet radius parameters, since the uncertainties in the theoretical predictions are different. The kinematic region of 70 GeV ≤ pT ≤ 2.5 TeV and |y| < 3 is covered.
The measurements explore a higher centre-of-mass energy than the previous ATLAS measurements and are also more precise due to the higher integrated luminosity and the better knowledge of the jet energy measurement uncertainties. Fixed-order NLO QCD predictions calculated for a suite of proton parton distribution function (PDF) sets, cor-rected for non-perturbative (hadronisation and underlying event) and electroweak effects, are quantitatively compared to the measurement results, unfolded for detector effects. The
JHEP09(2017)020
results are also compared to the predictions of a Monte Carlo event generator based on the NLO QCD calculation for the short-distance scattering process matched with parton showers, followed by hadronisation. The measurement is performed with two different jet radius parameters to test the sensitivity to perturbative (higher-order corrections and parton shower) and non-perturbative effects.
The outline of the paper is as follows. A brief description of the ATLAS detector is given in section 2. The inclusive jet production cross-section is defined in section 4. Sec-tion 3gives an overview of the data set and Monte Carlo simulations used. The details of the experimental measurement are presented in the next sections. Section 5describes the event and jet selection for the measurement. The jet energy calibration and the uncertain-ties associated with the jet energy measurements are outlined in section 6. The procedure to unfold the detector effects is detailed in section7 and the propagation of the systematic uncertainties in the measurements is explained in section 8. The theoretical predictions are described in section 9. The results together with a quantitative comparison of the measurements to the theory predictions are presented in section 10.
2 ATLAS detector
The ATLAS experiment [27] at the LHC is a multipurpose particle detector with a forward-backward symmetric cylindrical geometry and a near 4π coverage in solid angle.1 It consists of an inner tracking detector surrounded by a thin superconducting solenoid providing a 2 T axial magnetic field, electromagnetic and hadron calorimeters, and a muon spectrometer. The inner tracking detector covers the pseudorapidity range |η| < 2.5 and is made of silicon pixel, silicon microstrip, and transition-radiation tracking detectors. Lead/liquid-argon (LAr) sampling calorimeters provide electromagnetic (EM) energy measurements with high granularity. A hadron (steel/scintillator-tile) calorimeter covers the central pseudorapidity range (|η| < 1.7). The endcap and forward regions are instrumented with LAr calorimeters for EM and hadronic energy measurements up to |η| = 4.9. The muon spectrometer surrounds the calorimeters and is based on three large air-core toroid superconducting magnets with eight coils each. Its bending power ranges between 2.0 and 6.0 T m for most of the detector.
A three-level trigger system is used to select events. The first-level trigger is imple-mented in hardware and uses a subset of the detector information to reduce the accepted event rate to at most 75 kHz. This is followed by two software-based trigger levels that together reduce the accepted event rate to 400 Hz on average depending on the data-taking conditions during 2012.
The relevant systems used to select events with jets are the minimum-bias trigger scintillators (MBTS), located in front of the endcap cryostats covering 2.1 < |η| < 3.8, as well as calorimeter-based jet triggers covering |η| < 3.2 for central jets [28].
1
ATLAS uses a right-handed coordinate system with its origin at the nominal interaction point (IP)in the centre of the detector and the z-axis along the beam pipe. The x-axis points from the IP to the centre of the LHC ring, and the y-axis points upwards. Cylindrical coordinates (r, φ) are used in the transverse plane, φ being the azimuthal angle around the z-axis. The pseudorapidity is defined in terms of the polar angle θ as η = − ln tan(θ/2). Angular distance is measured in units of ∆R ≡p(∆y)2+ (∆φ)2, where y is
JHEP09(2017)020
3 Data set and Monte Carlo simulationsThe measurement uses proton-proton collision data at a centre-of-mass energy of √
s = 8 TeV collected by the ATLAS detector during the data-taking period of the LHC in 2012. The LHC beams were operated with proton bunches organised in “bunch trains”, with bunch-crossing intervals (or bunch spacing) of 50 ns.
The absolute luminosity measurement is derived from beam-separation scans per-formed in November 2012 and corresponds to 20.2 fb−1 with an uncertainty of 1.9%. The uncertainty in the luminosity is determined following the technique described in refs. [29]. The average number of interactions per bunch crossing, hµi, was 10 ≤ hµi ≤ 36. All data events considered in this analysis have good detector status and data quality.
For the simulation of the detector response to scattered particles in proton-proton collisions, events are generated with the Pythia 8 [30] (v8.160) Monte Carlo event generator. It uses LO QCD matrix elements for 2 → 2 processes, along with a leading-logarithmic (LL) pT-ordered parton shower [31] including photon radiation, underlying-event simulation with
multiple parton interactions [32], and hadronisation with the Lund string model [33]. The MC event generator’s parameter values are set according to the AU2 underlying event tune [34] and the CT10 PDF set [35] is used.
The stable particles from the generated events are passed through the ATLAS detec-tor simulation [36] based on the Geant4 software toolkit [37] and are reconstructed using the same version of the ATLAS software as used to process the data. Effects from mul-tiple proton-proton interactions in the same and neighbouring bunch crossings (pile-up) are included by overlaying inclusive proton-proton collision events (minimum bias), which consist of single-, double- and non-diffractive collisions generated by the Pythia 8 event generator using the A2 tune [34] based on the MSTW2008 LO PDF set [38]. The Monte Carlo events are weighted such that the distribution of the generated mean number of proton-proton collisions per bunch crossing matches that of the corresponding data-taking period. The particles from additional interactions are added before the signal digitisation and reconstruction steps of the detector simulation, but are not considered a signal and are therefore not used in the definition of the cross-section measurement defined in section 4. For the evaluation of non-perturbative effects, the Pythia 8 [30] (v8.186) and Herwig++ [39] (v2.7.1) [40] event generators are also employed as described in section9.3. The latter also uses LO matrix elements for the 2 → 2 short-distance process together with a LL angle-ordered parton shower [41]. It implements an underlying-event simulation based on an eikonal model [42] and the hadronisation process based on the cluster model [43].
The Powheg [44–46] method provides MC event generation based on an NLO QCD calculation matched to LL parton showers using the Powheg Box 1.0 package [47]. In this simulation the CT10 PDF set [35] is used. The simulation of parton showers, the hadronisation and the underlying event is based on Pythia 8 [30] using the AU2 tune [34]. These predictions are refered to as the Powheg predictions in the following.
The renormalisation and factorisation scales for the fixed-order NLO prediction are set to the transverse momentum of each of the outgoing partons of the 2 → 2 process, pBornT .
JHEP09(2017)020
In addition to the hard scatter, Powheg also generates the hardest partonic emission in the event using the LO 2 → 3 matrix element or parton showers. The radiative emissions in the parton showers are limited by the matching scale µM provided by Powheg.
4 Inclusive jet cross-section definition
Jets are identified with the anti-kt [26] clustering algorithm using the four-momentum
recombination scheme, implemented in the FastJet [48] library, using two values of the jet radius parameter, R = 0.4 and R = 0.6. Throughout this paper, the jet cross-section measurements refer to jets built from stable particles defined by having a proper mean decay length of cτ > 10 mm. Muons and neutrinos from decaying hadrons are included in this definition. More information about the particle definition can be found in ref. [49]. These jets are called “particle-level” jets in the following.
The inclusive jet double-differential cross-section, d2σ/dp
Tdy, is measured as a function
of the jet transverse momentum pT in bins of rapidity y. In this context, “inclusive”
cross-section means that all reconstructed jets in accepted events contribute to the measurement in the bins corresponding to their pT and y values.
The kinematic range of the measurement is 70 GeV ≤ pT ≤ 2.5 TeV and |y| < 3.
5 Event and jet selection
A set of single-jet triggers with various pT thresholds are used to preselect events to be
recorded. The highest threshold trigger accepts all events passing the threshold. To keep the trigger rate to an acceptable level, the triggers with lower pT thresholds are only read
out for a fraction of all events.
A pT-dependent trigger strategy is adopted in order to optimise the statistical power
of the measurement. Trigger efficiencies are studied using the trigger decisions in samples selected by lower-threshold jet triggers. The efficiency of the lowest pT jet trigger is
deter-mined with an independent trigger based on the MBTS scintillators. For each measurement bin, the trigger is chosen such that the highest effective luminosity (i.e. the lowest prescale factor) is obtained and the trigger is fully efficient. This procedure is performed separately for each of the jet radius parameters and for each jet rapidity bin.
At least one reconstructed vertex with at least two associated well-reconstructed tracks is required. Jet quality criteria are applied to reject jets from beam-gas events, beam-halo events, cosmic-ray muons and calorimeter noise bursts following the procedure described in ref. [50].
In the 2012 data set the central hadron calorimeter had a few modules turned off for certain long time periods or suffered from power-supply trips that made them non-operational for a few minutes. The energy deposited in these modules is estimated using the energy depositions in the neighbouring modules [50]. This correction overestimates the true deposited energy. Therefore, events where a jet with pT ≥ 40 GeV points to such a
JHEP09(2017)020
6 Jet energy calibration and resolution6.1 Jet reconstruction
Jets are defined with the anti-ktclustering algorithm with the jet radius parameters R = 0.4
and R = 0.6. The input objects for the jet algorithm are three-dimensional topological clusters (topoclusters) [51, 52] built from the energy deposits in calorimeter cells. A lo-cal cluster weighting lo-calibration (LCW) based on the topology of the lo-calorimeter energy deposits is then applied to each topocluster to improve the energy resolution for hadrons impinging on the calorimeter [51,52]. The four-momentum of the LCW-scale jet is defined as the sum of four-momenta of the locally calibrated clusters in the calorimeter treating each cluster as a four-momentum with zero mass.
6.2 Jet energy calibration
Jets are calibrated using the procedure described in refs. [50, 51]. The jet energy is cor-rected for the effect of multiple proton-proton interactions (pile-up) both in collision data and in simulated events. Further corrections depending on the jet energy and the jet pseudorapidity (η) are applied to achieve a calibration that matches the energy of jets composed of stable particles in simulated events. Fluctuations in the particle content of jets and in hadronic calorimeter showers are reduced with the help of observables character-ising internal jet properties. These corrections are applied sequentially (Global Sequential Calibration). Differences between data and Monte Carlo simulation are evaluated using insitu techniques exploiting the pT balance of a jet and a well-measured object such as a
photon (γ+jet balance), a Z boson (Z+jet balance) or a system of jets (multijet balance). These processes are used to calibrate the jet energy in the central detector region, while the pT balance in dijet events is used to achieve an intercalibration of jets in the forward
region with respect to central jets (dijet balance).
The calibration procedure that establishes the jet energy scale (JES) and the associated systematic uncertainty is given in more detail in the following:
Pile-up correction. Jets are corrected for the contributions from additional proton-proton interactions within the same (in-time) or nearby (out-of-time) bunch cross-ings [53]. First, for each event a correction based on the jet area and the median pT density ρ [54, 55] is calculated. The jet area is a measure of the susceptibility
of the jet to pile-up and is determined for each jet. The density, ρ, is a measure of the pile-up activity in the event. Subsequently, an average offset subtraction is performed based on the number of additional interactions and reconstructed vertices (NPV) in the event. It is derived by comparing reconstructed calorimeter jets, with
the jet-area correction applied, to particle jets in simulated inclusive jet events. The correction for contributions from additional proton-proton interactions can also remove part of the soft physics contributions, e.g. the contribution from the under-lying event. This contribution is restored on average by the MC-based jet energy scale correction discussed below. The impact of pile-up subtraction on the jet energy resolution is corrected for in the unfolding step (see section 7).
JHEP09(2017)020
Jet energy scale. The energy and the direction of jets are corrected for instrumental effects (non-compensating response of the calorimeter, energy losses in dead material, and out-of-cone effects) and the jet energy scale is restored on average to that of the particles entering the calorimeter using an inclusive jet Monte Carlo simulation [56]. These corrections are derived in bins of energy and the pseudorapidity of the jet. Global sequential correction. The topology of the calorimeter energy deposits and of
the tracks associated with jets can be exploited to correct for fluctuations in the jet’s particle content [51,57]. The measured mean jet energy depends on quantities such as the number of tracks, the radial extent of the jets as measured from the tracks in the jets, the longitudinal and lateral extent of the hadronic shower in the calorimeter and the hits in the muon detector associated with the jet. A correction of the jet energy based on these quantities can therefore improve the jet resolution and reduce the dependence on jet fragementation effects. The correction is constructed from a MC sample based on one generator such that the jet energy scale correction is unchanged for the inclusive jet sample, but the jet energy resolution is improved and the sensitivity to jet fragmentation effects such as differences between quark-or gluon-induced jets is moderated. The dependence of this cquark-orrection on the MC generator is treated as uncertainty.
Correction for difference between data and Monte Carlo simulation. A residual calibration is applied to correct for remaining differences between the jet energy response in data and simulation. This correction is derived insitu by comparing the results of γ+jet, Z+jet, dijet and multijet pT-balance techniques [56, 58, 59]. The
level of agreement between the jet energy response in the Monte Carlo simulation and the one in the data is evaluated by exploiting the pT balance between a photon or a
Z boson and a jet. In the pT range above about 800 GeV, which cannot be reached
by γ+jet events, the recoil system of low-pT jets in events with more than two jets
is used (multijet balance).
This correction is applied to the central detector region. The relative response in all detector regions is equalised using an intercalibration method that uses the pT
balance in dijet events where one jet is central and one jet is in the forward region of the detector (η-intercalibration).
In the region above pT = 1.7 TeV, where the insitu techniques do not have sufficient
statistical precision, the uncertainty in the jet energy measurement is derived from single-hadron response measurements [60,61].
6.3 Jet energy scale uncertainties
The jet calibration corrections are combined following the procedure described in ref. [56]. The systematic and statistical uncertainties of each of the above mentioned corrections contribute to the total JES uncertainty as independent systematic components.
The insitu techniques are based on various processes leading to jets with different fragmentation patterns. Differences in the calorimeter response to jets initiated by quarks
JHEP09(2017)020
or gluons in the short-distance processes lead to an additional uncertainty. Limited knowl-edge of the exact flavour composition of the analysed data sample is also considered as an uncertainty. An estimation of flavour composition based on the Pythia and the Powheg + Pythia Monte Carlo simulations is used in order to reduce this uncertainty.
A systematic uncertainty needs to be assigned to the correction, based on the muon hits behind the jet, that corrects jets with large energy deposition behind the calorimeter (punch-through).
In total, 66 independent systematic components uncorrelated among each other and fully correlated across pT and η, constitute the full JES uncertainty in the configuration
with the most detailed description of correlations [56]. A simplification is performed in this standard configuration: the η-intercalibration statistical uncertainty being treated as one uncertainty component fully correlated between the jet rapidity and pT bins for which
the η-intercalibration was performed. However, at the level of precision achieved in this analysis a detailed description of the statistical uncertainties of the η-intercalibration cali-bration procedure is important. For this reason, in this measurement, the total statistical uncertainty of the η-intercalibration in the standard configuration is replaced by 240 (250) uncertainty components for jets with R = 0.4 (R = 0.6), propagated from the various bins of the insitu η-intercalibration analysis [58].
The total uncertainty in the JES is below 1% for 100 GeV < pT< 1500 GeV in the
cen-tral detector region (|η| ≤ 0.8) rising both towards lower and higher pT and larger |η| [56].
6.4 Jet energy resolution and uncertainties
The fractional uncertainty in the jet pT resolution (JER) is derived using the same insitu
techniques as used to determine the JES uncertainty from the width of the ratio of the pT of a jet to the pT of a well-measured particle such as a photon or a Z boson [59]. In
addition, the balance between the jet transverse momenta in events with two jets at high pT can be used (η-intercalibration) [58]. This method allows measurement of the JER at
high jet rapidities and in a wide range of transverse momenta. The results from individual methods are combined similarly to those for the JES [56]. This JER evaluation includes a correction for physics effects such as radiation of extra jets which can also alter the pT
ratio width. This correction is obtained from a Monte Carlo simulation.
The JER uncertainty has in total 11 systematic uncertainty components. Nine sys-tematic components are obtained by combining the syssys-tematic uncertainties associated with the insitu methods. The last two are the uncertainty due to the electronic and pile-up noise measured in inclusive proton-proton collisions and the absolute JER difference between data and MC simulation as determined with the insitu methods. The latter is non-zero only for low-pT jets in forward rapidity regions. In the rest of the phase-space
region the JER in MC simulation is better than in data and this uncertainty is eliminated by smearing the jet pT in simulation such that the resulting resolution matches closely the
one in data. Each JER systematic component describes an uncertainty that is fully cor-related in jet pT and pseudorapidity. The 11 JER components are treated independently
JHEP09(2017)020
6.5 Jet angular resolution and uncertainties
The jet angular resolution (JAR) is estimated from comparisons of the polar angles of a reconstructed jet and the matched particle-level jet using the Monte Carlo simulation. This estimate is cross-checked by comparing the standard jets using calorimeter energy deposits as inputs to the ones using tracks in the inner detector [50, 51]. A relative uncertainty of 10% is assigned to the JAR to account for possible differences between data and MC simulation.
7 Unfolding of detector effects
The reconstructed jet spectra in data are unfolded to correct for detector inefficiencies and resolution effects to obtain the inclusive jet cross-section that refers to the stable particles entering the detector. The detector unfolding is based on Monte Carlo simulation and is performed in three consecutive steps, namely, a correction for the matching impurity at reconstruction level, the unfolding for resolution effects and a correction for the matching inefficiency at particle level, as explained below. In order to account for migrations from lower pT into the region of interest, this study is performed in a wider pT range than the
one for the final result.
The unfolding of the detector resolution in jet pT is based on a modified Bayesian
technique, the Iterative Dynamically Stabilised (IDS) method [62]. This unfolding method uses a transfer matrix describing the migrations of jets across the pT bins, between the
particle level and the reconstruction level. A minimal number of iterations in the IDS unfolding method is chosen such that the residual bias, evaluated through a data-driven closure test (see below), is within a tolerance of 1% in the bins with less than 10% statistical uncertainty. In this measurement this is achieved after one iteration.
The transfer matrix used in the unfolding is derived by matching a particle level jet with a reconstructed jet in Monte Carlo simulations, when both are closer to each other than to any other jet and lie within a radius of ∆R = 0.3.
The matching purity, P, is defined as the ratio of the number of matched reconstructed jets to the total number of reconstructed jets. The matching efficiency, E , is defined as the ratio of the number of matched particle jets to the total number of particle jets. If jets migrate to other rapidity bins, they are considered together with the jets that are completely unmatched. In this way the migrations across rapidity bins are effectively taken into account by bin-to-bin corrections.
The final result is given by
Nipart =X
j
Njreco· Pj· Aij / Ei, (7.1)
where i and j are the bin indices of the jets at particle- and reconstructed-levels and Npart and Nreco are the number of particle-level and reconstructed jets in a given bin. The symbol A denotes the unfolding matrix obtained by the IDS method from the transfer matrix. The element Aij describes the probability for a reconstructed jet in pT bin j to
JHEP09(2017)020
The precision of the unfolding technique is assessed using a data-driven closure test [20,62]. The particle-level pT spectrum in the MC simulation is reweighted such
that the reweighted reconstructed spectrum and the data agree. The reconstructed spec-trum in this reweighted MC simulation is then unfolded using the same procedure as for the data. The ratio of the unfolded spectrum to the reweighted particle-level spectrum provides an estimate of the unfolding bias. The residual bias is taken into account as a systematic uncertainty. After one IDS iteration, this uncertainty is of the order of a few per mille in the whole phase-space region, except for the very high pT bins in each of the
rapidity bins, where it grows to a few percent (up to 15% in certain cases).
The statistical and systematic uncertainties are evaluated by repeating the unfolding as explained in section 8.
8 Propagation of the statistical and systematic uncertainties
The statistical uncertainties are propagated through the unfolding procedure using an ensemble of pseudo-experiments. For each pseudo-experiment in the ensemble, a weight fluctuated according to a Poisson distribution with a mean value equal to one is applied to each event in data and simulation. This procedure takes into account the correlation between jets produced in the same event. The unfolding is performed for each pseudo-experiment. An ensemble of 10000 pseudo-experiments is used to calculate a covariance matrix for the cross-section in each jet rapidity bin. The total statistical uncertainty is obtained from the covariance matrix, where bin-to-bin correlations are also encoded. The separate contributions from the data and from the MC statistics are obtained from the same procedure by fluctuating only either the data or the simulated events. Furthermore, an overall covariance matrix is constructed to describe the full statistical covariance among all analysis bins.
To propagate the JES uncertainties to the measurement, the jet pT is scaled up and
down by one standard deviation of each of the components (see section 6) in the MC simulation. The resulting pT spectra are unfolded for detector effects using the nominal
unfolding matrix. The difference between the nominal unfolded cross-section and the one with the jet pT scaled up and down is taken as a systematic uncertainty.
The uncertainty in the JER is the second largest individual source of systematic un-certainty. The effect of each of the 11 JER systematic uncertainty components is evaluated by smearing the energy of the reconstructed jets in the MC simulation such that the res-olution is degraded by the size of each uncertainty component. A new transfer matrix is constructed using the smeared jets and is used to unfold the data spectra. The difference of the cross-sections unfolded with the jet-energy-smeared transfer matrix and the nomi-nal transfer matrix is taken as a systematic uncertainty. The JER uncertainty is applied symmetrically as an upward and downward variation.
The JAR is propagated to the cross-section in the same way as for the JER.
The uncertainty associated with the residual model dependence in the unfolding pro-cedure is described in section 7. The systematic uncertainties propagated through the
JHEP09(2017)020
unfolding are evaluated using a set of pseudo-experiments for each component, as in the evaluation of the statistical uncertainties.
The use of pseudo-experiments for the evaluation of the systematic uncertainties allows an evaluation of the statistical fluctuations. The statistical fluctuations of the systematic uncertainties are reduced using a smoothing procedure. For each component, the pT bins
are combined until the propagated uncertainty value in the bin has a Poisson statistical significance larger than two standard deviations. A Gaussian kernel smoothing [50] is used to restore the original fine bins.
An uncertainty for the jet cleaning procedure described in section 5 is estimated from the relative difference between the efficiencies obtained from the distributions with and without the jet quality cut in data and simulation.
The uncertainty in the luminosity measurement of 1.9% [29] is propagated as being correlated across all measurement bins.
An uncertainty in the beam energy of 0.1% [63] is considered when comparing data with the theory prediction at a fixed beam energy. The induced uncertainty at the cross-section level is evaluated by comparing the theory predictions at the nominal and shifted beam energies. It amounts for 0.2% at low pT and 1% at high pT in the central region and
rises up to 3% at highest pT and high rapidity. This uncertainty is similar for jets with
R = 0.4 and R = 0.6.
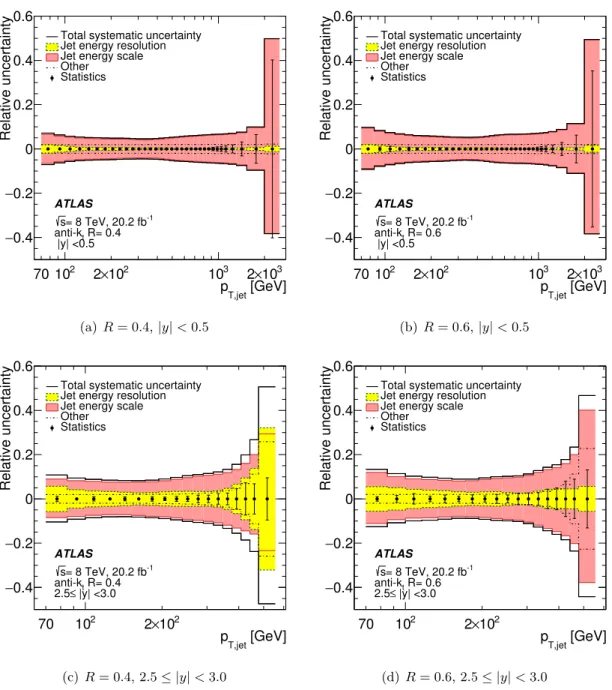
The individual systematic uncertainty sources are treated as uncorrelated with each other for the quantitative comparison of the data and the theory prediction. When shown in figures the individual uncertainties are added in quadrature to obtain the total systematic uncertainty. The shape of the systematic uncertainties follows a log-normal distribution, as in the analysis of inclusive jet production at 7 TeV [19]. The systematic uncertainties in the inclusive jet cross-section measurement are shown in figure 1 for representative rapidity regions for anti-kt jets with R = 0.4 and R = 0.6. In the central (forward) region
the total uncertainty is about 5% (10%) at medium pT of 300–600 GeV. The uncertainty
increases towards both lower and higher pT reaching to 15% at low pT and 50% at high
pT. The JES and JER uncertainties for jets with different sizes are rather similar at the
jet level. However, at the cross-section level differences occur due to the different slopes of the distributions.
The dominant systematic uncertainty source for the measurement of the inclusive jet cross-sections is related to the jet energy measurement. The jet energy scale uncertainty is larger than the jet energy resolution uncertainty.
9 Theoretical predictions
9.1 Next-to-leading-order QCD calculation
The NLOJet++ [64] (v4.1.3) software program is used to calculate the NLO QCD predic-tions for the 2 → 2 processes for the inclusive jet cross-secpredic-tions. The renormalisation and factorisation scales are set to the pT of the leading jet in the event, i.e. µR = µF= pjet,maxT .
For fast and flexible calculations with various PDFs as well as different renormalisation and factorisation scales, the APPLGRID software [65] is interfaced with NLOJet++.
JHEP09(2017)020
[GeV] T,jet p 70102 2×10² 103 2×10³ Relative uncertainty 0.4 − 0.2 − 0 0.2 0.4 0.6Total systematic uncertainty Jet energy resolution Jet energy scale Other Statistics ATLAS -1 = 8 TeV, 20.2 fb s R= 0.4 t anti-k |y| <0.5 (a) R = 0.4, |y| < 0.5 [GeV] T,jet p 70102 2×10² 103 2×10³ Relative uncertainty 0.4 − 0.2 − 0 0.2 0.4 0.6
Total systematic uncertainty Jet energy resolution Jet energy scale Other Statistics ATLAS -1 = 8 TeV, 20.2 fb s R= 0.6 t anti-k |y| <0.5 (b) R = 0.6, |y| < 0.5 [GeV] T,jet p 70 102 2×10² Relative uncertainty 0.4 − 0.2 − 0 0.2 0.4 0.6
Total systematic uncertainty Jet energy resolution Jet energy scale Other Statistics ATLAS -1 = 8 TeV, 20.2 fb s R= 0.4 t anti-k |y| <3.0 ≤ 2.5 (c) R = 0.4, 2.5 ≤ |y| < 3.0 [GeV] T,jet p 70 102 2×10² Relative uncertainty 0.4 − 0.2 − 0 0.2 0.4 0.6
Total systematic uncertainty Jet energy resolution Jet energy scale Other Statistics ATLAS -1 = 8 TeV, 20.2 fb s R= 0.6 t anti-k |y| <3.0 ≤ 2.5 (d) R = 0.6, 2.5 ≤ |y| < 3.0
Figure 1. Relative systematic uncertainty for the inclusive jet cross-section as a function of the jet transverse momentum pT,jet. The total systematic uncertainty is shown by the black line.
The individual uncertainties are shown in colours: the jet energy scale (red), jet energy resolution (yellow) and the other uncertainties (JAR, jet selection, luminosity and unfolding bias) added in quadrature. The results are shown for the (a,b) first and (c,d) last jet rapidity bins and for anti-kt
jets with (a,c) R = 0.4 and (b,d) R = 0.6. The statistical uncertainty is shown by the vertical error bar on each point.
The inclusive jet cross-sections are presented for the CT14 [66], MMHT2014 [67], NNPDF3.0 [68], HERAPDF2.0 [69] PDF sets provided by the LHAPDF6 [70] library. The value for the strong coupling constant αs is taken from the corresponding PDF set.
JHEP09(2017)020
Three sources of uncertainty in the NLO QCD calculation are considered: the PDFs, the choice of renormalisation and factorisation scales, and the value of αs. The PDF
uncer-tainty is defined at 68% confidence level (CL) and is evaluated following the prescriptions given for each PDF set, as recommended by the PDF4LHC group for PDF-sensitive analy-ses [71]. The scale uncertainty is evaluated by varying the renormalisation and factorisation scales by a factor of two with respect to the original choice in the calculation. The enve-lope of the cross-sections with all possible combinations of the scale variations, except the ones when the two scales are varied in opposite directions, is considered as a systematic uncertainty. An alternative scale choice, µR = µF = pjetT , the pT of each individual jet that
enters the cross-section calculation, is also considered. This scale choice is proposed in ref. [72]. The difference with respect to the prediction obtained for the pjet,maxT scale choice is treated as an additional uncertainty. The uncertainty from αsis evaluated by calculating
the cross-sections using two PDF sets determined with two different values of αs and then
scaling the cross-section difference corresponding to an αs uncertainty ∆αs = 0.0015 as
recommended in ref. [71].
The uncertainties in the NLO QCD cross-section predictions obtained with the CT14 PDF set are shown in figure2for representative phase-space regions. The renormalisation and factorisation scale uncertainty is the dominant uncertainty in most phase-space regions, rising from around 5−10% at low pT in the central rapidity bin to about 50% in the highest
pT bins in the most forward rapidity region. This uncertainty is asymmetric and it is larger
for anti-kt jets with R = 0.6 than for jets with R = 0.4. The alternative scale choice, pjetT ,
leads to a similar inclusive jet cross-section at the highest jet pT, but gives an increasingly
higher cross-section when the jet pT decreases. For pT = 70 GeV this difference is about
10%. The PDF uncertainties vary from 5% to 50% depending on the jet pT and rapidity.
The αsuncertainty is about 3% and is rather constant in the considered phase-space regions.
9.2 Electroweak corrections
The NLO QCD predictions are corrected for electroweak effects derived using an NLO calculation in the electroweak coupling (α) and based on a LO QCD calculation [73]. The CTEQ6L1 PDF set is used [74]. This calculation includes tree-level effects on the cross-section of O(ααS, α2) as well as effects of loops of weak interactions at O(αα2s). Effects
of photon or W/Z radiation are not included in the corrections. Real W/Z radiation may affect the cross-section by a few percent at pT∼ 1 TeV [75].
The correction factors were derived in the phase space considered for the measurement presented here and are provided by the authors of ref. [73] through a private communication. No uncertainty associated with these corrections is presently estimated.
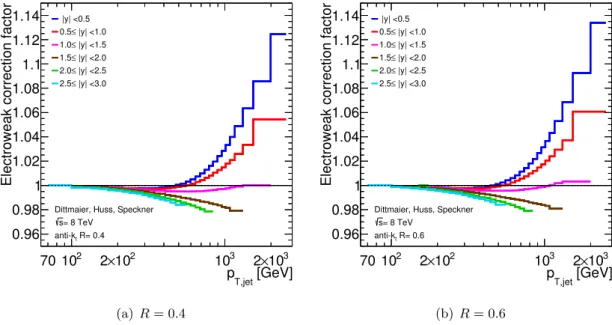
Figure 3 shows the electroweak corrections for jets with R = 0.4 and R = 0.6. The correction reaches more than 10% for the highest pTin the lowest rapidity bin, but decreases
rapidly as the rapidity increases. It is less than 3% for jets with |y| > 1. 9.3 Non-perturbative corrections
In order to compare the fixed-order NLO QCD calculations to the measured inclusive jet cross-sections, corrections for non-perturbative (NP) effects need to be applied. Each
JHEP09(2017)020
[GeV]T,jet p
70102 2×10² 103 2×10³
Relative NLO QCD uncertainty
0.3 − 0.2 − 0.1 − 0 0.1 0.2 0.3 0.4 NLO QCD s α CT14 PDF Scale variation Total = 8 TeV s R= 0.4 t anti-k |y| <0.5 T,jet,max = P F µ = R µ (a) R = 0.4, |y| < 0.5 [GeV] T,jet p 70102 2×10² 103 2×10³
Relative NLO QCD uncertainty
0.3 − 0.2 − 0.1 − 0 0.1 0.2 0.3 0.4 NLO QCD s α CT14 PDF Scale variation Total = 8 TeV s R= 0.6 t anti-k |y| <0.5 T,jet,max = P F µ = R µ (b) R = 0.6, |y| < 0.5 [GeV] T,jet p 70 102 2×10²
Relative NLO QCD uncertainty
0.6 − 0.4 − 0.2 − 0 0.2 0.4 NLO QCD s α CT14 PDF Scale variation Total = 8 TeV s R= 0.4 t anti-k |y| <3.0 ≤ 2.5 T,jet,max = P F µ = R µ (c) R = 0.4, 2.5 ≤ |y| < 3.0 [GeV] T,jet p 70 102 2×10²
Relative NLO QCD uncertainty
0.6 − 0.4 − 0.2 − 0 0.2 0.4 NLO QCD s α CT14 PDF Scale variation Total = 8 TeV s R= 0.6 t anti-k |y| <3.0 ≤ 2.5 T,jet,max = P F µ = R µ (d) R = 0.6, 2.5 ≤ |y| < 3.0
Figure 2. Relative NLO QCD uncertainties for the inclusive jet cross-section calculated for the CT14 PDF set in the (a,b) central and (c,d) forward region for anti-ktjets with (a,c) R = 0.4 and
(b,d) R = 0.6. Shown are the uncertainties due to the renormalisation and factorisation scales, the αs, the PDF and the total uncertainty. The default scale choice pjet,maxT is used.
bin of the NLO QCD cross-section is multiplied by the corresponding correction for non-perturbative effects.
The corrections are derived using LO Monte Carlo event generators complemented by the leading-logarithmic parton shower by evaluating the bin-wise ratio of the cross-section with and without the hadronisation and the underlying event processes.
JHEP09(2017)020
[GeV] T,jet p
70102 2×10² 103 2×10³
Electroweak correction factor
0.96 0.98 1 1.02 1.04 1.06 1.08 1.1 1.12 1.14 |y| <0.5 |y| <1.0 ≤ 0.5 |y| <1.5 ≤ 1.0 |y| <2.0 ≤ 1.5 |y| <2.5 ≤ 2.0 |y| <3.0 ≤ 2.5
Dittmaier, Huss, Speckner = 8 TeV s R= 0.4 t anti-k (a) R = 0.4 [GeV] T,jet p 70102 2×10² 103 2×10³
Electroweak correction factor
0.96 0.98 1 1.02 1.04 1.06 1.08 1.1 1.12 1.14 |y| <0.5 |y| <1.0 ≤ 0.5 |y| <1.5 ≤ 1.0 |y| <2.0 ≤ 1.5 |y| <2.5 ≤ 2.0 |y| <3.0 ≤ 2.5
Dittmaier, Huss, Speckner = 8 TeV s R= 0.6 t anti-k (b) R = 0.6
Figure 3. Electroweak correction factors for the inclusive jet cross-section as a function of the jet pTfor all jet rapidity bins for anti-kt jets with (a) R = 0.4 and (b) R = 0.6.
The MC event generators are run twice, once with the hadronisation and underlying event switched on and again with these two processes switched off. The inclusive jet cross-sections are built either from the stable particles or from the last partons in the event record, i.e. the partons after the parton showers finished and before the hadronisation process starts. These partons are the ones that are used in the Lund string model and the cluster fragmentation model to form the final-state hadrons. The bin-by-bin ratios of the inclusive jet cross-sections are taken as an estimate for the non-perturbative corrections.
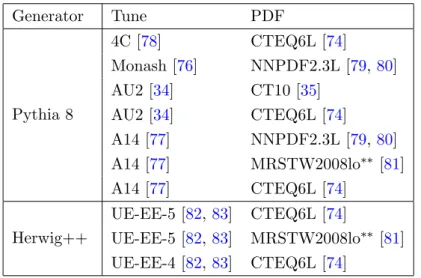
The nominal correction is obtained from the Pythia 8 event generator [30] with the AU2 tune using the CT10 PDF [35], i.e. the same configuration as used to correct the data for detector effects (see section 3). The uncertainty is estimated as the envelope of the corrections obtained from a series of alternative Monte Carlo event generator configurations as shown in table 1.
The correction factors are shown in figure 4 in representative rapidity bins for anti-kt
jets with R = 0.4 and R = 0.6 as a function of the jet pT.
The nominal correction increases the cross-section by 4% (15%) for pT = 70 GeV for
anti-kt jets with R = 0.4 (R = 0.6). The large differences between the two jet sizes result
from the different interplay of hadronisation and underlying-event effects. While for anti-kt
jets with R = 0.4 the contribution from the hadronisation tends to cancel with the one from the underlying event, for anti-kt jets with R = 0.6 the effect from the underlying
event becomes dominant. At large pT the non-perturbative correction factor is close to 1.
JHEP09(2017)020
Generator Tune PDF Pythia 8 4C [78] CTEQ6L [74] Monash [76] NNPDF2.3L [79,80] AU2 [34] CT10 [35] AU2 [34] CTEQ6L [74] A14 [77] NNPDF2.3L [79,80] A14 [77] MRSTW2008lo∗∗ [81] A14 [77] CTEQ6L [74] Herwig++ UE-EE-5 [82,83] CTEQ6L [74] UE-EE-5 [82,83] MRSTW2008lo∗∗ [81] UE-EE-4 [82,83] CTEQ6L [74]Table 1. Summary of Monte Carlo generator configurations used for the evaluation of the non-perturbative corrections. The name of the generator and the soft physics model tune as well as the PDF set used when deriving the tune is specified.
The nominal correction is larger than the correction from other MC configurations. The corrections based on Pythia 8 with the Monash [76] or the A14 [77] tunes give correction factors that are closer to 1. The corrections based on Herwig++ give corrections that are much lower than the one based on Pythia 8. The correction based on Herwig++ is −10% (1%) for pT = 70 GeV for anti-ktjets with R = 0.4 (R = 0.6).
9.4 NLO QCD matched with parton showers and hadronisation
The measured inclusive jet cross-section can be directly compared to predictions based on the Powheg Monte Carlo generator where an NLO QCD calculation for the hard scattering 2 → 2 process is matched to parton showers, hadronisation and underlying event.
A procedure to estimate the effect of the matching of the hard scattering and the parton shower is not yet well established. Therefore, no uncertainties are shown for the Powheg predictions. The Powheg prediction’s uncertainty due to PDF is expected to be similar to that in fixed-order NLO calculations, whereas the uncertainty due to αs is expected to be
larger, and the uncertainty due to the renormalisation and factorisation scales smaller. The simulation using a matched parton shower has a more coherent treatment of the effect of parton showers and hadronisation than the approach using a fixed-order NLO QCD calculation corrected for non-perturbative effects. However, ambiguities in the matching procedure and the tuning of the parton shower parameters based on processes simulated only at leading order by Pythia 8 may introduce additional theoretical uncertainties. There-fore, quantitative comparisons using theoretical uncertainties based on Powheg are not performed in this paper.
JHEP09(2017)020
[GeV] T,jet p 2 10 103Non-perturbative correction factor
0.8 0.85 0.9 0.95 1 1.05 1.1 1.15 1.2 1.25 Pythia8 AU2CT10 Pythia8 AU2-CTEQ6L Pythia8 4C-CTEQ6L Pythia8 MONASH-NNPDF2.3L Pythia8 A14-NNPDF2.3L Pythia8 A14-MSTW2008lo Pythia8 A14-CTEQL1 Herwig++ UE-EE-5-CTEQ6L1 Herwig++ UE-EE-5-MRST** Herwig++ UE-EE-4-CTEQ6L1 Uncertainty = 8 TeV s R=0.4 t anti-k |y|<0.5 ATLAS Simulation (a) R = 0.4, |y| < 0.5 [GeV] T,jet p 2 10 103
Non-perturbative correction factor
0.95 1 1.05 1.1 1.15 1.2 1.25 1.3 Pythia8 AU2CT10 Pythia8 AU2-CTEQ6L Pythia8 4C-CTEQ6L Pythia8 MONASH-NNPDF2.3L Pythia8 A14-NNPDF2.3L Pythia8 A14-MSTW2008lo Pythia8 A14-CTEQL1 Herwig++ UE-EE-5-CTEQ6L1 Herwig++ UE-EE-5-MRST** Herwig++ UE-EE-4-CTEQ6L1 Uncertainty = 8 TeV s R=0.6 t anti-k |y|<0.5 ATLAS Simulation (b) R = 0.6, |y| < 0.5 [GeV] T,jet p 80 102 2×10² 3×10²
Non-perturbative correction factor
0.8 0.85 0.9 0.95 1 1.05 1.1 1.15 1.2 1.25 Pythia8 AU2CT10 Pythia8 AU2-CTEQ6L Pythia8 4C-CTEQ6L Pythia8 MONASH-NNPDF2.3L Pythia8 A14-NNPDF2.3L Pythia8 A14-MSTW2008lo Pythia8 A14-CTEQL1 Herwig++ UE-EE-5-CTEQ6L1 Herwig++ UE-EE-5-MRST** Herwig++ UE-EE-4-CTEQ6L1 Uncertainty = 8 TeV s R=0.4 t anti-k |y|<3.0 ≤ 2.5 ATLAS Simulation (c) R = 0.4, 2.5 ≤ |y| < 3.0 [GeV] T,jet p 80 102 2×10² 3×10²
Non-perturbative correction factor
0.95 1 1.05 1.1 1.15 1.2 1.25 1.3 Pythia8 AU2CT10 Pythia8 AU2-CTEQ6L Pythia8 4C-CTEQ6L Pythia8 MONASH-NNPDF2.3L Pythia8 A14-NNPDF2.3L Pythia8 A14-MSTW2008lo Pythia8 A14-CTEQL1 Herwig++ UE-EE-5-CTEQ6L1 Herwig++ UE-EE-5-MRST** Herwig++ UE-EE-4-CTEQ6L1 Uncertainty = 8 TeV s R=0.6 t anti-k |y|<3.0 ≤ 2.5 ATLAS Simulation (d) R = 0.6, 2.5 ≤ |y| < 3.0
Figure 4. Non-perturbative correction factors as a function of jet pT for (a,b) the most central
and (c,d) most forward region, for jets defined by the anti-kt algorithm with (a,c) R = 0.4 and
(b,d) R = 0.6. The corrections are derived using Pythia 8 and Herwig++ with several soft physics tunes. The envelope of all MC configuration variations is shown as a band.
10 Results
10.1 Qualitative comparisons of data to NLO QCD calculations
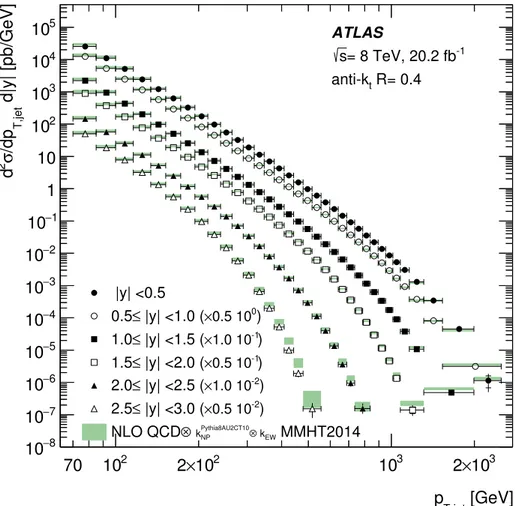
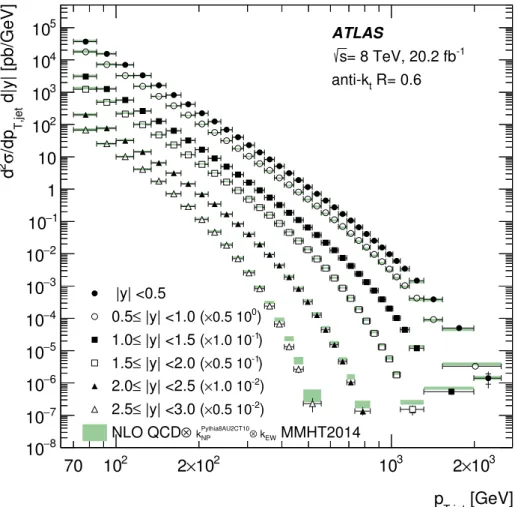
The measured double-differential inclusive jet cross-sections are shown in figure 5 and figure 6 as a function of the jet pT for anti-kt jets with R = 0.4 and R = 0.6 for each jet
rapidity bin. The cross-section covers 11 orders of magnitude in the central rapidity region and 9 orders of magnitude in the forward region. Jet transverse momenta above pT = 2 TeV
JHEP09(2017)020
[GeV] T,jet p 70 102 2×10² 103 2×10³ d|y| [pb/GeV] T,jet /dp σ 2 d 8 − 10 7 − 10 6 − 10 5 − 10 4 − 10 3 − 10 2 − 10 1 − 10 1 10 2 10 3 10 4 10 5 10 |y| <0.5 ) 0 0.5 10 × |y| <1.0 ( ≤ 0.5 ) -1 1.0 10 × |y| <1.5 ( ≤ 1.0 ) -1 0.5 10 × |y| <2.0 ( ≤ 1.5 ) -2 1.0 10 × |y| <2.5 ( ≤ 2.0 ) -2 0.5 10 × |y| <3.0 ( ≤ 2.5 MMHT2014 EW k ⊗ Pythia8AU2CT10 NP k ⊗ NLO QCD ATLAS -1 = 8 TeV, 20.2 fb s R= 0.4 t anti-kFigure 5. Inclusive jet cross-section as a function of jet pT in bins of jet rapidity. The results
are shown for jets identified using the anti-kt algorithm with R = 0.4. For better visibility the
cross-sections are multiplied by the factors indicated in the legend. The data are compared to the NLO QCD prediction with the MMHT2014 PDF set corrected for non-perturbative and electroweak effects. The error bars indicate the statistical uncertainty and the systematic uncertainty in the measurement added in quadrature. The statistical uncertainty is shown separately by the inner vertical line.
are observed. In the most forward region the jet pT reaches about 500 GeV. Tabulated
values of all observed results, with full details of uncertainties and their correlations, are also provided in the Durham HEP database [84].
The measurement is compared to an NLO QCD prediction using the MMHT2014 PDF set [67] based on NLOJet++ corrected for non-perturbative and electroweak effects. The shaded band shows the total theory uncertainty as explained in section 9.1. This theory prediction describes the gross features in the data.
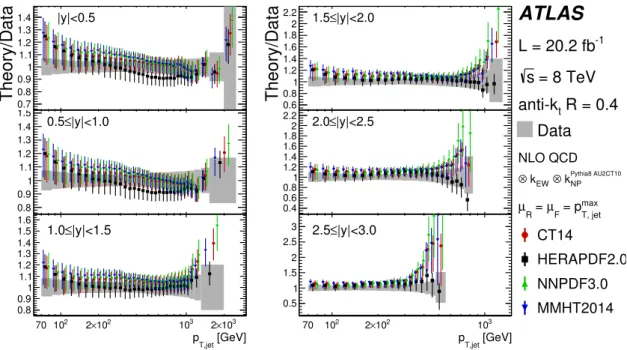
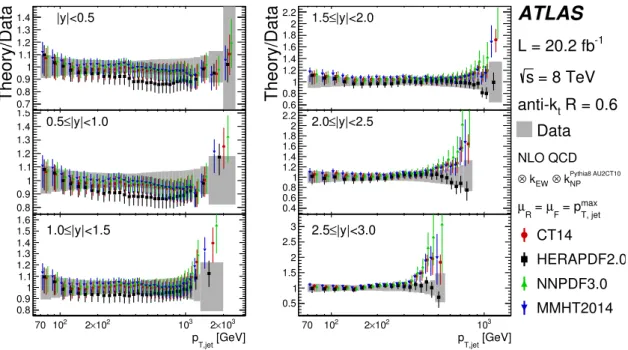
The ratio of NLO QCD calculations to data corrected for non-perturbative and elec-troweak effects for various PDF sets is shown in figure 7 and figure 8 for anti-kt jets
JHEP09(2017)020
[GeV] T,jet p 70 102 2×10² 103 2×10³ d|y| [pb/GeV] T,jet /dp σ 2 d 8 − 10 7 − 10 6 − 10 5 − 10 4 − 10 3 − 10 2 − 10 1 − 10 1 10 2 10 3 10 4 10 5 10 |y| <0.5 ) 0 0.5 10 × |y| <1.0 ( ≤ 0.5 ) -1 1.0 10 × |y| <1.5 ( ≤ 1.0 ) -1 0.5 10 × |y| <2.0 ( ≤ 1.5 ) -2 1.0 10 × |y| <2.5 ( ≤ 2.0 ) -2 0.5 10 × |y| <3.0 ( ≤ 2.5 MMHT2014 EW k ⊗ Pythia8AU2CT10 NP k ⊗ NLO QCD ATLAS -1 = 8 TeV, 20.2 fb s R= 0.6 t anti-kFigure 6. Inclusive jet cross-section as a function of jet pT in bins of jet rapidity. The results
are shown for jets identified using the anti-kt algorithm with R = 0.6. For better visibility the
cross-sections are multiplied by the factors indicated in the legend. The data are compared to the NLO QCD prediction with the MMHT2014 PDF set corrected for non-perturbative and electroweak effects. The error bars indicate the statistical uncertainty and the systematic uncertainty in the measurement added in quadrature. The statistical uncertainty is shown separately by the inner vertical line.
non-perturbative effects. When using Pythia 8 as the nominal non-perturbative correction, the NLO QCD prediction is typically about 10–20% above the data at low pT, whereas the
NLO QCD prediction corrected with Herwig++ follows the data well for anti-kt jets with
R = 0.4, while it is 5–10% below the data for anti-kt jets with R = 0.6.
The comparison is also influenced by the nominal choice of renormalisation and fac-torisation scales in the NLO QCD calculation. Setting the scale to pjetT instead of pjet,maxT (see section9.1) leads to an NLO QCD prediction that is at low jet pT higher than the
pre-diction using the pjet,maxT scale (about 8% at pT = 100 GeV for all pseudorapidity regions).
JHEP09(2017)020
Theory/Data0.70.8 0.9 1 1.1 1.2 1.3 1.4 |y|<0.5 0.8 0.9 1 1.1 1.2 1.3 1.4 1.5 |y|<1.0 ≤ 0.5 [GeV] T,jet p 70 2 10 2 10 × 2 3 10 3 10 × 2 0.8 0.9 1 1.1 1.2 1.3 1.4 1.5 1.6 |y|<1.5 ≤ 1.0 Theory/Data0.60.8 1 1.2 1.4 1.6 1.8 2 2.2 1.5≤|y|<2.0 0.4 0.6 0.81 1.2 1.4 1.6 1.82 2.2 |y|<2.5 ≤ 2.0 [GeV] T,jet p 70 2 10 2 10 × 2 3 10 0.5 1 1.5 2 2.5 3 2.5≤|y|<3.0ATLAS
-1 L = 20.2 fb = 8 TeV s R = 0.4 t anti-k Data NLO QCD Pythia8 AU2CT10 NP k ⊗ EW k ⊗ max T, jet = p F µ = R µ CT14 HERAPDF2.0 NNPDF3.0 MMHT2014Figure 7. Ratio of the inclusive jet cross-section predicted by NLO QCD corrected for non-perturbative and electroweak effects to the cross-section in data as a function of the jet pTin each
jet rapidity bin. Shown are the predictions for various PDF sets for anti-ktjets with R = 0.4. The
points are offset in jet pT for better visibility. The error bars indicate the total theory uncertainty.
The grey band shows the total uncertainty in the measurement.
The recent calculation of NNLO QCD inclusive jet cross-sections at √s = 7 TeV is higher than in NLO QCD at low jet pT for all jet rapidity regions [12]. For instance, for
pT = 100 GeV the increase from NLO to NNLO is about 10%. For both the NNLO and the
NLO QCD calculations the pjet,maxT scale is used. Therefore, it is expected that the NNLO QCD prediction at √s = 8 TeV would deviate from the data more strongly than the NLO QCD calculation. This deviation might need to be accommodated by an adjustment of the PDFs.
Towards higher pT the NLO QCD predictions get closer to the data while for
pT > 1 TeV they rise with respect to the data. For the highest pT at central rapidities
they are typically up to 10–20% higher than data. The behaviour of the CT14, NNPDF3.0 and MMHT2014 PDF sets is similar. The NLO QCD predictions based on the HERA-PDF2.0, however, are significantly lower than data in the region 300 < pT < 1000 GeV.
In the most forward region, |y| > 2, all PDF sets give predictions close to the data at low pT for anti-kt jets with R = 0.4 and R = 0.6. However, towards higher pT and
in particular for pT > 400 GeV the CT14, NNPDF3.0 and MMHT2014 PDF sets give
predictions much higher than the data. The prediction for the HERAPDF2.0 is lower than for the other PDF sets and also falls below the data. In this region, both the experimental and the theoretical uncertainties become large.
Overall, the NLO QCD prediction based on the CT14 PDF set gives the best qualita-tive agreement, while HERAPDF2.0 gives the worst agreement over a wide jet pT range.
JHEP09(2017)020
Theory/Data0.70.8 0.9 1 1.1 1.2 1.3 1.4 |y|<0.5 0.8 0.9 1 1.1 1.2 1.3 1.4 1.5 |y|<1.0 ≤ 0.5 [GeV] T,jet p 70 2 10 2 10 × 2 3 10 3 10 × 2 0.8 0.9 1 1.1 1.2 1.3 1.4 1.5 1.6 |y|<1.5 ≤ 1.0 Theory/Data0.60.8 1 1.2 1.4 1.6 1.8 2 2.2 1.5≤|y|<2.0 0.4 0.6 0.81 1.2 1.4 1.6 1.82 2.2 |y|<2.5 ≤ 2.0 [GeV] T,jet p 70 2 10 2 10 × 2 3 10 0.5 1 1.5 2 2.5 3 2.5≤|y|<3.0ATLAS
-1 L = 20.2 fb = 8 TeV s R = 0.6 t anti-k Data NLO QCD Pythia8 AU2CT10 NP k ⊗ EW k ⊗ max T, jet = p F µ = R µ CT14 HERAPDF2.0 NNPDF3.0 MMHT2014Figure 8. Ratio of the inclusive jet cross-section predicted by NLO QCD corrected for non-perturbative and electroweak effects to the cross-section in data as a function of the jet pTin each
jet rapidity bin. Shown are the predictions for various PDF sets for anti-ktjets with R = 0.6. The
points are offset in jet pT for better visibility. The error bars indicate the total theory uncertainty.
The grey band shows the total uncertainty in the measurement.
However, the central values from the HERAPDF2.0 PDF set are more consistent with the data in the forward region at high pT. This indicates that this measurement has sensitivity
to constrain PDFs.
10.2 Quantitative comparison of data to NLO QCD calculations
A quantitative comparison of the NLO QCD predictions, corrected for non-perturbative and electroweak effects, to the measurement is performed using the method described in ref. [85]. The χ2 value and the corresponding observed p-value, Pobs, are computed taking
into account the asymmetries and the correlations of the experimental and theoretical uncertainties. The individual experimental and theoretical uncertainty components are assumed to be uncorrelated among one another and fully correlated across the pT and y
bins. The correlation of the statistical uncertainties across pT and rapidity bins are taken
into account using covariance matrices derived from 10000 pseudo-experiments obtained by fluctuating the data and the MC simulation (see section 7).
For the theoretical prediction, the uncertainties related to the scale variations, the alternative scale choice, the PDF eigenvectors, the non-perturbative corrections and the strong coupling constant are treated as separate uncertainty components. In the case of the NNPDF3.0 PDF set, the replicas are used to evaluate a covariance matrix, from which the eigenvectors are then determined.
Table 2 shows the evaluated Pobs for the NLO QCD predictions corrected for
JHEP09(2017)020
Pobs
Rapidity ranges CT14 MMHT2014 NNPDF3.0 HERAPDF2.0
Anti-kt jets R = 0.4 |y| < 0.5 44% 28% 25% 16% 0.5 ≤ |y| < 1.0 43% 29% 18% 18% 1.0 ≤ |y| < 1.5 44% 47% 46% 69% 1.5 ≤ |y| < 2.0 3.7% 4.6% 7.7% 7.0% 2.0 ≤ |y| < 2.5 92% 89% 89% 35% 2.5 ≤ |y| < 3.0 4.5% 6.2% 16% 9.6% Anti-kt jets R = 0.6 |y| < 0.5 6.7% 4.9% 4.6% 1.1% 0.5 ≤ |y| < 1.0 1.3% 0.7% 0.4% 0.2% 1.0 ≤ |y| < 1.5 30% 33% 47% 67% 1.5 ≤ |y| < 2.0 12% 16% 15% 3.1% 2.0 ≤ |y| < 2.5 94% 94% 91% 38% 2.5 ≤ |y| < 3.0 13% 15% 20% 8.6%
Table 2. Observed Pobs values evaluated for the NLO QCD predictions corrected for
non-perturbative and electroweak effects and the measured inclusive jet cross-section of anti-ktjets with
R = 0.4 and R = 0.6. Only measurements with pT > 100 GeV are included. The predictions are
evaluated for various PDF sets. The default scale choice pjet,maxT is used.
case, only cross-section measurements with pT> 100 GeV are included in the quantitative
comparison of data and theory to reduce the influence of non-perturbative corrections. For anti-kt jets with R = 0.4, Pobs values larger than about 4% are found for all
cross-sections and PDF sets. This indicates a satisfactory description of the data by the theory. The lowest Pobs values are found in the jet rapidity region 1.5 ≤ |y| < 2.0 and
2.5 ≤ |y| < 3.0. For anti-kt jets with R = 0.6 good agreement is found in the regions with
|y| > 1. Here, the Pobs values are larger than about 10%. However, in the central region
|y| < 1 the agreement is worse than for jets with R = 0.4 resulting in Pobs values of the order of a percent or lower.
Similar studies were performed, for each rapidity bin, in various pT ranges: pT >
70 GeV, 100 < pT < 900 GeV, 100 < pT < 400 GeV. In all these cases, a similar level of
agreement is observed between the measurement and the theory prediction, with a general trend of Pobs values decreasing with the increasing number of bins (i.e. when considering
wider phase-space regions).
In addition to the quantitative comparisons of the theory and data cross-sections in individual jet rapidity bins, all data points can be considered together. Table 3shows the χ2 values for each PDF set, R value and scale choice, when using all the |y| bins together. Various pT ranges are tested. All the corresponding Pobs are much smaller than 10−3. If
the statistical uncertainty of the η-intercalibration were treated as a single component (see section 6), the χ2 values computed in table 3 would be strongly enhanced (by even more than 200 units for some configurations).
JHEP09(2017)020
χ2/ndf pjet,maxT pjetT R = 0.4 R = 0.6 R = 0.4 R = 0.6 pT> 70 GeV CT14 349/171 398/171 340/171 392/171 HERAPDF2.0 415/171 424/171 405/171 418/171 NNPDF3.0 351/171 393/171 350/171 393/171 MMHT2014 356/171 400/171 354/171 399/171 pT> 100 GeV CT14 321/159 360/159 313/159 356/159 HERAPDF2.0 385/159 374/159 377/159 370/159 NNPDF3.0 333/159 356/159 331/159 356/159 MMHT2014 335/159 364/159 333/159 362/159 100 < pT< 900 GeV CT14 272/134 306/134 262/134 301/134 HERAPDF2.0 350/134 331/134 340/134 326/134 NNPDF3.0 289/134 300/134 285/134 299/134 MMHT2014 292/134 311/134 284/134 308/134 100 < pT< 400 GeV CT14 128/72 149/72 118/72 145/72 HERAPDF2.0 148/72 175/72 141/72 170/72 NNPDF3.0 119/72 141/72 115/72 139/72 MMHT2014 132/72 143/72 122/72 140/72Table 3. Summary of χ2/ndf obtained from the comparison of the inclusive jet cross-section and the NLO QCD prediction for various PDF sets and scale choices for anti-ktjets with R = 0.4 and
R = 0.6, for several pTcuts, using all |y| bins. All the corresponding p-values are 10−3.
Further quantitative comparisons using all the |y| bins together were performed in more restricted pTranges (70 < pT < 100 GeV, 100 < pT< 240 GeV, 240 < pT< 408 GeV,
408 < pT < 642 GeV, 642 < pT < 952 GeV and pT > 952 GeV), for the CT14 PDF set.
While good agreement is observed in the range 70 < pT < 100 GeV, for both jet radii R
values, the Pobs values for the other ranges are small (often below 0.1%). For the same five
restricted pTranges above 100 GeV, considering this time pairs of consecutive |y| bins, good
agreement between data and theory is observed in most cases. Good agreement is also ob-served when considering pairs of one central and one forward (i.e. first-last) |y| bins. These tests show that the source of the low Pobs values discussed above is not localised in a single
rapidity bin, nor due to some possible tension between the central and the forward regions. Since the difference between the non-perturbative corrections with two Monte Carlo generators is taken as a systematic uncertainty, the result of the quantitative comparison has little sensitivity to which correction is chosen as the nominal one. Even using the correction that brings the fixed-order NLO QCD to the Powheg prediction, i.e. including an additional correction for parton shower effects, does not alter the Pobs values. It is
JHEP09(2017)020
ref. [86] has a similar effect. The quantitative comparison is also not very sensitive to the choice of nominal renormalisation and factorisation scales in the NLO calculations.
A set of χ2 values were also evaluated for the ABM11 PDF set [87], for R = 0.4 and R = 0.6, for the pjet,maxT and pjetT scale choices, in the full pTrange, for individual |y| bins, as
well as all the |y| bins together. In this case, tension between data and the theory prediction is observed even in individual |y| bins, with Pobs values below 10−3 for both |y| < 0.5 and
0.5 ≤ |y| < 1.0. When using all the |y| bins together, the χ2 is significantly larger than for other PDF sets, by up to 152–232 units compared to the results obtained for CT14.
10.3 Quantitative comparison of data to NLO QCD calculations with
alter-native correlation scenarios
Considering all data points together requires a good understanding of the correlations of the experimental and theoretical systematic uncertainties in jet pT and rapidity. In the
ATLAS JES uncertainty correlation model [50,51,56] the correlations of most uncertainties in the jet energy measurement are generally well known.
Where this is not the case, alternative correlation scenarios are provided alongside the default scenario: the “weaker” correlation scenario proposed in ref. [56] was tested, and found to yield χ2 reductions by up to about 12 units for some phase-space regions.
Correlations of the uncertainties that are based on simple comparisons between two options (two-point systematic uncertainties), e.g. systematic uncertainties due to differences between the fragmentation models in Pythia [30] and Herwig++ [39], are not well defined and therefore different levels of correlations can in principle be used. Concerning the theoretical prediction, the correlations are not well defined for the uncertainty related to the scale variations, the uncertainty related to the alternative scale choice and the uncertainty due to the non-perturbative corrections. For this reason, this analysis investigated in detail the impact of alternative correlation scenarios for the largest sources of two-point experimental uncertainties, as well as for the theoretical uncertainties.
The impact of fully decorrelating (in both pTand |y|) any of those two-point systematic
uncertainties was checked. Potentially important effects are observed when fully decorre-lating the uncertainty due to the response difference between quark- and gluon-induced jets (JES Flavour Response), the jet fragmentation uncertainty in the multijet balance (JES MJB Fragmentation) and the uncertainty in the density of pile-up activity in a given event (ρ) (JES Pile-up Rho topology) (see ref. [56] for more details). However, even if the exact correlations are not known, one must keep in mind that this potential χ2 reduction is
far too optimistic, since some non-negligible level of correlation, in both pT and |y|, is
ex-pected for these uncertainties. This motivated some tests using more realistic decorrelation models for these uncertainties. These experimental systematic uncertainties are split into sub-components whose size varies with jet rapidity and pT. While the sub-components are
independent of each other, each of them is fully correlated between different phase-space regions and their sum in quadrature equals the original uncertainty. A series of 18 differ-ent splitting options into two or three sub-compondiffer-ents, with various smooth pT and |y|
JHEP09(2017)020
pjet,maxT scale choice. While many of these decorrelation options have little impact on the
χ2, some of them induce a χ2 reduction by up to 33 units. When applying various splitting options (the ones yielding the largest χ2 reductions when splitting one single component) to the JES Flavour Response, JES MJB Fragmentation and JES Pile-up Rho topology uncertainties simultaneously, the χ2 is reduced by up to 51 units compared to the nomi-nal JES configuration. For all these variations of the correlations, the corresponding Pobs
values are 10−3.
For the theoretical uncertainties, in addition to the 18 options discussed above, 3 other splitting options based on the ones discussed in ref. [88] were tested. These additional options consist in splitting a given uncertainty component into six sub-components. Many of these decorrelation options have little impact on the χ2, but some of them induce a χ2 reduction by up to 60 units. Still, all the corresponding Pobs values are 10−3.
When applying various splitting options (the ones yielding the largest χ2 reductions when splitting one single component) to the scale variations, the alternative scale choice and the non-perturbative corrections uncertainties simultaneously, the χ2 is reduced by up to 87 units compared to the nominal configuration, but the corresponding Pobs values are
still 10−3.
The various splitting options yielding the largest χ2reductions when splitting either the experimental or the theoretical uncertainties were applied to both the experimental (JES Flavour Response, the JES MJB Fragmentation, JES Pile-up Rho topology) and theoretical uncertainties (the scale variations, the alternative scale choice and the non-perturbative corrections uncertainties) simultaneously. In this case the χ2 evaluated for CT14 is reduced by up to 96 units compared to the nominal configuration, but the corresponding Pobs values
are still below 10−3. Similar reductions of the χ2 values are observed for NNPDF3.0. In summary, all the tested JES uncertainty decorrelation scenarios that could be judged as justifiable from the performance point of view yield small Pobs values. The same is true
when using similar decorrelation scenarios for the theoretical uncertainties. When decor-relating the JES uncertainty components and the theoretical uncertainties simultaneously, values of χ2/ndf down to 256/159 are obtained. Furthermore, it should be noted that for the experimental and theoretical systematic uncertainties that are based on simple compar-isons between two options (e.g. the renormalisation and factorisation scale uncertainties), even the notion of a standard deviation (i.e. the size of the uncertainty itself) in different space regions is not well defined. Since, in addition to the correlations, the phase-space dependence of the size of the uncertainties is a key ingredient in the χ2 evaluation, this second aspect may also explain part of the observed tension between the measurement and the theory.
10.4 Comparisons with NLO QCD calculation including parton showers and
fragmentation
The comparisons of the Powheg predictions with the measurement for jets with R = 0.4 and R = 0.6 are shown in figure 9 and figure 10 as a function of the jet pT in bins
JHEP09(2017)020
Theory/Data0.6 0.8 1 1.2 1.4 |y|<0.5 0.6 0.8 1 1.2 1.4 0.5≤|y|<1.0 [GeV] T,jet p 70 2 10 2 10 × 2 3 10 3 10 × 2 0.6 0.8 1 1.2 1.4 1.6 |y|<1.5 ≤ 1.0 Theory/Data 0.6 0.81 1.2 1.4 1.6 1.82 2.2 2.4 |y|<2.0 ≤ 1.5 0.8 1 1.2 1.4 1.6 1.8 2 2.2 2.0≤|y|<2.5 [GeV] T,jet p 70 2 10 2 10 × 2 3 10 0.5 1 1.5 2 2.5 3 3.5 |y|<3.0 ≤ 2.5ATLAS
-1 L = 20.2 fb = 8 TeV s R = 0.4 t anti-k Data NLO QCD (CT10) Pythia8 AU2CT10 NP k ⊗ EW k ⊗ max T, jet = p F µ = R µ POWHEG (CT10) + PYTHIA8 AU2CT10 EW k ⊗ Born T = p F µ = R µFigure 9. Ratio of the inclusive jet cross-section predicted by the Powheg Monte Carlo event generator with respect to the cross-section in data as a function of the jet pT in each jet rapidity
bin for anti-kt jets with R = 0.4. Only the nominal values of this ratio are indicated. Also shown
is the prediction by NLO QCD corrected for non-perturbative effects, where the error bars indicate the total theory uncertainty. Electroweak corrections are applied for both theory predictions and the CT10 PDF set is used. The points are offset in jet pTfor better visibility. The grey band shows
the total uncertainty in the measurement.
using the CT10 PDF set and corrected for non-perturbative effects with the same MC generator configuration as was used for Powheg. Electroweak corrections are also applied in both cases.
For anti-kt jets with R = 0.4 the Powheg prediction is lower than the one from
fixed-order NLO QCD corrected for non-perturbative effects. This difference increases towards high-pT and decreases with jet rapidity. In the most forward rapidity region the two
predictions are similar. For anti-kt jets with R = 0.6 the Powheg prediction is higher than
the fixed-order NLO QCD prediction at low pT and lower at high pT. In the most forward
rapidity region the two predictions are similar.
The ratio of the Powheg prediction to data is less dependent on the jet radius than the same ratio using the fixed-order NLO QCD prediction corrected for non-perturbative effects. The theory to data ratio for anti-kt jets with R = 0.6 and the same ratio for
anti-kt jets with R = 0.4 is unity within 5% for all jet pT and rapidities while the
fixed-order calculation shows deviations of up to 15% for low pT jets in the central region. This
indicates the importance of parton shower effects in correctly describing the jet radius dependence.