Super Star Clusters in Blue
Compact Galaxies
Evidence for a near-infrared flux excess and properties of the starburst phase
Angela Adamo
Department of Astronomy Stockholm University
and the most intriguing of the blue compact galaxies, Haro 11 (on the right). In spite of the different physical (the Antennae is ∼ 18 Kpc across, whereas Haro 11 is ∼ 4 Kpc) and dynamical scales, the shapes of the two galaxies resemble each other. After an idea by R. Cumming
Image credit:Haro 11 false color composite by ESO/ESA press-release on HST and VLT data. Antennae system false color composition by NASA, ESA, and the Hubble Heritage Team (STScI/AURA)-ESA/Hubble Collaboration.
c
Angela Adamo, Stockholm 2011
ISBN 978-91-7447-215-8
Universitetsservice, US-AB, Stockholm 2011 Department of Astronomy, Stockholm University
Doctoral Dissertation 2011 Department of Astronomy Stockholm University SE-106 91 Stockholm
Abstract
Luminous Blue compact galaxies (BCGs) are metal-poor actively star-forming systems, characterised by bright ultraviolet and blue luminosities. Hubble Space Telescope high-resolution data have revealed that the luminous star-forming knots in these galaxies are composed of hundreds of young massive star clusters. In this work we present a systematic study of the star cluster populations in BCGs with important implications for the formation history of their host systems. The studied galaxies show recently increased star formation rates and a high fraction of massive clusters, probably as a result of minor/major merger events. The age distributions have a peak of cluster formation at only 3.0-4.0 Myr, unveiling a unique sample of clusters still partially embedded. A considerable fraction of clusters (30-50 %), mainly younger than 10 Myr, shows an observed flux excess between 0.8 and 2.2 µm. This so-called near-infrared (NIR) excess is impossible to reproduce even with the most recent spectral synthesis models (that include a self-consistent treatment of the photoionized gas). The origin of the NIR excess, which still remains unexplained, challenges our understanding of the cluster formation process under extreme conditions.
The results achieved in this work have produced important insights into the cluster formation process in BCGs. We suggest that the BCG environment has most likely favoured the compression and collapse of giant molecular clouds into compact massive star clusters. The cluster formation efficiency (i.e., the fraction of star formation happening in star clusters) in BCGs is higher than the reported 8-10 %, for quiescent spirals and local star-forming galaxies. Lu-minous BCGs have a cluster formation efficiency comparable to luLu-minous infrared galaxies and spiral starburst nuclei (the averaged value is ∼ 30 %), suggesting an important role of the merger event in the cluster formation.
List of Papers
This thesis is based on the following publications:
I Adaptive optics imaging and optical spectroscopy of a multi-ple merger in a luminous infrared galaxy
Väisänen, P., Mattila, S., Kniazev, A., Adamo, A. et al. 2008, MN-RAS, 384, 886
II Super Star Clusters in Haro 11: Properties of a Very Young Starburst and Evidence for NIR Flux Excess
Adamo, A., Östlin, G., Zackrisson, E., Hayes, M., Cumming, R. J., and Micheva G., 2010, MNRAS, 407, 870
III On the origin of the Red Excess in very young super star clus-ters: the case of SBS 0335-052E
Adamo, A., Zackrisson, E., Östlin, G., Hayes, M., 2010, ApJ, 725, 1620
IV The Massive Star Clusters in The Dwarf Merger ESO 185-G13: is the NIR Excess Ubiquitous in Starbursts?
Adamo, A., Östlin, G., Zackrisson, E., Hayes, M., 2011, MNRAS accepted
V Star Cluster Formation and Evolution in Mrk 930: Properties of a Metal-Poor Starburst
Adamo, A., Östlin, G., Zackrisson, E., Papaderos, P., Bergvall, N., Rich, R. M., Micheva, G. 2011, MNRAS submitted
VI Probing Cluster Formation under Extreme Conditions: Super Star Clusters in Blue Compact Galaxies
Adamo, A., Östlin, G., and Zackrisson, E., 2011, MNRAS to be submitted
Contents
1 Introduction 1
1.1 My contribution to the papers included in this work . . . 2
2 Young star clusters: formation and early evolution 5 2.1 Introduction . . . 5
2.2 The hierarchy of star formation . . . 5
2.3 The early evolutionary stage: cluster formation and gas expul-sion . . . 7
2.4 Two instructive examples of star clusters at an early stage . . . . 9
3 Young star clusters: statistical, physical, and dynamical properties 13 3.1 Introduction . . . 13
3.2 The study of unresolved star clusters . . . 13
3.2.1 Clusters form in an instantaneous burst . . . 14
3.2.2 Assumption on the initial mass function . . . 15
3.3 The cluster luminosity and mass function . . . 17
3.3.1 The young star clusters . . . 17
3.3.2 The globular clusters . . . 18
3.4 How are young star clusters destroyed? . . . 19
3.5 Relations between the host and its star clusters . . . 21
4 Blue compact galaxies 23 4.1 Introduction . . . 23
4.2 Properties of the blue compacts . . . 23
4.3 The starburst trigger . . . 25
4.4 Multiwavelength observations . . . 26
4.4.1 The ultraviolet range: The Lyα studies . . . 26
4.4.2 Optical imaging and spectroscopy . . . 27
4.4.3 The IR: the dust, the nebular emission and the dearth of PAH . . . 28
4.4.4 The millimetre and radio windows . . . 29
4.5 Similarity between BCGs and high-z galaxies . . . 30
5 Young star clusters in BCGs: a close look at the starburst phase 33 5.1 Introduction . . . 33
5.2 The properties of the star clusters . . . 33
5.2.1 A special ingredient in our SSP models . . . 33
5.2.2 The spread in age and mass of the clusters . . . 34
5.2.3 The near-IR flux excess in young star clusters . . . 36 5.3 The properties of the starburst as revealed by their star clusters 38
Publications not included in this thesis 41
Acknowledgement 43
1
1
Introduction
The formation of a star is a small event in the lifetime of a galaxy, although it involves processes which are barely understood yet. If we enlarge our view on the surrounding region of this star, we discover that this event never happens in isolation, but is part of a network which embraces several newborn stars. However, we are still looking at very small scales! If we inspect the galaxy in its entire structure, we can easily recognise regions which are extremely active in forming stars and others that are more or less quiescent. The bright knots of star formation show clustered groups of stars. Some of them, those who are gravitationally bound, will slowly evolve together until dynamical factors or external events will break the equilibrium between the members of the system and disperse the stars into the galactic field. Not all the stellar groups will dissolve, however. Our galaxy, for example, shows us systems which have survived bound for a hubble time, the so-called globular clusters (GCs).
In this simplified picture of the star formation process we can trace some important factors: i) First, the formation of stars is a hierarchical event. ii) Second, at the nodes of this network, where the gas densities of the interstel-lar medium (ISM) are higher, ensembles of stars are formed. iii) Last, the dis-persion of these knots happens in a gradual fashion and depends of a several factors.
To distinguish among different stellar ensembles, we need to look at the star formation efficiency happening in these nodes. The star formation efficiency is the fraction of gas which has been transformed in stars. If the formation efficiency is low, transient stellar agglomerates and loose OB associations (so called because stars of O and B spectral type are used to find them) are formed. Higher star formation efficiencies (& 30 %) are needed to form gravitationally
bound systems which will survive at least a few hundreds of Myr before they dissolve (i.e. , young star clusters - here referred to as YSCs). The formation of a star cluster is at the top of the star formation process and keeps imprints of the mechanisms at work in the host galaxy.
The subject of this thesis is the study of the starburst properties and evo-lution of a class of special dwarf galaxies in the local universe, the luminous blue compact galaxies (BCGs). These are intriguing systems. They show star-burst activities unsustainable on long timescales and signs of un ancient story, which started in a universe much younger than the one we observe today. The connecting thread between the study of these systems and the YSCs resides in the burst of the star formation activity, which creates numerous star clusters
and star cluster complexes in these galaxies. We will use the clusters to trace the history of the starburst from its beginning and the cluster formation effi-ciency, i.e. the fraction of star formation happening in star clusters. The link between these statistical properties and the starburst goes through the environ-ment of the host galaxies which plays its role as well.
We organise the thesis following the same hierarchy we observe in nature. In Chapter 2, we dissect the different elements involved in the formation of a cluster and a cluster complex. We will discuss the definition of a cluster and use two observational examples of newborn star clusters as reference frames for the studies of the YSCs in BCGs. The latter, in fact, appear as point-like objects and are unresolved in our data. Some of the most important properties of YSCs are collected in Chapter 3. In this chapter, we will focus mostly on the assumptions made in our studies of YSCs and on their statistical proper-ties. We will also describe the different cluster disruption scenarios currently supported. The following chapter, Chapter 4, is dedicated to (mainly obser-vational) studies of the BCGs. We will focus on salient properties of these galaxies which make them interesting to study and understand. In Chapter 5, finally, we put into a wider context some of the common features revealed by the analyses of the YSCs in three luminous BCGs, Haro 11, ESO 185-IG13, and Mrk 930.
1.1
My contribution to the papers included in this work
Paper I. In this paper, a comprehensive multiwavelength study of the lumi-nous infrared galaxy (LIRG) IRAS 19115-2124, dubbed the Bird, is presented. The system is a rare example of a triple galaxy merger. It is a quite obscured system at optical wavebands, but reveals numerous star cluster knots in the infrared (IR). My contribution to this study has been the detection and the analysis of the star cluster population. The difficulty of this study has resided in the interpretation of the observed IR cluster colors and the very limited multiwavelength sample used for probing the cluster SEDs. We have decided to include this paper in the thesis because it is one of the small numbers of works on the analysis of YSCs in LIRGs so far available and because the IR colors of the clusters suggests the presence of a flux excess, possibly similar to what detected in the YSCs of the BCGs (as discussed in Paper II to V)
Paper IIand Paper IV. In these two papers, I was responsible of most of the data reduction, analysis, discussion, references to the literature, and con-clusions. I developed my ownχ2-fitting code. I tested uncertainties perform-ing completeness tests and Monte Carlo simulations of clusters populations. I wrote all the sections of the two papers except Section 4.1 in Paper II.
Paper III. Using the synthetic spectral evolutionary models, accessible in our group, I performed a series of tests to investigate the impact of a
self-1.1 My contribution to the papers included in this work 3
consistent treatment of the photoionized gas emission in the integrated light of a very young star cluster. I led the discussion and wrote most of the contents of the paper except the second paragraph in Section 2.1 and first paragraph of Section 3.
Paper V. In this paper, I applied a similar analysis as in Paper II and Paper IV. I led the data reduction, analysis, discussion, and writing of the Hubble Space Telescope (HST) data and in general of the part of the paper related to the star clusters analysis (Section 1, 2.1, 3, 4, 5.1, 5.2, 5.4, and 6).
Paper VI. In this final paper, I used previous tested relations available in the literature to investigate the nature of the starburst in luminous BCGs. I dis-cussed the results with scenarios available in the literature. I was responsible of the whole analysis and of the paper writing.
5
2
Young star clusters: formation and
early evolution
2.1
Introduction
Star formation is the basic channel through which galaxies build up their stel-lar populations. This process proceeds in different ways: either quiescently, i.e., a small amounts of stars are formed constantly over a period which can be as long as the hubble time; or at such high rate that the fuel supplies (gas) can sustain the burst only for a very short lapse of time.
A close look into these star-forming regions reveals amazingly complex modes of star formation driven by the interaction between gravitational and magnetic forces acting on the gas.
Nearby star-forming regions show us that star formation happens in a clus-tered fashion, i.e. stars form in ensembles, and the ones which are gravitation-ally bound may survive as bound objects over a hubble time. These systems are commonly called star clusters and appear to be a typical outcome of the star formation process acting on large dynamical scales.
Observations in the Milky Way (MW), show that cluster formation has pro-ceeded more or less constantly in our galaxy. The most massive stellar clusters are evolved stellar ensembles, i.e., globular clusters (GC) with ages of a few Gyr. Younger stellar systems, the so-called open clusters (OC), have a wide age range (usually 10 − 100 Myr or older) and smaller masses. In the spiral arms and in the galactic centre, where star formation is actively operating, it is possible to observe also very young stellar clusters with ages less than 10 Myr, which are still embedded or partially embedded in the cloud of gas and dust where they have formed.
In this chapter, we will focus on the formation and early evolution of the young star clusters (YSCs, with this term we will indicate star clusters younger than several hundreds of Myr), using some of the main results achieved from studies of the nearby clusters, where it is possible to resolve their individual components.
2.2
The hierarchy of star formation
Observational evidence suggests that star formation proceeds in a self-similar hierarchical fashion, both in space and time, from galactic to stellar scales (see Elmegreen 2010, for a short review). Studies of young star-forming
re-225° 220° 215° 210° 205° 200° Galactic Longitude −20° −15° −10° −5° G a la ct ic L a ti tu d e Resolution 0.5 1.0 1.5 2.0 225° 220° 215° 210° 205° 200° Galactic Longitude −20° −15° −10° −5° G a la ct ic L a ti tu d e Resolution 225° 220° 215° 210° 205° 200° Galactic Longitude −20° −15° −10° −5° G a la ct ic L a ti tu d e Resolution 0.5 1.0 1.5 2.0 log⌠⌡Tmbdv (K km s−1) 225° 220° 215° 210° 205° 200° Galactic Longitude −20° −15° −10° −5° G a la ct ic L a ti tu d e Resolution
Figure 2.1: The molecular gas map of the Orion complex by Wilson et al. (2005).
Contours and color scales show the velocity-integrated intensity of the CO(1-0) tran-sition line. Monoceros R2 (centre-left region), Orion A (lower central structure), and
Orion B (middle right agglomerate) all have an estimated mass of ∼ 105M⊙.
gions in the MW suggest that clusters form in giant molecular clouds (GMCs, see Lada & Lada 2003, for a review). GMCs are extended and transient struc-tures formed by molecular and neutral gas and dust (McKee & Ostriker 2007). On large scales GMCs are organized in cloud complexes with filamentary morphologies and are mostly located in high density regions, like spiral arms (Grabelsky et al. 1987; Elmegreen & Elmegreen 1987; Engargiola et al. 2003; Wilson et al. 2005). These gigantic structures fragment into GMCs, which then fragment into molecular clumps with masses up to several 105M⊙,
be-ing the seeds where star clusters will form. The latter fragment further down into dense molecular cores which are gravitationally bound. In these cores, the stars are born (Williams et al. 2000). Figure 2.1 shows a molecular map of the Orion GMC complex, which contains 3 famous star-forming regions of the MW: Orion A, Orion B, and Monoceros R2 (Wilson et al. 2005). Elmegreen (2008) suggests a relation between the density of a core clump and the for-mation of a star clusters in it, due to the enhancement of the star forfor-mation efficiency (the ratio between the initial total gas mass and final stellar mass). Star formation proceeds also in lower density regions but with a lower ef-ficiency. Stellar associations and agglomerates, formed in these low density regions will thus be dispersed more easily.
Stars (small scales), associations (intermediate scales, low densities regions), and clusters (large scales, higher densities) are all formed in fractal structures which are spatially more correlated at younger ages. In the two Magellanic Clouds (SMC and LMC) and other dwarf galaxies, studies of the
2.3 The early evolutionary stage: cluster formation and gas expulsion 7
position of the field stars, the associations, and the clusters show a higher clustering for younger samples, and a clear smoothing of the older fractal structures (Gieles et al. 2008; Bastian et al. 2009a, 2010b).
Substructures have also been observed in the cores of currently forming clusters (e.g. Testi et al. 2000; Feigelson et al. 2009), suggesting that the re-sulting system will be formed by the assembling of these sub-systems. The fractal nature of the forming cluster could explain the mass segregation phe-nomenon observed in some YSCs (de Grijs et al. 2002; Gouliermis et al. 2004), i.e. massive stars reside preferentially in the central region of the clus-ter. Mass segregation can be primordial, i.e. massive stars form preferentially in the central most dense regions, or dynamical, i.e., massive stars migrate toward the center because of two-body interactions. By means of numerical simulations, Allison et al. (2009) showed that substructures can dynamically interact in shorter time-scales than homogeneous stellar distributions (which need, instead, a time comparable to the relaxation scale, e.g. Bonnell & Davies 1998), and produce mass segregation in very young stellar clusters. The mas-sive galactic YSC Westerlund 1 shows mass segregation and elongation along the Galactic Plane which can be explained if the system has formed by the merger of subclumps (Gennaro et al. 2010).
2.3
The early evolutionary stage: cluster formation and
gas expulsion
The assembly and collapse of GMCs, which will eventually form clustered groups of stars, is an active field of current theoretical and observational in-vestigation and it has recently being reviewed by McKee & Ostriker (2007). Currently, there are two main branches of theories to explain star formation in GMCs. The global models infer the triggering of star formation to an external cause: shocks from supernova explosions, mid-plane pressures (shear in the galactic medium), and gravitational instabilities. The local models advocate internal triggering mechanisms, like UV-shielding (UV stands for ultravio-let) from massive stars and/or turbulence and magnetic fields internal to the GMCs. In any case, the star formation efficiency in the star forming region determines the survival probability of the newborn cluster.
Lada & Lada (2003) define a cluster as a group of stars in a state of virial equilibrium that is dense enough to survive against the galactic tidal field and the encounter with molecular clouds. Moreover the evaporation time (the lapse of time necessary to dissolve the group) should be higher than 100 Myr (typ-ical age of an OC). From dynam(typ-ical estimates, they find that a group of ∼ 35 stars could be qualified as a cluster.
It is not trivial to make a clear definition of a cluster. Bressert et al. (2010) estimate that only ∼26% of young stellar objects (YSO, accreting protostars with circumstellar disks) in the solar neighbourhood are located in dense
re-Figure 2.2: Cumulative distributions as function of the ratio age-to-crossing time (Π)
of nearby systems for which estimates of the mass, Re f f, and age are available (Gieles
& Portegies Zwart 2011). The panels show samples of different ages, as indicated. The
value ofΠ= 1 is shown with a vertical dashed line. Some of the most known systems
are indicated in the corresponding cumulative fraction values. Clusters withΠ> 1 are
believed to be bound.
gions, i.e. embedded star clusters, while most of the stars form in a hierarchi-cal fashion and will populate the galactic field. This result implies that only a small fraction of the formed stellar agglomerates are gravitationally self-bound, i.e. star clusters.
A recently born cluster is embedded in the cloud of dust and gas where it has formed. This early stage is commonly observed in the resolved YSCs of the MW (Lada & Lada 2003) and of the other nearby star-forming galaxies. It represents the most crucial moment in the lifetime of a cluster, because of the dynamical changes acting on a timescale of a few Myr. The strong UV radia-tion produced by massive stars ionizes the remaining gas and create emitting HIIregions, typically observed in young star-forming regions. Moreover, stel-lar winds and supernova explosions produce feedback which concurs to expel the remaining gas from the interstellar medium. Because stars and gas are ini-tially in virial equilibrium, after the gas expulsion (i.e., mass loss), the stars will dynamically respond to the new gravitational potential, expanding the ra-dius of their orbits to reach a new equilibrium. Using catalogues of YSCs and associations of our galaxy, Lada & Lada (2003) observed that 90 % of the
2.4 Two instructive examples of star clusters at an early stage 9
clusters do not survive the gas expulsion phase. In the literature, this has been referred to as infant mortality of a cluster.
If the gas expulsion happens instantaneously and more than 50 % of the mass is lost (star formation efficiency< 0.5) the system will disperse (Hills
1980). In reality, the gas expulsion, even if it happens on short time scales, is not instantaneous, so the stellar system has some time to respond to the varying potential (Bastian & Goodwin 2006; Larsen 2010). From a compila-tion of local galactic and extragalactic YSCs, OCs, OB associacompila-tions, and loose agglomerates, Portegies Zwart et al. (2010) observe that the effective radius (Re f f, or half light radius) increases as a function of the age of the systems, indeed suggesting, a dynamical evolution of the clusters.
Interestingly, using the same set of data, Gieles & Portegies Zwart (2011) infer an empirical relation to separate clusters from loose associations, which will eventually dissolve. For the latter the crossing time (tcross, the time nec-essary for a member of the cluster to cross the system) is much larger than the age of the stars, so that the ratioΠ=Age/tcross < 1. These systems are, therefore, dynamically unbound. In Figure 2.2, we show a plot from Gieles & Portegies Zwart (2011). The division between bound and unbound systems is more clear once the gas-expulsion phase is over (∼ 10 Myr). Although this definition appears quite solid, it is, however, difficult to apply to studies of star clusters systems for which an estimate of the Re f f is not available or impossi-ble to obtain because of the limited availaimpossi-ble data.
2.4
Two instructive examples of star clusters at an early
stage
In this thesis, we will focus on unresolved extragalactic YSCs and GCs. Due to the distance, these systems cannot be resolved in their different components. For this reason, studies of very young resolved clusters observed in the MW and in nearby local galaxies (< 3 Mpc) can be a unique chance to look into
the details of their formation. Very young star clusters in the Milky Way show, at ages below 6 Myr, a rapid and complex evolution from being deeply em-bedded in the natal GMC to shining in an environment that has been cleared from the dust and the molecular gas.
We present here two instructive examples of resolved YSCs, 30 Doradus (hereafter 30 Dor) and NGC 602 (left and right panel in Figure 2.3), and as-sume that a considerable fraction of the unresolved YSCs studied in Paper I to VI have similar properties and morphologies.
Among the youngest and most massive resolved star clusters, 30 Dor in the Large Magellanic Cloud (LMC) represents the best reference to under-stand what a recently born very massive star cluster looks like. 30 Dor is the central region of the extended Tarantula nebula. Multiwavelength studies of this region have dissected the different components of the complex 30 Dor
Figure 2.3: In the left-side image, a 3-color composition of the 30 Dor region: the
bright UV radiation and high-speed material by the YSC located on the left centre, blow into the clouds of gas and dust. The impact causes the gas and dust to glow, and triggers star formation (Credit: NASA, N. Walborn and J. Maíz-Apellániz (Space Tele-scope Science Institute, Baltimore, MD), R. Barbá (La Plata Observatory, La Plata, Argentina). In the right a 3-color HST composition of NGC 602 by Carlson et al. (2007). The green dots mark the position of the PMS stars and the white circles of the YSOs in the cluster. The latter are systematically located in the outskirts.
environment. Walborn & Blades (1997) identified five different stellar popu-lations in the region: in the bright core, early O-type stars which are part of the compact star cluster R136 (central core of bright stars in the left panel of Figure 2.3); embedded massive YSOs in the north and west regions; and 3 more evolved stellar population groups in the southern and 1 arcmin away in the western region. The R136 cluster has a mass of ∼ 105M⊙and is 3 Myr old
(Portegies Zwart et al. 2010 and references therein). This nuclear region (≤ 3 pc) is dust and gas-free. Recent studies (Crowther et al. 2010) report that stars more massive than the usually assumed theoretical limit of 120 M⊙ reside in
the core of R136, supporting the extreme nature of the star formation process in very massive star clusters.
NCG 602 is a young (∼4 Myr) and rather low-mass (a few times 103M⊙)
star cluster, located in a low gas density region of the SMC (see Carlson et al. 2007). This is a good example of a low mass cluster. Optical HST imaging data shows that the spatial distribution of pre-main sequence stars (PMSs, green dots in the right panel of Figure 2.3) coincide with the position of the main sequence (MS) massive stars (bright blue stars in the image) and appear to be coeval (i.e. the massive stars have reached the MS, while the lower mass stars are still in the contracting phase). Spitzer IR imaging data allowed the detection of a very young population of YSOs located preferentially at the edges of the clusters (white circle in the right panel of Figure 2.3). They are of class type 0-I, i.e., accreting massive proto-stars, with lifetimes much lower than 1 Myr, implying that they have been produced recently and that the star formation has proceeded until now in this region.
2.4 Two instructive examples of star clusters at an early stage 11
Both examples show some common features. The massive and short-lived stars, which rapidly reach the main sequence and produce strong winds and UV radiation, ionize the intracluster gas and create bubbles and shells. These HII regions surround the optically bright core of stars and significantly con-tribute to the integrated fluxes. However, a large fraction of the stars is still accreting material from their dusty disks (YSOs) or contracting (in the PMS phase). The edges of the clusters are places for triggered (Elmegreen 1998) and progressive star formation (e.g Walborn et al. 2002; Carlson et al. 2007; Bik et al. 2010; Martins et al. 2010). Because a large fraction of YSCs in blue compact galaxies are younger than 10 Myr, these two example can be considered as a framework for our analysis (see Chapter 5)
13
3
Young star clusters: statistical,
physical, and dynamical properties
3.1
Introduction
In this chapter, we summarize some of the main properties of the extragalactic (mainly unresolved) star clusters. Because a fraction of them are long-lived, they can be used as tracers of the star formation history of their hosts. More-over, star clusters are quite bright objects, easily observed at great distances, thus making it possible to study them even in galaxies outside the Local Group (e.g. Holtzman et al. 1992). Galaxy encounters and starburst episodes enhance the formation of young star clusters (e.g. Whitmore & Schweizer 1995, Holtz-man et al. 1996; Alonso-Herrero et al. 2000; de Grijs et al. 2003a; Paper I). However, young star clusters are observed also in quiescent spiral galaxies, where the star formation rate (SFR) is lower and constant (e.g. Barth et al. 1995; Carlson et al. 1998; Larsen 2002; Bastian et al. 2005; Mora et al. 2009). Massive star clusters form, during sporadic episodes, even in dwarf galaxies (NGC1569, Arp & Sandage 1985; NGC1705, Melnick et al. 1985a; He2-10, Conti & Vacca 1994; SBS 0335-052E, Thuan et al. 1997; ESO338 IG-04, Östlin et al. 1998; Billett et al. 2002). Unlike the MW, where massive YSCs are rare (or possibly not detected yet, see Portegies Zwart et al. 2010, for a list of all the known YSCs in the MW), extragalactic YSCs seems to be rather massive (M∼ 104− 106M⊙) and compact (Re f f ∼ 3 pc) (see Whitmore 2003; Larsen 2010, for reviews), suggesting that they are likely the progenitors of the more evolved GCs.
3.2
The study of unresolved star clusters
Studies of unresolved YSCs are based on the analysis of their integrated prop-erties. In a simplified picture, a cluster can be thought of as formed from a gas cloud, which eventually collapses and gives birth to thousand of gravitation-ally bound stars. The stars in the cluster can then be treated as a single stellar population (SSP), which evolves in time. The light we receive from the clus-ter is the integrated contribution from every star in the clusclus-ter. By comparing spectral evolutionary synthesis models to the integrated photometric proper-ties of the cluster, i.e. the spectral energy distribution (SED), it is possible to determine age, mass, and extinction of the YSCs. Below, we discuss two of
the main assumptions made in these models in detail and assess the validity of these assumptions in the modelling.
3.2.1 Clusters form in an instantaneous burst
The first assumption made is that all stars in the cluster form in one instan-taneous burst, or in other words, that the stellar population is coeval. This assumption is quite debatable because it seems to be contradicted by some observational evidence. In the previous chapter, we discussed that the star for-mation is usually not instantaneous in star-forming regions, and propagates in a hierarchical fashion toward the outskirts where the gas removal has not been very efficient. However, the densities and the star formation efficiency in these most external regions are quite low, so after 10-20 Myr, they will be dispersed. Only the core region, which is gravitationally bound, will survive after the gas expulsion. The cores of the star-forming regions appear to be coeval so there is a fairly good chance that, after all, this assumption is not totally wrong (the spread is smaller than 3 Myr, see Massey & Hunter 1998), for studies of clusters which have survived the gas expulsion phase.
It is well known that some very massive CGs (M∼ 106M⊙) of the MW and
of the LMC show multiple stellar populations of different metallicity and age. The age spread between the populations of the same cluster vary from 200 Myr to 1 Gyr (Milone et al. 2008, 2009; Piotto 2008, for a review). It is still under debate what causes such age/metallicity spread. Several theories have been proposed: (i) the merging of two star clusters with large age differences (Mackey et al. 2008); (ii) the formation of a second generation of stars from the ejecta of first generation asymptotic giant branch (AGB) stars (D’Ercole et al. 2008); (iii) star cluster – GMC encounters, from which the existing star cluster accrete the newly formed stars (Bekki & Mackey 2009); (iv) inclina-tion and fast rotainclina-tion of the star members (Bastian & de Mink 2009); (V) globular cluster formation in mini-dark matter halos, which would favoured the trapping of the AGB stars ejecta in the central region and the formation of a second stellar population (Bekki 2006). None of these scenarios has been observationally probed, and all the models show caveats. We notice that some of the MW GCs are very massive (M∼ 106M⊙). If we consider that a GC has
suffered dynamical and stellar evolution mass-loss then its initial stellar mass has obviously been much larger. Such massive YSCs (> 5×10⁶M
⊙) have been
detected (mainly in starburst galaxies) but are rather rare. Moreover, there are evidence supporting that some of these massive galactic GC-like systems are instead the remnants of some dwarf ellipticals accreted by the MW. For the lower mass GCs in the LMC, Milone et al. (2009) refer to a broadening of the MS in the color-magnitude diagram of these objects, which Bastian & de Mink (2009) could explain if stellar rotation and inclination are included as parameters of the synthetic models. In the latter case, the presence of a second stellar population is ruled out. However in a very recent publication, Girardi
3.2 The study of unresolved star clusters 15
Figure 3.1: A simplified sketch of the IMF, in its general shape, i.e., power-law at
masses larger then 1 M⊙(log m= 0) and log-normal at lower.
et al. (2011) show that only stellar rotation is not enough to explain the broad-ening of the MS and a second younger stellar population is needed. To date, no cases of multiple stellar populations have been found in YSC observations. Therefore, even if uncertain, the SSP assumption is still retained.
3.2.2 Assumption on the initial mass function
To model the SED of a cluster it is necessary to make some assumption on the stellar population content and consider its evolution with time related to the lifetime of the stars.
Since the pioneering study conducted by Salpeter (1955), it appeared evi-dent that the distribution of the stellar masses followed a clear path. A power-law function with a slope of ∼ −1.35 described quite well the numerical
incre-ment of the stars towards lower masses. This function is referred to as initial mass function (IMF). Since then, much effort has gone into verifying whether this slope would change as function of the environment (field stars, associa-tions, YSCs, GCs, galactic scales, metallicities, redshift) and of the mass range (many reviews have been written on the subject, see Bastian et al. 2010a, for the most recent). Nowadays, there is a quite good agreement that for stellar masses larger than 1 M⊙the IMF in star clusters and agglomerates is described
by a single power-law function with a Salpeter-like slope, i.e., dN∝mγd log m, withγ∼ −1.3. At lower mass range, however, there is no agreement yet.
Ob-servations agree that the slope of the IMF becomes less steep at lower masses and follows a so-called log-normal shape, i.e., ∼ exp−(log m−log mc)22σ2 , where mcis the characteristic mass andσ the variance of the distribution (see Figure 3.1). There is however still disagreement on the stellar mass at which the slope change (e.g. Miller & Scalo 1979; Kroupa 2001; Chabrier 2003; Da Rio et al. 2009; Bastian et al. 2010a).
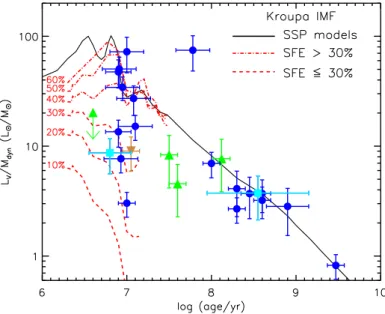
Figure 3.2: An example of the diagnostic age versus LV/M ratio by Goodwin &
Bas-tian (2006). In different coloured symbols and error bars several sample of YSCs, for which dynamical mass estimates are available (see Goodwin & Bastian 2006, and ref-erences herein). The assumed SSP model is based on a Kroupa IMF (see text), while the red (dotted and dashed) lines represent the effect on the SSP model of different star formation efficiency, assuming instantaneously gas expulsion at 2 Myr. All the clusters which are close or below the black line have normal IMF. Different star for-mation efficiency predict which of them will survive to the gas expulsion phase. There is only one cluster which sits above the model. This is the M82-F cluster, known for displaying evidence of a top-heavy IMF (Smith & Gallagher 2001).
In this thesis, the study of YSC properties has been done assuming a univer-sal Kroupa IMF (Kroupa 2001). The univeruniver-sal Kroupa IMF is defined to be a multiple power-law relation (the slopes at low mass range becomes flat and not too far from a log-normal shape), i.e. forξ(m)∝m−α,α= 2.3 at m ≥ 0.5M⊙,
α = 1.3 at 0.08 ≤ m ≤ 0.5M⊙, and α = 0.3 at 0.01 ≤ m ≤ 0.08M⊙. This
IMF is often used in studies of YSCs and has been tested in several occasions where direct dynamical estimates of the cluster masses have been derived (e.g. Larsen et al. 2004; Bastian et al. 2006; Goodwin & Bastian 2006; de Grijs & Parmentier 2007).
The luminosity-to-mass LV/M ratio correlates the mass of the cluster (re-lated to the assumed IMF as well) to its luminosity in the visual band. SSP models are used to compute the LV/M ratio, assuming an IMF. The observed LV of a clusters is thus used to calculate its mass, once the age of the system in known. If the mass of the cluster is derived in an independent way (from spectroscopic analysis), it is possible to test the predicted LV/M ratio, which depends on the assumption made on the IMF. The diagram in Figure 3.2 shows
3.3 The cluster luminosity and mass function 17
how the predicted LV/M for a Kroupa IMF changes as function of the clus-ter age (plot from Goodwin & Bastian 2006). Clusclus-ters, which are located in the proximity of the solid black line, have a mass function which agrees quite well with the predictions made from a Kroupa IMF. Systems, which sit be-low the predicted relations, are found only at ages of ∼ 10 Myr, these objects have experienced lower star formation efficiencies and are dynamically un-stable. They appear to be unbound after the gas expulsion phase (see Chapter 1). Only one cluster does not follow the expected trend, that is M82-F, in the starburst galaxy M82. This cluster shows evidence of having a top-heavy IMF (deficient in low mass stars, see Smith & Gallagher 2001). Studies of the IMF in M82-F have been inconclusive (Bastian et al. 2007; de Grijs & Parmentier 2007, for a detailed review of the case), putting a warning on possible IMF variations in extreme starburst conditions. However, many other studies of IMF variations in very massive star clusters have been unsuccessful (Bastian et al. 2006; Greissl et al. 2010).
The IMF has a statistical meaning, therefore, uneven IMF sampling (stochasticity) in clusters less massive than 105M⊙ are expected to cause
important variation in observed integrated fluxes at longer wavelengths (λ ≥ 0.8µm). Studies of the evolution of stellar isochrones (Maíz Apellániz 2009, among many others) have shown that red supergiants (RSGs) dominate the star cluster light at red and near-IR wavelengths as early as 7 Myr. Traditionally, SSP models are constructed by integrating the contribution to the cluster’s light from all the stars populating a well sampled IMF, normalized with respect to the mass of the cluster. This method is, however, valid only if the stellar population has a total mass of at least 105M
⊙,
otherwise uneven sampling introduces important changes in the colors of the clusters. In fact, the IMF describes a probability distribution of the mass at which stars form. This means that, in nature, the IMF sampling is a purely stochastic event. For clusters with masses not large enough to fully sample the IMF, the colours of the clusters are dominated by fluctuations around the expected values (see Cerviño & Luridiana 2004; Fouesneau & Lançon 2010). At cluster ages between 6−60 Myr, RSGs dominate the light at red and near-IR wavelengths. If the observed cluster happens to have a larger number of RSGs than predicted by the model, this would be seen as an excess in the observed flux atλ > 8000 Å.
3.3
The cluster luminosity and mass function
3.3.1 The young star clusters
From studies of YSCs, it has been observed that the distribution of the cluster mass can be approximated with a power-law function of the type dN(M)/dM = CMβ, whereβ ≈ −2 (e.g. Zhang & Fall 1999; Bik et al. 2003;
Hunter et al. 2003; de Grijs et al. 2003a). In many studies, however, the mass determinations are model-dependent or limited by the available data and the CMFs are determined over different mass ranges. An indirect method to test the the cluster mass function (CMF) is to look at their luminosity distributions, i.e. the cluster luminosity function (CLF). Assuming that the CLF is built up of fully sampled CMFs formed at different ages, the resulting CLF is supposed to have the same power-law shape.
In reality the observed CLFs have a large spread of power law indices rang-ing from −2.4 ≤βL≤ −1.7 (e.g. Larsen 2002; Hunter et al. 2003; de Grijs et al. 2003a; Mora et al. 2009; Whitmore et al. 2010, for a revisited CLF and CMF in the Antennea system). Interestingly, some galaxies have a dou-ble power law CLF, steeper than −2.0 at the bright end, and approximately −2.0 at the faint end. The bend occurs between −8.0 and −10.0 mag (Larsen
2002; Gieles et al. 2006b,a). The steepening of the CLF (both for single power laws and for the bright-end of the double ones) could be explained by a trun-cation at high mass in the CMF (Larsen 2002), or in other words, a limit on the maximum mass with which a cluster can be formed. Gieles et al. (2006a) showed that galaxies with a double power law CLF impose physical limits on the maximum cluster mass. A steepening of the CLF as function of the wavelength is expected if there is a truncation in the CMF, since evolved stel-lar populations are brighter at red wavelengths. Recently, Larsen (2009) sug-gested that instead of a sharp truncation in the CMF, a Schechter function with a characteristic mass, Mc≈ 2 × 10⁵M⊙, and an index of −2.0 at the low-mass
end is a better representation of the CMF in quiescent spiral galaxies. Shear and/or regular patterns (like spiral arms) effectively limit the mass of GMCs from which clusters form. In presence of merging events which enhance the compression and the star formation efficiency, the Mchas likely higher values. A Schechter-like CMF could explain the steepening of the CLF at the bright ends, why galaxies are able to form very massive clusters, and why the most massive young clusters scale with the global star formation efficiency of the systems (Bastian 2008).
3.3.2 The globular clusters
Although GCs are believed to be the evolved counterpart of the YSCs, they show a different shape of the luminosity (mass) function, which we refer to as GCLF (GCMF). The GCLF (GCMF) has a log-normal shape with a rather constant turnover magnitude of MV = −7.4 (corresponding to a characteris-tic mass of Mc∼ 2 × 10⁵M⊙, see bottom panels of Figure 3.3) (see de Grijs
& Parmentier 2007, for a review on the topic). It has been observed that this turnover does not vary significantly in several nearby galaxies, suggesting that the same mechanism has shaped the GCLF in different galaxy environments (Jordán et al. 2007; de Grijs & Parmentier 2007). If one looks at the the spec-tral mass (luminosity) function of GCs (i.e., dN(M)/dM = CMη, see upper
3.4 How are young star clusters destroyed? 19
Figure 3.3: The GCMF of the M87 and the MW by McLaughlin (2003). The usual
log-log distribution with a log-normal shape is clearly observable in the two lower panels, respectively. Even if the distributions are not coincident in the bright and low mass wings, the mass peak of the turnover is the same. The mass spectrum distribution
is showed in the top panels. The Mc is the breaking-point between the two
distribu-tions.
panels of Figure 3.3) the distribution can be fitted by two power-laws with a slope of ∼ −2.0 at the massive (luminous) bins, a break corresponding to the
Mc, and a flattening (η∼ −0.2 which variates from system to system) at lower masses. Jordán et al. (2007) show that the GC spectral mass distributions of many galaxies can be better fitted with a Schechter function and a scaling characteristic mass of M⋆> a few 106M
⊙. Several possible scenarios are
ad-dressed by theoretical studies to explain the origin of the GCLF (GCMF), a primordial origin, i.e. the GCLF has been established at the time the GCs formed; as due to preferential disruption of the low mass systems (de Grijs & Parmentier 2007).
3.4
How are young star clusters destroyed?
There is a large disagreement related to the formation and evolution of the GCs and their similarity with YSCs. Cosmological simulations seems to sug-gest that the primordial GCs have formed in dark matter halos, which have subsequently been stripped (e.g. Kravtsov & Gnedin 2005; Mashchenko & Sills 2005). If this is the case, there is no connection between the YSCs form-ing at the present time and the ancient GCs.
The question whether the present-day star clusters will survive and become GCs or GC properties have been shaped at the moment of their formation and primordial evolution under different environmental conditions is by no means
answered. A positive or negative answer to this question will give important clues to the star formation process as it was in the young and unevolved uni-verse, and how we can constrain this from the local examples. The GCLF (and MF) clearly shows that the lower mass objects have been preferentially destroyed. On the other hand, YSCs show a CLF slope which is tentatively close at the bright-end luminosity bins to the GCLF. Many efforts have been made to find traces of evolution in the CLF which could represent the con-necting thread between the two samples.
In this thesis we will not discuss further possible evolutional relations be-tween the GCs and the YSCs. We will focus, instead, on the evolution and possible disruption of a YSC after it has been formed.
As already discussed in the previous chapter, a large fraction of newly born YSCs are destroyed during the gas expulsion phase. This phase of infant mor-tality is mass independent, i.e. clusters of any mass can be destroyed. After this phase, which can last 10-20 Myr, the evolution of the YSCs is highly debated (see Lamers 2009, for a short summary). Analysing the same cluster popula-tions in several galaxies, two different scenarios have been proposed, which are referred to as mass independent and mass dependent disruption (MID and MDD, respectively).
The MID scenario (e.g. Fall et al. 2005; Chandar et al. 2006; Whitmore et al. 2007; Chandar et al. 2010a,b) proposes that about 90 % of star clusters dissolve for each dex of age, up to 1 Gyr. This phase is independent of the cluster mass, as the gas expulsion and supernova feedback have unbounded many of the clusters, which gradually dissolve. If this is true, the YSCs are not a reliable tracer of the properties of the host galaxy. Therefore, the formation and disruption (evolution) of a YSC is considered a local event and cannot be used to constrain the environmental properties of the host. After 1 Gyr, this disruption mechanism is over and the remaining clusters will be destroyed due to long-term interactions, e.g. two-body relaxation. In this final phase the lower-mass clusters will dissolve first.
On the other hand, the MDD scenario (e.g. Boutloukos & Lamers 2003; Gieles et al. 2005; Lamers et al. 2005a,b; Lamers & Gieles 2006; Gieles et al. 2007; Gieles & Bastian 2008; Bastian et al. 2009b) suggests that the clus-ters, which have survived the gas expulsion, enter into a more quite phase, where the stellar fading and internal dynamical interactions are the only mech-anisms at work (between 10 and 100 Myr). Gradually, the environment and internal interactions (two-body) act on the clusters and will, after a certain lapse of time (∼1 Gyr), dissolve them. The disruption time scale is posi-tively correlated with the mass of clusters (larger masses have higher chance to survive) and depend of the galactic environments, like galactic tidal field, shocks by spiral arms and encounter with GMCs. Since the disruption is mass-dependent, more massive clusters, after the gas expulsion phase, have rather high chance of surviving and can be used to trace the star formation history of the host. An enhancement of the the SFR in the host will be observed in
3.5 Relations between the host and its star clusters 21
the cluster age distribution as a increasing of number of objects at the corre-sponding burst age. Moreover, since the cluster and the host interact, a shorter or longer cluster disruption time-scale will give information about the forces operating in the environment.
Both scenarios are claimed to be supported by observational evidence and the convergence to a unified theory appears rather distant. Many uncertain-ties still affect the analyses, e.g., detection limits, incompleteness, crowding, spectral evolutionary models, etc. We have presented, here, a simplified and summarised view of the two scenarios. None of them can yet prove whether or not the YSCs observed today are precursors of the GCs or disprove a pri-mordial (possible with dark matter?) origin of the latter systems in a medium and under conditions not observed anymore in the local universe.
3.5
Relations between the host and its star clusters
The formation of a cluster appears to be correlated with the properties of the host galaxy. It is usually observed that galaxy mergers produce more numer-ous and more massive clusters than quiescent spirals (Larsen 2009). Sampling statistics, (i.e., galaxies with a more numerous cluster population have higher chances to sample the CMF to higher masses) is a possible explanation for this trend (Larsen 2002). However, the host environment likely plays its role in constraining the mass of the forming clusters (Gieles et al. 2006a). Using numerical simulations of different host environments, Weidner et al. (2010) show that the shear in rotationally supported galaxies (i.e., spirals) acts on the collapse of the giant GMCs, causing them to fragment and favouring the for-mation of the less clustered OB associations and low-mass clusters. On the other hand, the lack of rotation in dwarf galaxies and high external pressures in merging systems favour the collapse of a single, massive and gravitationally bound cluster. Numerical simulations show that possibly GCs have formed in strongly shocked media and high pressure fields, which have enhanced the gas compression and favoured the formation of more tightly bound structures (Elmegreen & Efremov 1997, Bournaud et al. 2008). Such conditions are usu-ally reached in galaxy mergers, where the very massive young star clusters are observed (Antennae system, Mengel et al. 2005; Arp 220, Wilson et al. 2006; the Bird galaxy, Paper I)
Observed empirical relations between the properties of the young star clus-ters and the SFR in the host support this scenario. Larsen & Richtler (2000) firstly introduced the specific luminosity for young star clusters defined as TL = 100Lclusters/Lhost. TL gives an estimate of which fraction of the total galaxy light is produced by stars in clustered regions. Moreover, this parame-ter does not depend from the distance of the system, nor the mean inparame-terstellar absorption (if the clusters and the host have the same averaged reddening). Using a sample of galaxies including quiescent spirals, star-forming irregular,
starbursts and dwarf systems, they found that the specific luminosity in the U band, TL(U) and the SFR of the hosts were positively correlated, i.e., at higher SFRs correspond a more numerous cluster population.
In a following work, Larsen (2002) found evidence of a positive correla-tion between the visual luminosity of the brightest star cluster (MVbrightest) and the density of the SFR in the host. The relation between the two quantities can be understood if a higher SFR enables the formation of more massive clusters. By means of numerical modelling, Weidner et al. (2004) investigated the physical conditions necessary to reproduce the relation, assuming that the brightest cluster would be also the most massive. They were able to reproduce the observed relation assuming that a cluster population is formed within a time scale of ∼ 10 Myr, following a CMF with a Salpeter power-law shape (index ∼ 2.35).
Bastian (2008) enlarged the sample of Larsen (2002), including resolved close-by star-forming regions and luminous and ultra-luminous IR galaxies (LIRGs and ULIRGs). Releasing the condition of the brightest cluster being also the most massive, he observed that the relation showed less scatter if the brightest youngest (< 10 Myr) clusters were used instead. The MVbrightest-SFR relation holds for several orders of SFR values, suggesting that the youngest brightest cluster is a fairly good indicator of the present SFR in the galaxy. Monte Carlo simulations of cluster populations with a CMF of power-law
−2.0 or a Schechter CMF with power-law −2.0 and a characteristic mass of
a few times 105M⊙where used to test different scenarios of cluster formation
efficiency. Using this relation, Bastian (2008) ruled out a scenario where 100 % of the stars form in clusters with a CMF power-law of index −2.0. The
Larsen et al. relation appeared to be in better agreement if clusters form with a Schechter CMF and only ∼ 8 − 10 % of the stars reside in bound cluster (cluster formation efficiency,Γ∼ 0.1).
Finally, in a recent work by Goddard et al. (2010), it has been observed that the fraction of stars formed in bound star clusters,Γ, is higher for higher SFR densities in the host. These observed relations clearly outline a scenario where the cluster formation is intimately correlated with the star formation process, or in other words, that the birth of a cluster is a product of an universal star formation process which operates on many scales of intensity.
23
4
Blue compact galaxies
4.1
Introduction
In this chapter, we present the main properties of the blue compact galaxies (hereafter BCGs). Observations of this class of galaxies were first reported by Haro (1956), but the term name of blue compact objects came later (Zwicky 1963). They were described as stellar-like objects with emission line domi-nated spectra. Several surveys conducted between the 60s and the 80s, e.g. the Palomar Sky Survey (by Fritz Zwicky and collaborators; the first publication appeared as Zwicky et al. 1961); the First and Second Byurakan Survey (the first publication appeared in 1967 by Markarian, B. E.; the last was published by Markarian et al. 1986); and the ESO/Uppsala Survey of the southern sky (Lauberts et al. 1981, and references therein) detected an increasing number of these blue systems which caught the interest of the astronomers for the pro-duced intensity of the spectral emission lines. Sargent & Searle (1970) and Searle & Sargent (1972) advanced the hypothesis that BCGs were forming their first generation of stars, due to the low metallicity content detected. The possible similarity between BCGs and high-redshift (high-z) systems have made these local bursting galaxies an always timely topic.
In the first section of this chapter, we will describe the main physical and dynamical properties of the BCGs. We will discuss different triggering mecha-nism for the ongoing starburst in these galaxies and their properties at different wavelengths. In the final section we discuss some similarities between BCGs and high-z galaxies.
4.2
Properties of the blue compacts
BCGs are local systems, characterised by irregular morphologies and rather high specific star formation rates (SFRs, e.g. Östlin et al. 2001; Gil de Paz et al. 2003; López-Sánchez 2010). They are also referred to as HII galaxies because of their prominent emission line spectra, similar to the HII regions observed in spiral arms (Melnick et al. 1985b). They span a range of metal-licities from 1/3 to ∼1/50 of the solar metallicity. They have probably experi-enced a non-uniform star formation history in the form of episodic starbursts. In ground-based surveys, BCGs appear compact and show high central sur-face brightness due to the high star formation confined in the central part of the galaxies. The host systems, however, are fainter and quite extended, thus
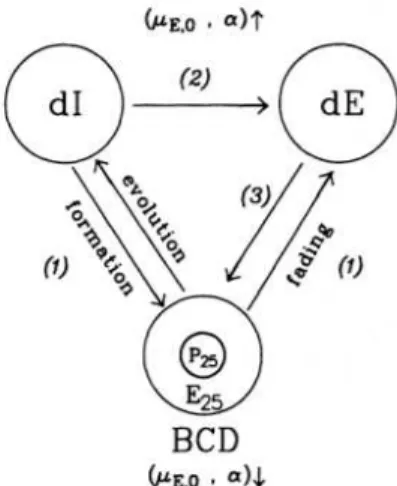
Figure 4.1: A schematic view of the different evolutionary scenarios between dIs,
BCGs, and dEs from Papaderos et al. (1996a). Scenario (1) predicts that dIs evolve into BCGs when they experience a burst event. The two phases, bursting (BCG) and quiescent (dI), can happen several times until all the gas has been consumed and the system evolves into a dE (Thuan 1985; Davies & Phillipps 1988). Scenario (2) sug-gests that ram pressure stripping has removed the gas and transformed dIs into dEs (Lin & Faber 1983). Scenario (3) proposes that BCGs form from the accretion of metal-poor gas by dEs (Silk et al. 1987). The surface brightness of the host galaxy is higher in BCGs than in dIs and dEs.
detectable only with surface photometry reaching faint isophotal levels, where the starburst knots cannot outshine the underlying galaxy light (e.g. Papaderos et al. 1996b; Gil de Paz et al. 2003). It is in these extended and low luminos-ity regions that a considerable fraction of the stellar mass contained in BCGs reside (Marlowe et al. 1999).
Kunth & Östlin (2000) reported a wide range of B band luminosities for BCGs, −12.0 ≤MB≤ −21.0 mag. However, systems fainter than −17.0 mag are usually called blue compact dwarfs (BCDs).
According to the compilation made by Kunth & Östlin (2000), BCGs, dwarf irregulars (dIs), dwarf ellipticals (dEs) and low surface brightness galaxies (LSBGs) are all metal-poor systems. However, they are referred to as different classes of objects. The dEs clearly differ from the other dwarf systems because of the dearth of gas and the absence of any current star formation activity. In some cases, BCGs, dIs, and LSBGs show similar properties (e.g. rich in gas, star forming, in the case of dIs and BCGs they have irregular morphologies) and any clear class separation is impossible. Since the starburst phase in BCGs is a transient phenomenon, several evolutionary scenarios have proposed to link these different classes of galaxies in a unified picture (see Figure 4.1 for a schematic view). If BCGs are experiencing a burst event, then dIs are the likely quiescent counterparts (Thuan 1985; Davies & Phillipps 1988). A few transition between the dI and the BCG phase can occur before the system
4.3 The starburst trigger 25
has consumed/lost all the gas and becomes a dE. Lin & Faber (1983) suggest a scenario where dIs evolve into dEs because of the ram pressure stripping which removes the gas. Finally, since BCGs show a low surface brightness host, it has been proposed that the burst event could be caused by an infall of metal-poor gas into a dE (Silk et al. 1987). Observationally, however, these evolutionary scenarios are not supported by clear differences in surface bright-ness profiles among dIs, dEs, and BCGs (higher in the latter, e.g. Papaderos et al. 1996a). Papaderos et al. (1996a) suggest that the underlaying evolved stellar population produces different surface brightness distributions, because it is affected by the changes in the global gravitational potential caused by the transition from one phase to the next. However, Marlowe et al. (1999) estimate that to produce an expansion or contraction of the stellar population, at least 50 % of mass loss or accretion it is required, a fraction too high for the typical gas and dark matter content of the dIs.
4.3
The starburst trigger
Since the luminous BCGs are undergoing a considerable star formation episode, their properties can be used to constrain how massive star formation proceeds in environments where the interstellar medium is chemically less evolved. In the 70s, when these starbursting galaxies were first observed and studied, it was suggested that they were producing their first generation of stars (Sargent & Searle 1970; Searle & Sargent 1972). However, the photometric colours of the BCG outskirts reveal the presence of a faint evolved stellar population (e.g. Bergvall & Östlin 2002; Gil de Paz et al. 2003; Micheva et al. 2010), suggesting that these systems have experienced, already in the past, intense starburst episodes interleaved by quiescent periods (e.g. McQuinn et al. 2010, and references therein).
Many BCGs, mostly the luminous (massive) systems, show clear evidence of recent mergers or interactions with a close companion (Davies et al. 1998; Östlin et al. 2001; Hunter & Elmegreen 2004). The merger event, involving at least a gas-rich progenitor (LSBGs or HI-cloud), seams to be the starburst trigger in several cases. Studies of the Hα velocity fields in 6 luminous BCGs (MV < −18.0 mag) have shown systems dynamically unrelaxed, with multiple components, in some cases counter-rotating (Östlin et al. 2001). Not only the gas, but also the stellar component seems to be dynamically perturbed in these galaxies. Long-slit and integral field (IFU) spectroscopy show chaotic velocity fields and in some cases decoupled gas and stellar kinematics (Östlin et al. 2004; Marquart et al. 2007; Cumming et al. 2008).
HIsurveys of BCGs reported many positive cases of the detection of neutral hydrogen around these active star-forming systems (e.g. Taylor et al. 1994; van Zee et al. 1998; Pustilnik et al. 2001; Salzer et al. 2002). Many BCGs are rich in HI gas or show HI companions, suggesting a triggering relation
between the burst event and the presence of the gas. However, this is not the most efficient channel to trigger the starburst, as shown by the gas-rich dIs where star formation episodes are rather sporadic, or where the gas density is below the critical value necessary to trigger star formation (van der Hulst et al. 1993; van Zee et al. 1997; Hunter & Elmegreen 2004). van Zee et al. (1998) observed higher central HI densities in BCGs then in other dwarf systems, suggesting that other mechanisms act to efficiently compress the gas in these systems.
That the galactic environment in BCGs and in dwarf galaxies favours (or do not prevent) the collapse of the gas was suggested by the very massive young star clusters detected in these systems (O’Connell et al. 1994; Conti & Vacca 1994; Meurer et al. 1995; Thuan et al. 1997; Billett et al. 2002). In particular, at the resolution achieved with HST, it was possible to resolve the central starburst regions and knots of the BCGs in numerous young star clusters (Ho & Filippenko 1996; Östlin et al. 1998; Hunter et al. 2000; Östlin 2000). These massive starburst clusters were believed to be the predecessors of the evolved globular clusters. Interactions and/or merging events, involving at least a gas-rich progenitor, provide physical conditions which are favourable for the formation of star clusters. Star clusters are easily detected in starburst galaxies and merging systems, like M82 (de Grijs et al. 2001), NGC 3310 (de Grijs et al. 2003a,b), the Antennae (Whitmore & Schweizer 1995), the Stephan’s Quintet (Gallagher et al. 2001), luminous IR galaxies like the Bird (Paper I), and collisional rings (Pellerin et al. 2010).
The numerous young and massive star clusters, the perturbed host mor-phologies, and the chaotic gas and stellar kinematics suggest that at least the luminous BCGs have recently undergone a merger or interaction event, which has likely refurbished the galaxy with metal-poor (roughly between 10-20 % of the solar metallicity) gas and triggered a vigorous starburst episode. This scenario is also supported by recent numerical simulations of two gas-rich dwarfs performed by Bekki (2008). The resulting merger system shows a star-burst dominated central region surrounded by a diffuse old stellar population halo.
4.4
Multiwavelength observations
BCGs have been studied in a wide range of wavelengths. We list the most important properties as a function of the considered waveband.
4.4.1 The ultraviolet range: The Lyα studies
It is known that short-lived, massive stars produce a copious amount of ion-ising photons (at wavelengthsλ < 912 Å), which are easily reprocessed by
4.4 Multiwavelength observations 27
of the interstellar medium (ISM). The Lyα emission line, observable at the rest frameλ = 1216 Å, is a resonant line, i.e., photons are easily absorbed
and re-emitted with the same energy,10.2 eV. This energy corresponds to the energy level between the ground state and the first excited state of neutral hy-drogen. Because more than 90% of the ISM consists of hydrogen, the Lyα is expected to be the strongest recombination line in HII nebulae. For this rea-son, in the late 60s, Partridge & Peebles (1967) proposed the use of the Lyα emission line to detect the high redshift primordial galaxies, considered to be metal and dust free. At higher redshift, the Lyαemission frame moves into the optical wavebands making it theoretically possible to observe galaxies at z∼ 2 to 6, using ground-based facilities. However, the first attempts of detecting Lyα emitters at high-z failed (Pritchet & Hartwick 1987, 1990), puzzling the scientific community by the negative results. Charlot & Fall (1993), by mean of modelling, suggested an anti-correlation between the metallicity (related to the dust production) and the Lyα emission. In this context, the metal-poor BCGs were considered as a testbed for the solution of the puzzle. The ad-vent of ultraviolet (UV) detectors in space-based facilities made it possible to observe the most metal poor BCGs known (IZw18 and SBS 0335-052E) in the far-UV (FUV) range. The spectra of the two BCGs showed clear signs of damped Lyα absorption (Kunth et al. 1994; Thuan & Izotov 1997). However, in other BCGs with slightly higher metallicities there was a positive detection of Lyα in emission (e.g. Lequeux et al. 1995; Thuan & Izotov 1997; Kunth et al. 1998). It was clear that a positive emission of the Lyman line was not re-lated to the metallicity of the ISM in the starburst system, but to its dynamical status (e.g. a static HII medium traps the Lyman photons, while on the other hand, outflows facilitate the escape, see Kunth et al. 1998; Tenorio-Tagle et al. 1999; Mas-Hesse et al. 2003). The positive correlation between the kinematic status of the ISM and the Lyα escape was also confirmed by the theoretical studies of this line profile (see Verhamme et al. 2006). Using high-resolution HSTFUV, UV, and optical imaging data of BCGs and starburst systems it has been possible to map the Lyαin different regions of the same galaxy, showing the complexity of the escape and the absorption mechanism (Hayes et al. 2005, 2007; Östlin et al. 2009). Nowadays large surveys of Lyman alpha emitters at high-redshift have been successful (Hu et al. 1998; Malhotra & Rhoads 2002; Venemans et al. 2004; Gronwall et al. 2007; Ouchi et al. 2008; Hayes et al. 2010; Adams et al. 2011, among many others), however, the nearby studies pioneered by the BCGs put important constraints on the biases which affect such high-z studies.
4.4.2 Optical imaging and spectroscopy
Optical imaging and spectroscopy studies of the BCGs have put important constraints on the physical, kinematical, and dynamical properties of this class of galaxies. Many of the most important results have already been discussed
or mentioned in the previous sections of this chapter. We summary here some of the most important aspects.
BCGs were first observed on photographic plates as faint, stellar-like sys-tems, however, their spectra where dominated by emission lines typical of HII regions (Zwicky 1963; Markarian 1967a). The bright spectral emission lines were suitable for chemical abundance analyses, which allowed measurements of the very low metallicities in these systems (see for a review Kunth & Östlin 2000). Another important discovery made by means of spectroscopy was the detection of the Wolf-Rayet (WR) emission features which classified many of the BCGs as WR galaxies (see Guseva et al. 2000 and references therein). Typically, WR signatures in the spectrum of a low metallicity galaxy is a rare phenomenon because the duration of the WR phase is shorter and weaker when the metallicity decreases. The presence of WR features was considered a youth indicator for the ongoing burst in the BCGs. The advent of CCD de-tectors allowed a better spatial resolution of the BCGs. Surface brightness profile studies of BCGs revealed two main components in the systems: a cen-tral metal-poor, almost dust free and blue starburst region and redder colors for the host system, indicating an evolved stellar population (Bergvall 1985; Loose & Thuan 1986, among the first photometric analyses done on CCD achieved data). However, because most of the luminous BCGs are located at rather far distances (> 30 Mpc). It was only with the resolution of the HST
cameras that the central bright starburst regions could be resolved in numerous super massive star clusters (Ho & Filippenko 1996; Thuan et al. 1997; Östlin et al. 1998). Deeper HST data have allowed the detection of not only young star clusters but also more evolved globular clusters, confirming the general picture of BCGs as evolved systems undergoing a recent burst episode, likely triggered by a merging with a gas-rich system (Östlin et al. 2003, Paper II, IV, and V). The star cluster analysis in BCGs is the main topic of this the-sis. Therefore, we invite the reader to see Chapter 5 for more details on this subject.
4.4.3 The IR: the dust, the nebular emission and the dearth of PAH
Due to the UV-excess and low metallicities detected in many BCGs, it was expected that these galaxies would be almost dust-free. However, even the very metal-poor galaxy SBS 0335-052E contains approximately 105M⊙ of
dust (Thuan et al. 1997, 1999). Fits to the mid-infrared (MIR) spectra of this BCG suggested that ∼75 % of the star formation in the system is hidden by dust questioning the reliability of the cosmic star formation rate estimated at higher redshift using UV and/or optical fluxes.
Near IR (NIR) spectroscopy of local BCGs shows a complex environment (e.g. Vanzi & Rieke 1997; Vanzi et al. 2000, 2002; Izotov et al. 2009). The spectra are usually dominated by nebular emission and continuum, and a