A Dynamic Aspartate- to- Alanine
Aminotransferase Ratio Provides Valid
Predictions of Incident Severe Liver
Disease
Fredrik Åberg ,1,2 Christopher J. Danford,3 Maja Thiele,4,5 Mats Talbäck,6 Ditlev Nytoft Rasmussen,4 Z. Gordon Jiang ,3 Niklas Hammar,6 Patrik Nasr,7 Mattias Ekstedt,7 Anna But,8 Pauli Puukka,9 Aleksander Krag,4,5 Jouko Sundvall,10 Iris Erlund,10 Veikko Salomaa,11 Per Stål,12,13 Stergios Kechagias,7 Rolf Hultcrantz,14 Michelle Lai,3 Nezam Afdhal,3 Antti Jula,11 Satu Männistö,11 Annamari Lundqvist,11 Markus Perola,11 Martti Färkkilä,15 and Hannes Hagström 12,13,16
The aspartate- to- alanine aminotransferase ratio (AAR) is associated with liver fibrosis, but its predictive performance is suboptimal. We hypothesized that the association between AAR and liver disease depends on absolute transami-nase levels and developed and validated a model to predict liver- related outcomes in the general population. A Cox regression model based on age, AAR, and alanine aminotransferase (ALT) level (dynamic AAR [dAAR]) using re-stricted cubic splines was developed in Finnish population- based health- examination surveys (FINRISK, 2002- 2012; n = 18,067) with linked registry data for incident liver- related hospitalizations, hepatocellular carcinoma, or liver death. The model was externally validated for liver- related outcomes in a Swedish population cohort (Swedish Apolipoprotein Mortality Risk [AMORIS] subcohort; n = 126,941) and for predicting outcomes and/or prevalent fibrosis/cirrhosis in biopsied patients with nonalcoholic fatty liver disease (NAFLD), chronic hepatitis C, or alcohol- related liver disease (ALD). The dynamic AAR model predicted liver- related outcomes both overall (optimism- corrected C- statistic, 0.81) and in subgroup analyses of the FINRISK cohort and identified persons with >10% risk for liver- related outcomes within 10 years. In independent cohorts, the C- statistic for predicting liver- related outcomes up to a 10- year up was 0.72 in the AMORIS cohort, 0.81 in NAFLD, and 0.75 in ALD. Area- under- the- curve (AUC) for detecting prevalent cirrhosis was 0.80- 0.83 in NAFLD, 0.80 in hepatitis C, but only 0.71 in ALD. In ALD, model perfor-mance improved when using aspartate aminotransferase instead of ALT in the model (C- statistic, 0.84 for outcome; AUC, 0.82 for prevalent cirrhosis). Conclusion: A dAAR score provides prospective predictions for the risk of incident severe liver outcomes in the general population and helps detect advanced liver fibrosis/cirrhosis. The dAAR score could potentially be used for screening the unselected general population and as a trigger for further liver evaluations. (Hepatology Communications 2021;0:1-15).
L
iver disease represents a rapidly increasing health care burden. As a consequence, liver bio-chemistry testing is increasing, and liver testsare now the third most common type of biochemical test.(1) The transaminases, alanine aminotransferase
(ALT) and aspartate aminotransferase (AST), reflect Abbreviations: AAR, aspartate- to- alanine aminotransferase ratio; AIC, Akaike Information Criterion; ALD, alcohol- related liver disease; ALT, alanine aminotransferase; AMORIS, Apolipoprotein Mortality Risk; APRI, aspartate aminotransferase/platelet ratio index; AST, aspartate aminotransferase; AUC, area under the curve; CI, confidence interval; dAAR, dynamic aspartate- to- alanine aminotransferase ratio; FIB- 4, fibrosis- 4; HCV, hepatitis C virus; HR, hazard ratio; ICD, International Classification of Disease; IQR, interquartile range; NAFLD, nonalcoholic fatty liver disease.
Received November 9, 2020; accepted February 1, 2021.
Additional Supporting Information may be found at onlinelibrary.wiley.com/doi/10.1002/hep4.1700/suppinfo.
Supported by the Mary and Georg Ehrnrooth Foundation (to F.Å.), Medicinska Understödsföreningen Liv och Hälsa (to F.Å.), Finska Läkaresällskapet (to F.Å.), Finnish Foundation for Cardiovascular Research (to V.S.), National Institute of Diabetes, Digestive and Kidney Diseases (K08DK115883 to Z.G.J.), Innovation Fund Denmark (to the University of Southern Denmark), European Union’s Horizon 2020 GALAXY project (grant 668031 to the University of Southern Denmark), Novo Nordisk Foundation to the MicrobLiver Project (NNF15OC0016692 to the University of Southern Denmark), Region of Southern Denmark (postdoctoral stipend to M.T.), Stockholm County Council (K2017- 4579 to P.S.), and Center for Innovative Medicine (grant 20180889 to P.S.).
hepatocellular damage and are the most common liver tests used in clinical practice in attempts to identify and exclude liver injury in a wide variety of situations.
Although the magnitude of elevation in ALT and AST has traditionally been used to guide the need for further liver investigations, recent United Kingdom guidelines concluded that this strategy is not sup-ported by evidence.(2) Elevated transaminases are a
common finding affecting around 10% of the general population,(3,4) while only a minority of these persons will develop liver- related events.(4,5)
The stage of liver fibrosis on biopsy is currently considered the best prognosticator in chronic liver disease across different etiologies.(6) Transaminases do not correlate directly with liver fibrosis stage.(7) In fact, the majority of individuals with asymptomatic advanced liver fibrosis or cirrhosis have transaminases within current reference limits.(8) In contrast, the AST to ALT ratio (AAR or “the De Ritis ratio”(9)) seems to correlate with the severity of liver fibrosis,(10) even
when absolute transaminase values are within refer-ence limits.(11,12) AAR has been associated with liver
fibrosis stage in several cohort studies, including non-alcoholic fatty liver disease (NAFLD),(13,14) chronic hepatitis C (HCV) and B,(10,15,16) and alcohol- related liver disease (ALD).(17- 19) In addition, the AAR is
incorporated in many noninvasive fibrosis scores.(13,20)
On the other hand, the performance of the AAR in discriminating advanced fibrosis or cirrhosis is inconsistent between studies,(10,21) and discrimination
performance in NAFLD and ALD is at best subopti-mal.(17,22) Adding to the controversy, an AAR >1 was observed in 36%- 77% of apparently healthy adult vol-unteers lacking any signs of liver disease, which was dependent on weight and alcohol intake.(23) There is a
paucity of studies on the role of the AAR for predict-ing incident liver- related events.
We hypothesized that the predictive performance of the AAR for detecting prevalent advanced fibrosis or cirrhosis and incident liver- related events due to cirrhosis may be dependent on absolute transaminase levels. We tested this hypothesis by developing such a prediction model in a Finnish general population cohort with linked outcome data for incident clinical © 2021 The Authors. Hepatology Communications published by Wiley Periodicals LLC on behalf of American Association for the Study of Liver Diseases. This is an open access article under the terms of the Creative Commons Attribution- NonCommercial- NoDerivs License, which permits use and distribution in any medium, provided the original work is properly cited, the use is non- commercial and no modifications or adaptations are made.
View this article online at wileyonlinelibrary.com. DOI 10.1002/hep4.1700
Potential conflict of interest: Dr. Hammar owns stock in AstraZeneca and consults for Swedish Orphan Biovitrum. Dr. Afdhal advises Echosens. Dr. Ekstedt advises AMRA Medical AB. Dr. Salomaa consults for Novo Nordisk and Sanofi. Dr. Thiele is on the speakers’ bureau for Echosens. The other authors have nothing to report.
aRtiCle inFoRmation:
From the 1 Transplantation and Liver Surgery Clinic, Helsinki University Hospital, Helsinki University, Helsinki, Finland; 2 The
Transplant Institute, Sahlgrenska University Hospital, Gothenburg, Sweden; 3 Division of Gastroenterology and Hepatology, Beth
Israel Deaconess Medical Center, Boston, MA, USA; 4Department of Gastroenterology and Hepatology, Odense University
Hospital, Odense, Denmark; 5 Department for Clinical Research, University of Southern Denmark, Odense, Denmark; 6 Unit of
Epidemiology, Institute of Environmental Medicine, Karolinska Institutet, Stockholm, Sweden; 7 Department of Health, Medicine,
and Caring Sciences, Linköping University, Linköping, Sweden; 8 Biostatistics Consulting, Department of Public Health, University
of Helsinki and Helsinki University Hospital, Helsinki, Finland; 9 Clinicum, Helsinki University, Helsinki, Finland; 10 Department of
Government Services, Finnish Institute for Health and Welfare, Helsinki, Finland; 11 Finnish Institute for Health and Welfare, Helsinki,
Finland; 12 Unit of Hepatology, Division of Upper Gastrointestinal Diseases, Karolinska University Hospital, Stockholm, Sweden; 13 Department of Medicine, Huddinge, Karolinska Institutet, Stockholm, Sweden; 14 Department of Medicine, Solna, Karolinska
Institutet, Stockholm, Sweden; 15 Clinic of Gastroenterology, Helsinki University and Helsinki University Hospital, Helsinki, Finland; 16 Unit of Epidemiology, Department of Medicine Solna, Karolinska Institutet, Stockholm, Sweden.
aDDRess CoRResponDenCe anD RepRint ReQuests to:
Fredrik Åberg, M.D., Ph.D. HUCH Meilahti Hospital PB 372, 00029 HUS
Helsinki, Finland
E- mail: Fredrik.Aberg@helsinki.fi Tel.: +358 9 4711
liver disease. We then performed external validation for both incident liver- related events and histologic cirrhosis and advanced fibrosis.
Materials and Methods
FinnisH FinRisK population
Data (DeRiVation CoHoRt)
Data were from the FINRISK studies from 2002, 2007, and 2012. The FINRISK studies were cross- sectional population surveys carried out in Finland in a systematic and standardized fashion every 5 years since 1972 by the Finnish Institute for Health and Welfare (previously National Public Health Institute). The objective was to assess risk factors for chronic diseases in representative pop-ulation samples of adults aged 25- 74 years drawn from the Finnish Population Information System, stratified by sex, 10- year age groups, and five to six geographic areas of Finland.(24) The FINRISK 2002- 2012 cohorts together comprised 20,540 par-ticipants with available registry linkage. Detailed descriptions of study protocols have been pub-lished.(24) Definitions of baseline variables are
described in the Supporting Materials. All partic-ipants provided signed informed consent, and the studies were approved by the Coordinating Ethical Committee of the Helsinki and Uusimaa Hospital District.
FINRISK data were linked with the National Hospital Discharge Register for data on hospital-izations (data available from 1969), with the Finnish Cancer Registry for malignancies (data available from 1953), and with Statistics Finland for death (data available from 1969). Data collection to all these registries is mandatory by law, and cover-age and general quality are consistent and com-plete.(25) Linkage was performed using the unique
personal identity code assigned to all Finnish res-idents. Follow- up for deaths and hospitalizations were until December 2015 or until emigration. Study endpoints ascertained from these registries were those representing fatal and nonfatal severe liver disease requiring hospital admission or causing hepatocellular carcinoma or liver- related death. The International Classification of Disease (ICD) codes used to define the severe liver- related outcomes are
listed in Supporting Table S1. We excluded individ-uals with a history of chronic liver disease in the outcome registries at baseline (ICD tenth revision: K70- K77, C22.0; ICD eighth/ninth revisions: 570- 573, 155.0) and those with chronic viral hepatitis at baseline or during follow- up.
sWeDisH apolipopRotein
moRtality RisK CoHoRt
(ValiDation CoHoRt)
For purposes of external validation, we used the Swedish Apolipoprotein Mortality Risk (AMORIS) cohort, a general population cohort that underwent health examinations with blood sampling between 1985 and 1996 (baseline period).(26) The cohort consists of 812,073 individuals who were either tak-ing part in yearly routine health checkups through occupational health screening or outpatients in pri-mary care referred for laboratory testing. All indi-viduals of the AMORIS cohort were residents of Sweden and predominantly living in Stockholm County (67%), together constituting approximately 35% of the total population of Stockholm County during this period. A detailed cohort description is available elsewhere.(26)
Herein, we used the same subpopulation of the cohort as in a recent study,(27) comprising 126,941
adults aged 35- 79 years at baseline with available data to calculate both our risk score and the fibrosis- 4 (FIB- 4) score(28) for comparison. Persons with a nosis of chronic liver disease at baseline or any diag-nosis of drug or alcohol abuse at or before baseline were excluded by use of ICD codes. Study baseline was defined as the date of blood sampling. AST and ALT were determined using an enzymatic ultraviolet test by a Technicon DAX 96 Multichannel Analyzer with a total imprecision <6.0% of coefficient of vari-ation. Subjects were linked using the unique Swedish personal identification number with Swedish national registers for hospitalizations, specialized outpatient care, incident cancers, causes of deaths, and migration or continued residency in Sweden until December 31, 2011. The liver outcomes were ICD codes cor-responding to a diagnosis of cirrhosis, liver failure, hepatocellular carcinoma, liver transplantation, or decompensated liver disease. The registers used and the linkage procedure are described in detail in the Supporting Materials.
sWeDisH naFlD Data
(ValiDation CoHoRt)
Further validation was performed in a cohort comprising all patients with biopsy- proven NAFLD at Karolinska University Hospital, Huddinge, and Linköping University Hospital from 1985 to 2009 (n = 646).(29) Subjects enrolled before 1985 (n = 167, 26%) were excluded due to uncertainty regarding the standardization of transaminase measurements at that time. Steatosis had been identified through the system-ized nomenclature of medicine (SNOMED), and the diagnosis of NAFLD was further ascertained through medical chart review, as reported.(29) Exclusions were
daily alcohol use of >30 g for men or >20 g for women at baseline or during follow- up, binge drinking (≥5 drinks for men or ≥4 drinks for women on the same occasion), any concurrent liver disease, use of medi-cations associated with steatosis, and baseline hepa-tocellular carcinoma or baseline decompensated liver disease. Histopathologic evaluation was centralized and post hoc using current classifications.(29) Subjects
were linked with Swedish national registers in the same way and for the same incident liver- related out-comes as in the AMORIS cohort.
Boston naFlD anD HCV Data
(ValiDation CoHoRts)
The Boston NAFLD cohort was derived from a prospective NAFLD registry of 182 patients with biopsy- proven NAFLD at Beth Israel Deaconess Medical Center started in 2009. Patients with other forms of chronic liver diseases, alternative causes for fatty liver, or daily alcohol use of >20 g were excluded. Laboratory tests, blood collection, as well as medical history were performed at enrollment. Liver biopsy was performed within 3 months of the index visit.
The Boston HCV cohort comprised a total of 124 patients enrolled for a transient elastography regis-try study between 2004 and 2017. All subjects had a diagnosis of HCV by HCV- RNA polymerase chain reaction. Liver biopsies were performed as part of the routine clinical care for staging of liver disease at the time. Coexisting chronic liver diseases were reasonably excluded by history and standard clinical care, except for coexisting hepatitis B or human immunodeficiency virus infections, as reported.(30)
DanisH alD Data (ValiDation
CoHoRt)
Finally, we included for validation purposes a pro-spective cohort of 444 adult subjects (18- 75 years) with a history of excessive alcohol use (>24 g/day for women and >36 g/day for men) for ≥1 year recruited from either primary care (two municipal alcohol rehabilitation centers and community call) or sec-ondary care (three outpatient hospital liver clinics) between 2013 and 2017, as described.(17,31) Main
exclusions were baseline decompensated liver dis-ease, concurrent liver disdis-ease, and cholestasis.(17,31)
Histologic liver fibrosis was staged from 0 to 4 according to Kleiner.(17,31) Liver- related outcomes
comprising alcoholic hepatitis, varices needing treat-ment, upper gastrointestinal bleeding, ascites, spon-taneous bacterial peritonitis, hepatic encephalopathy, hepatocellular carcinoma, hepatorenal syndrome, or jaundice were ascertained from medical records.
statistiCal analyses
For comparing groups, we used chi square or Mann- Whitney tests, as appropriate. Pairwise cor-relations between continuous variables were assessed by the Spearman test. In the FINRISK cohort, base-line predictors of liver outcomes were estimated by Cox proportional hazards models with time to first event as the outcome variable. The proportional haz-ards assumption of the Cox model was checked using Schoenfeld residuals, and no violations were detected. Covariates were assessed for a possible nonlinear relationship with the outcome using restricted cubic splines with degrees of freedom selected using the Akaike Information Criterion (AIC). Models were compared using the log- likelihood test.
The best model was chosen by comparing the Harrell’s C- statistic, AIC, net reclassification improve-ment (categories were 1%, 5%, and 10% for 10- year follow- up), and by the likelihood ratio test to examine model fit of the nested models. We assessed internal validation of the final model to correct the C- statistic for optimism (overfitting) by bootstrapping 200 sam-ples of the derivation data. Subgroup analyses of the FINRISK cohorts were performed separately by sex, age (<50 years or ≥50 years), body mass index ≥30 kg/m2, and presence at baseline of diabetes or metabolic syn-drome or NAFLD or alcohol risk use.
In the FINRISK cohort, we calculated the 10- year cumulative incidence of liver- related events in quan-tiles of the linear predictor of the final Cox model, each quantile including a minimum of five outcome events; quantiles were then combined to yield groups with 10- year cumulative incidence of liver events <1%, 1%- 4%, 5%- 9%, and ≥10%. Cumulative incidence was analyzed by the Aalen- Johansen method, considering death without severe liver disease as a competing risk.
External validation was performed by calculating a risk score for each person in the validation cohort using the predictors and the respective beta coefficients as estimated in the derivation cohort. We then exam-ined the performance of the model by the C- statistic (incident severe liver disease) or area under the curve (AUC) (fibrosis stage) and stratified subjects in risk groups by the risk- score cutoffs derived from the deri-vation cohort. We calculated sensitivity, specificity, and positive and negative predictive value (PPV and NPV) for advanced fibrosis (stage 3- 4) and cirrhosis (stage 4) by risk strata. In the clinical biopsy cohorts, a possible increasing trend between the risk score and fibrosis stage was tested by the Jonckheere- Terpstra trend test. In the two largest biopsy cohorts, we studied which histologic features contributed independently to the risk model by a multivariable linear regression with histologic fibrosis stage (0- 4), lobular inflammation (0- 3), ballooning (0- 2), and steatosis score (1- 3) as independent covariates and the risk score (dynamic AAR [dAAR] score) as the dependent variable. We compared the C- statistic and AUC of the model to the following published fibrosis scores: FIB- 4,(28) AST/platelet ratio index (APRI),(32)
and NAFLD fibrosis score.(20) Data were analyzed with
R software version 3.6.1 and STATA version 14.2.
Results
FinnisH DeRiVation CoHoRt
(FinRisK)
The FINRISK cohort comprised 18,067 adult subjects from the general population with available ALT and AST measurements. Demographics of the FINRISK cohort are shown in Table 1. Correlation
between ALT and AST was moderate (r = 0.67,
P < 0.001; Supporting Fig. S1) but stronger among
alcohol risk drinkers (r = 0.74, P < 0.001) than non-risk drinkers (r = 0.65, P < 0.001). There was a strong inverse correlation between AAR and ALT (r = −0.82,
P < 0.001; Supporting Fig. S2) showing higher AARs
at lower levels of ALT.
We observed 89 incident events of severe liver dis-ease during a mean follow- up of 8.2 years (SD, 4.1; range, 0- 13.0 years; 148,149 person- years at risk). ALT, AST, and AAR exhibited significantly non-linear age- adjusted associations with incident liver- related outcomes in both men and women (P < 0.001; Supporting Figs. S3- S5).
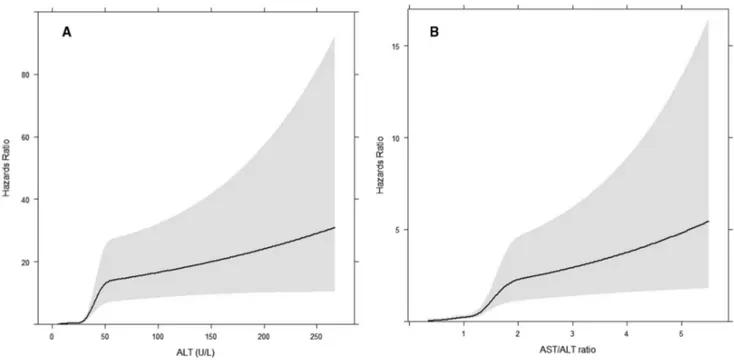
The C- statistic for a Cox model considering only the AAR with or without age was 0.71 and 0.64, respectively (Supporting Table S2). Performance characteristics for all the candidate models are shown in Supporting Table S2. The final model consisted of age (continuous variable), AAR, and ALT; this model was chosen as it exhibited the best AIC and significantly better model fit compared to the other candidate models (P < 0.005, likelihood ratio test). In addition, this model yielded a net reclassification improvement of 15%- 50% compared to the other candidate models (Supporting Table S2). ALT and AAR remained significantly nonlinear in the model (P < 0.001; Fig. 1). The bootstrap optimism- corrected C- statistic for the final age- adjusted model was 0.81. The hazards ratio of the model’s linear predictor for liver outcomes was 2.72 (95% confidence interval [CI], 2.37- 3.11). The equation for the final model in R language is:
The equation in other software languages and a calculator are in the Supporting Material.
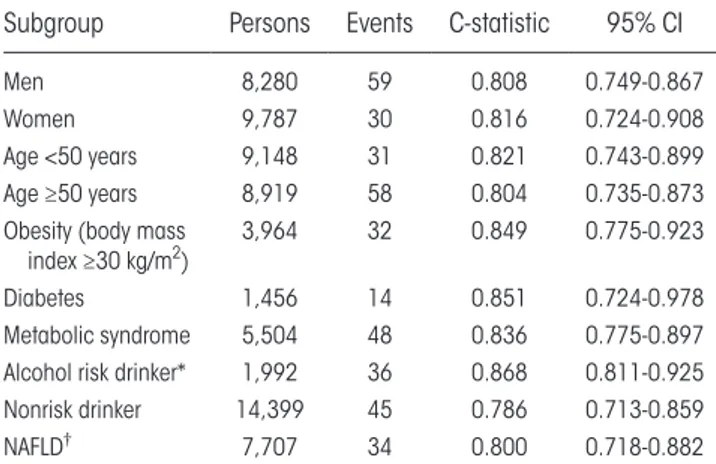
In sensitivity analyses, the C- statistic of the final model remained at or above 0.8 in both sexes and age groups and in subjects with obesity, diabetes, meta-bolic syndrome, NAFLD, or alcohol risk use (Table 2). The best discrimination was observed in subjects with alcohol risk drinking (C- statistic, 0.87), obesity (C- statistic, 0.85), or diabetes (C- statistic, 0.85).
dAAR < −10.129915 + 0.039811813 ∗ dataset$AGE + 0.25387407 ∗ dataset$ALT − 0.0023607234 ∗ pmax(dataset$ALT − 11, 0)3+ 0.0079492072 ∗ pmax(dataset$ALT − 17, 0)3−0.0076811579 ∗ pmax(dataset$ALT − 22, 0)3+0.0021985068 ∗
pmax(dataset$ALT − 30, 0)3−0.00010583268 ∗ pmax(dataset$ALT − 58, 0)3+3.5333535 ∗ dataset$AAR − 7.3473709 ∗
pmax(dataset$AAR − 0.63, 0)3+32.911587 ∗ pmax(dataset$AAR − 0.92, 0)3−44.937707 ∗ pmax(dataset$AAR − 1.14, 0)3+21.786619 ∗ pmax(dataset$AAR − 1.41, 0)3−2.4131284 ∗ pmax(dataset$astalt − 2.13, 0)3.
taBle 1. Baseline CHaRaCteRistiCs oF tHe stuDy CoHoRts
Cohort
Population Cohorts Liver Biopsy Cohorts
HCV patients ALD patients
Population (FINRISK)
Population
(AMORIS) NAFLD patients NAFLD patients
Country Finland Sweden Sweden USA USA Denmark
Cohort profile Populationbased Populationbased Biopsy Biopsy Biopsy Biopsy
Persons, n 18,067 126,941 479 182 124 444
Age (years), mean (SD) 49.7 (4.8) 53.2 (11.8) 48.4 (14.0) 55.7 (12.6) 48.1 (9.23) 56.5 (10.5)
Women, n (%) 9,787 (54) 70,893 (56) 183 (38) 74 (41) 33 (27) 108 (24)
Alcohol use (g/week), mean (SD) 84 (35) <140 (women)
<210 (men) <140 185 (310)
†
Active smokers, n (%) 3,976 (22) 101 (21) 19 (10) 247 (56)
Body mass index (kg/m2), mean (SD) 26.9 (4.8) 24.5 (4.0)* 28.4 (4.2) 34 (6.5) 26.7 (4.4) 27.5 (5.3)
Waist circumference (cm), mean (SD) 91.0 (13.8) 94 (14.7) 104.4 (15.6)
Diabetes, n (%) 1,456 (8) 5,091 (4) 65 (14) 55 (30) 11 (10) 62 (14)
ALT (U/L), mean (SD) 26.9 (18.5) 27.5 (37.8) 87.2 (53.0) 74.4 (50) 72.5 (59.1) 39.9 (33.2)
AST(U/L), mean (SD) 28.3 (19.0) 22.7 (20.1) 51.0 (33.6) 50.7 (32.1) 60 (47) 46.2 (37.7)
Histologic fibrosis stage, n (%)
0 119 (25) 57 (31) 14 (12) 36 (10)‡
1 187 (39) 40 (22) 50 (44) 122 (35)
2 115 (24) 51 (28) 13 (11) 104 (29)
3 40 (8) 20 (11) 13 (11) 26 (7)
4 18 (4) 14 (8) 24 (21) 66 (19)
*Available for 11,646 persons.
†Median 48 g/week (IQR, 0- 276) and 187 (42%) were abstaining from alcohol at the time of inclusion.
‡Since 2016, the ALD cohort included 90 patients with a liver stiffness <6.0 kPa (FibroScan) and therefore not biopsied; these are
con-sidered not to have fibrosis stage 3 or 4 in the analyses. Abbreviation: USA, United States of America.
Fig. 1. Association between transaminases and incident liver disease. (A) ALT and incident liver disease and (B) AST/ALT ratio and
sWeDisH ValiDation CoHoRt
(amoRis)
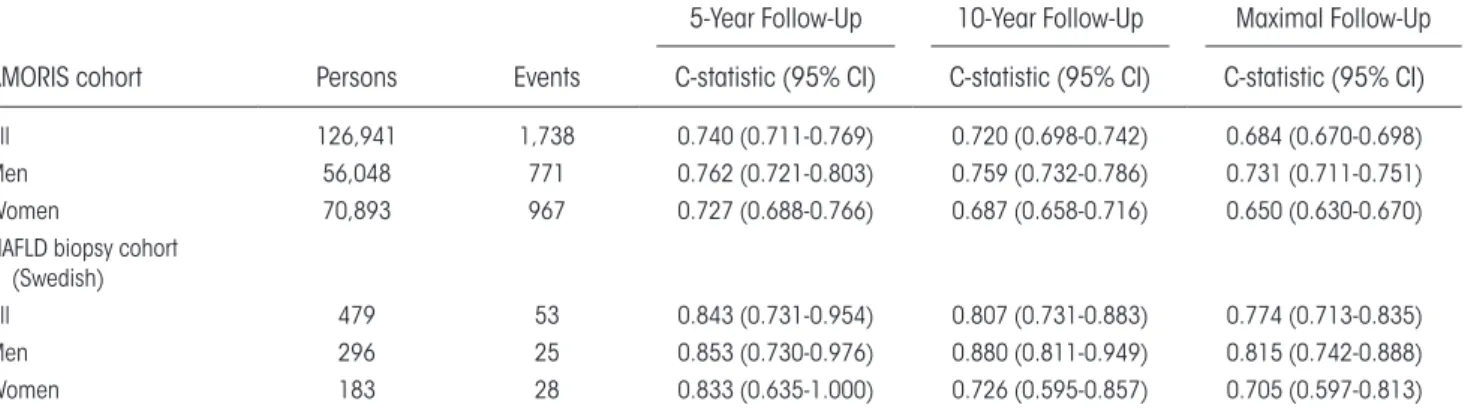
The AMORIS cohort comprised 126,941 subjects with 1,738 incident liver- related events (1.4%) during a median 18- year follow- up (interquartile range [IQR], 15- 21; 2,146,700 person- years at risk), 717 liver- related events within 10 years, and 343 within 5 years from baseline (Table 1). For follow- up restricted to 5 years, the C- statistic for the age- adjusted model was 0.74; for follow- up restricted to 10 years, 0.72; and for the entire follow- up period of 27 years, 0.68 (Table 3). For men, the corresponding values for C- statistic were somewhat higher, 0.73, 0.76, and 0.76, respectively, compared to women (Table 3). The hazard ratio (HR) of the model’s linear predictor for liver- related out-comes was 1.54 (95% CI, 1.51- 1.57).
sWeDisH naFlD ValiDation
CoHoRt
In the Swedish NAFLD biopsy cohort of 479 patients with a median follow- up of 18 years (IQR, 12- 24), there were 53 (11%) incident severe liver- related clinical events. Of these events, 27 (51%) occurred within 10 years from baseline. The C- statistic of the risk model for follow- up restricted to 10 years was 0.81 for the entire cohort, 0.88 for men, and 0.73 for women (Table 3).
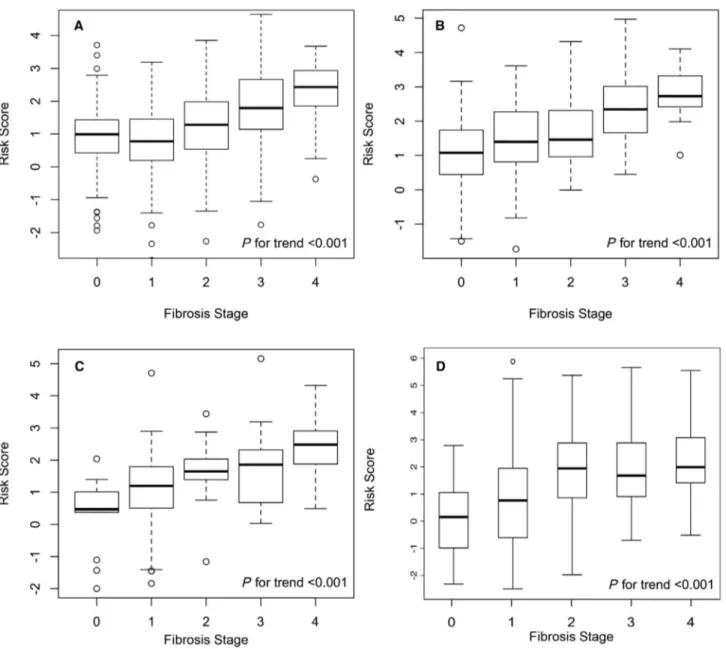
The risk model was significantly associated with prevalent histologic fibrosis stage (Fig. 2). The AUC
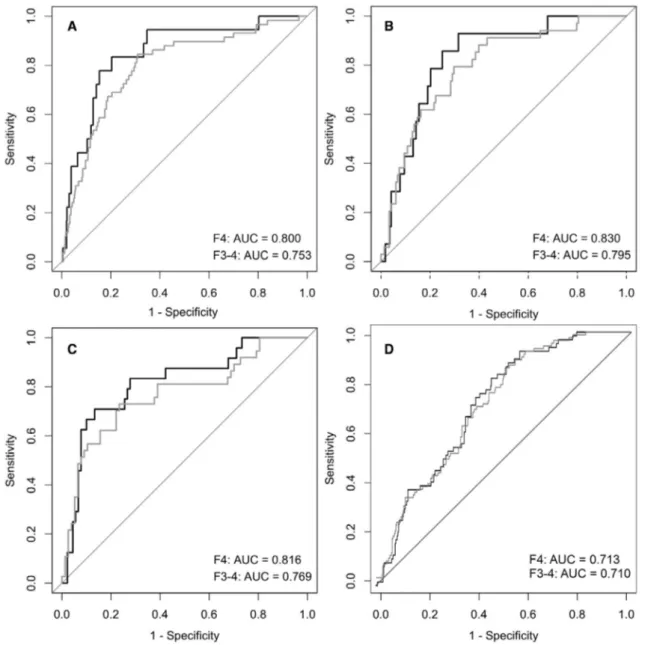
was 0.80 (95% CI, 0.67- 0.93) for detection of prev-alent cirrhosis and 0.75 (95% CI, 0.68- 0.83) for prevalent advanced fibrosis stage 3- 4 (Fig. 3). By mul-tivariable linear regression analysis considering fibrosis stage, lobular inflammation, ballooning, and steatosis score as dependent covariates, fibrosis stage was the only factor significantly associated with the risk score.
Boston naFlD anD HCV
ValiDation CoHoRts
In both the U.S. biopsy cohorts of 182 patients with NAFLD and 124 patients with HCV from a tertiary referral hospital in Boston, MA (Table 1), the risk model was significantly associated with histologic fibrosis stage (Fig. 2). In the NAFLD cohort, the AUC was 0.83 (95% CI, 0.73- 0.93) for detection of cirrho-sis and 0.80 (95% CI, 0.71- 0.88) for advanced fibrocirrho-sis stage 3- 4 (Fig. 3). In the HCV cohort, the AUC was 0.82 (95% CI, 0.72- 0.92) for detection of cirrhosis and 0.77 (95% CI, 0.67- 0.87) for advanced fibrosis (Fig. 3).
DanisH alD ValiDation
CoHoRt
The Danish ALD cohort comprised 444 patients (Table 1). During a median follow- up of 3.1 years (IQR, 1.5- 4.7) of 409 patients with available follow- up data, there were 71 (17%) incident liver- related clini-cal events. The C- statistic of the risk model was 0.75 (95% CI, 0.69- 0.80) and was 0.77 for men and 0.68 for women.
The risk model was significantly associated with histologic fibrosis stage (Fig. 2). However, the AUC was suboptimal with 0.71 (95% CI, 0.66- 0.77) for detection of cirrhosis and 0.71 (95% CI, 0.66- 0.76) for advanced fibrosis stage 3- 4 (Fig. 3).
By multivariable linear regression analysis consid-ering fibrosis stage, lobular inflammation, ballooning, and steatosis score as dependent covariates, all except ballooning were significantly independently asso-ciated with the risk score (P < 0.01; P = 0.079 for ballooning). Steatosis had the strongest correlation with the risk score (correlation coefficient 0.64; 95% CI, 0.48- 0.80; compared to correlation coefficients of 0.25 for fibrosis and ballooning and 0.38 for lobular inflammation).
Replacing absolute ALT level with absolute AST level in the risk model improved the AUC to 0.82 taBle 2. sensitiVity analyses FoR tHe daaR
RisK moDel DisCRimination oF inCiDent seVeRe liVeR Disease in tHe FinRisK CoHosRt
Subgroup Persons Events C- statistic 95% CI
Men 8,280 59 0.808 0.749- 0.867
Women 9,787 30 0.816 0.724- 0.908
Age <50 years 9,148 31 0.821 0.743- 0.899
Age ≥50 years 8,919 58 0.804 0.735- 0.873
Obesity (body mass
index ≥30 kg/m2) 3,964 32 0.849 0.775- 0.923
Diabetes 1,456 14 0.851 0.724- 0.978
Metabolic syndrome 5,504 48 0.836 0.775- 0.897 Alcohol risk drinker* 1,992 36 0.868 0.811- 0.925
Nonrisk drinker 14,399 45 0.786 0.713- 0.859
NAFLD† 7,707 34 0.800 0.718- 0.882
*Average alcohol intake ≥30 grams of ethanol per day for men and ≥20 grams per day for women.
(95% CI, 0.77- 0.87) for prevalent cirrhosis and 0.80 (95% CI, 0.75- 0.85) for advanced fibrosis. Similarly, the C- statistic for predicting liver- related events improved to 0.84 (95% CI, 0.80- 0.88) with 0.86 for men and 0.77 for women.
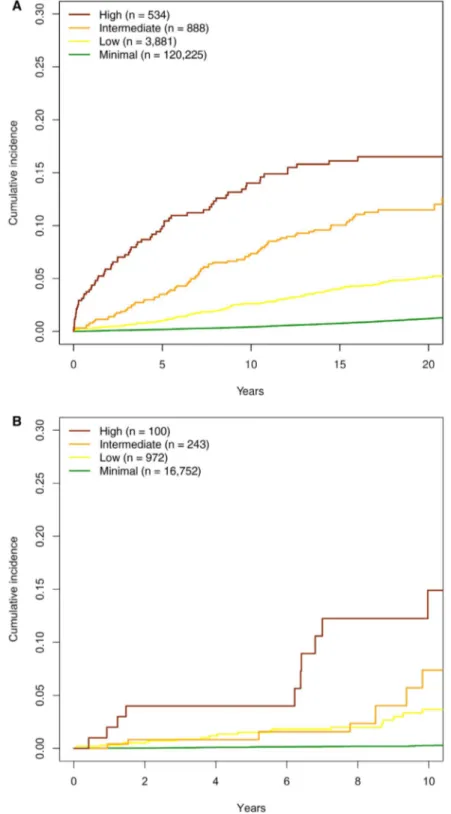
RisK stRatiFiCation
The cumulative incidence of liver outcomes by risk group was similar in the AMORIS and FINRISK cohorts (Fig. 4). Cumulative incidences of death without liver disease are shown in Supporting Fig. S6. Corresponding incidence figures by sex are shown in Supporting Fig. S7. A color- coded scoring sheet for easy application of the prediction model with risk esti-mates for both incident liver- related events and PPVs for the presence of advanced liver fibrosis and cirrhosis in these risk groups is provided in Fig. 5. Diagnostic measures of the risk score using cutoffs by sensitivity, specificity, or Youden index to detect advanced fibro-sis and cirrhofibro-sis in the Swedish NAFLD cohort are shown in Supporting Table S3.
CompaRison to puBlisHeD
FiBRosis sCoRes
Compared to published fibrosis scores, the pres-ent risk model exhibited a similar 10- year C- statistic for predicting incident severe liver disease in the AMORIS cohort (0.72 [present risk model] ver-sus 0.71 for FIB- 4, 0.67 for APRI, and 0.63 for NAFLD fibrosis score). In the Swedish NAFLD cohort, the 10- year C- statistic was comparable to the other scores (0.81 vs. 0.80- 0.82; Supporting Table S4) and identical to that for histologic fibrosis
stage (C- statistic 0.81). In the Danish ALD cohort, however, all the other fibrosis scores outperformed the present one (Supporting Table S4). On the other hand, performance of the risk score with absolute AST level instead of absolute ALT level was better than all the other fibrosis scores in the Danish ALD cohort.
For detection of advanced histologic fibrosis (stage 3- 4) or cirrhosis (stage 4), performance of our risk model was comparable to the other fibrosis scores in NAFLD and HCV, varying by cohort (Supporting Fig. S8; Supporting Table S5). In ALD, however, performance was poorer but again improved by using AST instead of ALT in the model.
In the Swedish NAFLD cohort, our risk model predicted a 10- year risk of severe liver events inde-pendently of baseline histologic fibrosis stage (HR, 1.88; 95% CI, 1.30- 2.72; P < 0.001). A similar effect was not seen for FIB- 4 (P = 0.87) or APRI (P = 0.62). Even among the 58 patients with baseline fibrosis stage 3- 4, our risk model predicted incident severe liver events (HR, 2.22; 95% CI, 1.76- 2.80;
P < 0.001).
Discussion
This study confirms our clinical hypothesis that the predictive performance for incident liver- related outcomes of a specific AAR level depends on the absolute ALT level. We show that a risk model built on this concept can be used for prediction of future liver- related outcomes and helps in detec-tion of prevalent advanced chronic liver disease. The model, which we call the dAAR score, was validated taBle 3. DaaR moDel DisCRimination oF inCiDent seVeRe liVeR Disease in tHe amoRis
CoHoRt anD sWeDisH naFlD CoHoRt
AMORIS cohort Persons Events
5- Year Follow- Up 10- Year Follow- Up Maximal Follow- Up C- statistic (95% CI) C- statistic (95% CI) C- statistic (95% CI)
All 126,941 1,738 0.740 (0.711- 0.769) 0.720 (0.698- 0.742) 0.684 (0.670- 0.698)
Men 56,048 771 0.762 (0.721- 0.803) 0.759 (0.732- 0.786) 0.731 (0.711- 0.751)
Women 70,893 967 0.727 (0.688- 0.766) 0.687 (0.658- 0.716) 0.650 (0.630- 0.670)
NAFLD biopsy cohort (Swedish)
All 479 53 0.843 (0.731- 0.954) 0.807 (0.731- 0.883) 0.774 (0.713- 0.835)
Men 296 25 0.853 (0.730- 0.976) 0.880 (0.811- 0.949) 0.815 (0.742- 0.888)
in several independent cohorts. The dAAR score had reasonable discrimination with an optimism- corrected C- statistic of 0.81 for incident liver dis-ease in the Finnish general population cohort. In the Swedish AMORIS cohort, model discrimina-tion decreased with longer follow- up times, with the C- statistic being 0.74 at 5 years and 0.68 at a median follow- up of 18 years; this indicated better performance for liver events occurring early during follow- up. In the Swedish NAFLD cohort, the 10- year C- statistic of the dAAR score (0.81) for
predicting incident severe liver outcomes was iden-tical to that of the histologic fibrosis stage. In the Danish ALD cohort, the C- statistic was 0.75, which is reasonable but inferior to previous fibrosis scores. A different case mix regarding, for example, age, dia-betes, and alcohol use, and therefore different ALT and AST levels, may contribute to the differences in model performance measures among the cohorts.
Our model is built on the AAR, which was first associated with liver disease stage by de Ritis et al. in 1957.(9) The underlying mechanisms for a rising Fig. 2. Box plots showing the distribution of the dAAR score by liver fibrosis stage in the different cohorts. (A) Swedish NAFLD, (B)
Boston NAFLD, (C) hepatitis C, and (D) ALD cohorts. Graphs show interquartile range (box), median (horizontal line), and outliers (whiskers).
AAR with increasing liver fibrosis are unclear but may involve both an increased hepatocyte mitochon-drial release and prolonged clearance by liver sinu-soidal endothelial cells of especially mitochondrial AST.(10,33- 35) Our finding that a clinically relevant cutoff for AAR decreases with increasing ALT is well in line with a study showing that healthy adults without liver disease often have an AAR above 1 when their ALT is low.(23) In contrast, according to the dAAR score, at high ALT levels, an AAR as low as 0.5 may indicate advanced liver fibrosis.
In the FINRISK cohort, the dAAR score yielded a net reclassification improvement of 20%- 21% for prediction of incident severe liver outcomes com-pared to ALT or AST alone. In the AMORIS pop-ulation cohort and the clinical cohorts, the dAAR score performed well compared to other noninvasive fibrosis scores, while performance was poorer in the Danish ALD cohort. Advantages of the dAAR score over existing noninvasive scores include simplicity to use with the color- coded sheet (Fig. 5) and the fact that it was specifically designed to predict clinical Fig. 3. Receiver operating characteristic plots for cirrhosis (fibrosis stage 4) and advanced fibrosis (stages 3- 4) in the different cohorts.
Fig. 4. Cumulative incidence of severe liver disease by risk group. (A) AMORIS cohort and (B) FINRISK cohort. Analysis was
performed using the Aalen- Johansen method considering death without liver disease as a competing risk event. Follow- up was 20 years for the AMORIS cohort and 10 years for the FINRISK cohort.
liver outcomes in an unselected general population. Previous fibrosis models have been developed to detect fibrosis in highly selected patient cohorts from spe-cialized clinics, but their accuracy for fibrosis detection in unselected population cohorts is poorer (AUC 0.6- 0.7).(4) In contrast to other fibrosis scores, the dAAR
score is not reliant on platelet counts, and this may be beneficial in specific clinical situations when there are competing causes for thrombocytopenia and in epide-miologic studies when platelet counts are unavailable.
The AAR was traditionally regarded as a marker of alcohol abuse.(36) However, a recent study showed Fig. 5. Use of the dAAR score for prediction of liver outcomes and advanced fibrosis. (A) Interaction between AST/ALT ratio and
ALT levels by age in the dAAR score. Risk is depicted by different colors, with green representing the lowest risk and red the highest risk. (B) The 10- year cumulative incidence estimates from the FINRISK and AMORIS cohorts and likelihood of advanced liver fibrosis (%F3- F4) or cirrhosis (%F4) in biopsied patient cohorts of NAFLD (Swedish and Boston cohorts combined), HCV, and ALD. The percentages for %F3- F4 and %F4 depict the number of individuals with F3- F4 or F4 on liver histology divided by the number of individuals in that specific risk category. For ALD, results are given both for the dAAR score with absolute ALT level and for the dAAR score with absolute AST level because performance of the AST model was substantially better in this cohort.
that the AAR was useful in distinguishing patients with alcoholic cirrhosis from subjects with similar alcohol use without cirrhosis (AUC, 0.77).(18) In that study, the AAR decreased somewhat with abstinence but still remained higher in abstinent previous heavy drinkers with cirrhosis than in abstinent previous heavy drinkers without cirrhosis.(18) In our study, the dAAR score showed excellent performance for pre-dicting incident liver- related outcomes in the sub-group of risk drinkers in the Finnish cohort while performance was poorer in the Danish ALD cohort. The reason for this difference is unclear. Interestingly, performance of the dAAR score improved substan-tially when using absolute AST level instead of ALT in the score. Further study is needed to clarify when to possibly substitute ALT for AST in risk prediction using the dAAR score.
Strengths of our study include the large and repre-sentative cohorts. External validation was undertaken in five different cohorts from four different countries, showing reasonable performance for the prediction of incident liver- related events. Validation in several countries also reduces potential bias from laboratory- or assay- specific issues. Both the Finnish and Swedish national registries used for outcome data are consid-ered to be of very high quality.(25,37- 41) The clinical
cohorts used histology, the gold standard, as reference. Study limitations include the absence of a reference measure for baseline liver fibrosis in the general pop-ulation cohorts. We also had only one measurement of liver tests at baseline, while repeat measurements over time might have increased model performance. The Nordic populations are fairly homogeneous, and we therefore validated the model also in independent U.S. cohorts but only for fibrosis stage. More external validation in diverse ethnic populations are welcomed.
Despite the existence of several noninvasive liver fibrosis tests, these have so far been poorly adopted by primary care physicians.(42,43) The dAAR score based on only two standard, widely- used, and inex-pensive liver tests can help risk stratify persons in the community with regard to both advanced liver fibrosis and risk for incident clinical liver events with minimal added resource burden. Whereas most noninvasive fibrosis tests were developed for use in at- risk populations, such as those with confirmed steatosis or elevated ALT, to detect subclinical fibro-sis,(44,45) the dAAR score was specifically developed
for an unselected general population and prediction
of liver- related outcomes. This implies that one can apply our model as a screening tool for the population without the need for preceding “suspicion- triggers” for liver disease. This information could then be used to guide referral practices in primary health care. An example of how the dAAR score can be applied in clinical practice is provided in Supporting Fig. S9.
The dAAR score is intended for use in primary care outpatient settings where transaminase levels are stable and not in situations with acute liver injury. It must also be kept in mind that AST elevations may be due to nonhepatic causes, which should be excluded before use.
In conclusion, the dAAR score provides a means to easily stratify the general population with regard to risk for incident severe liver disease. The predic-tive performance of the dAAR score is largely based on the ALT- dependent ability of the AAR to detect subclinical cirrhosis. The dAAR score is intended as a screening tool for the unselected general population and as a trigger for further liver evaluations.
Acknowledgment: Data used for the research were
from the Finnish Institute for Health and Welfare (obtained from THL Biobank). We thank all study participants for their generous participation in the FINRISK 2002- 2012 studies, and we thank the Jungner Foundation of Laboratory Medicine for AMORIS.
ReFeRenCes
1) O’Sullivan JW, Stevens S, Hobbs FDR, Salisbury C, Little P, Goldacre B, et al. Temporal trends in use of tests in UK primary care, 2000- 15: retrospective analysis of 250 million tests. BMJ 2018;363:k4666. Erratum in: BMJ 2019;364:l444.
2) Newsome PN, Cramb R, Davison SM, Dillon JF, Foulerton M, Godfrey EM, et al. Guidelines on the management of abnormal liver blood tests. Gut 2018;67:6- 19.
3) Ioannou GN, Boyko EJ, Lee SP. The prevalence and predictors of elevated serum aminotransferase activity in the United States in 1999- 2002. Am J Gastroenterol 2006;101:76- 82.
4) Caballeria L, Pera G, Arteaga I, Rodriguez L, Aluma A, Morillas RM, et al. High prevalence of liver fibrosis among European adults with unknown liver disease: a population- based study. Clin Gastroenterol Hepatol 2018;16:1138- 1145.e5.
5) Donnan PT, McLernon D, Dillon JF, Ryder S, Roderick P, Sullivan F, et al. Development of a decision support tool for pri-mary care management of patients with abnormal liver function tests without clinically apparent liver disease: a record- linkage population cohort study and decision analysis (ALFIE). Health Technol Assess 2009;13:iii- iv, ix- xi, 1- 134.
6) European Association for Study of Liver, Asociacion Latinoamericana para el Estudio del Higado. EASL- ALEH clin-ical practice guidelines: non- invasive tests for evaluation of liver disease severity and prognosis. J Hepatol 2015;63:237- 264.
7) Verma S, Jensen D, Hart J, Mohanty SR. Predictive value of ALT levels for non- alcoholic steatohepatitis (NASH) and advanced fibrosis in non- alcoholic fatty liver disease (NAFLD). Liver Int 2013;33:1398- 1405.
8) Harris R, Harman DJ, Card TR, Aithal GP, Guha IN. Prevalence of clinically significant liver disease within the general population, as defined by non- invasive markers of liver fibrosis: a systematic review. Lancet Gastroenterol Hepatol 2017;2:288- 297.
9) de Ritis F, Coltorti M, Giusti G. An enzymic test for the diagno-sis of viral hepatitis; the transaminase serum activities. Clin Chim Acta 1957;2:70- 74.
10) Botros M, Sikaris KA. The de ritis ratio: the test of time. Clin Biochem Rev 2013;34:117- 130.
11) Gawrieh S, Wilson LA, Cummings OW, Clark JM, Loomba R, Hameed B, et al.; NASH Clinical Research Network. Histologic findings of advanced fibrosis and cirrhosis in patients with nonal-coholic fatty liver disease who have normal aminotransferase lev-els. Am J Gastroenterol 2019;114:1626- 1635.
12) McPherson S, Anstee QM, Henderson E, Day CP, Burt AD. Are simple noninvasive scoring systems for fibrosis reliable in pa-tients with NAFLD and normal ALT levels? Eur J Gastroenterol Hepatol 2013;25:652- 658.
13) McPherson S, Stewart SF, Henderson E, Burt AD, Day CP. Simple non- invasive fibrosis scoring systems can reliably exclude advanced fibrosis in patients with non- alcoholic fatty liver disease. Gut 2010;59:1265- 1269.
14) Vilar- Gomez E, Calzadilla- Bertot L, Wai- Sun Wong V, Castellanos M, Aller- de la Fuente R, Metwally M, et al. Fibrosis severity as a determinant of cause- specific mortality in patients with advanced nonalcoholic fatty liver disease: a multi- national cohort study. Gastroenterology 2018;155:443- 457.e17.
15) Afdhal NH, Nunes D. Evaluation of liver fibrosis: a concise re-view. Am J Gastroenterol 2004;99:1160- 1174.
16) Giannini E, Risso D, Botta F, Chiarbonello B, Fasoli A, Malfatti F, et al. Validity and clinical utility of the aspartate aminotransferase- alanine aminotransferase ratio in assessing disease severity and prognosis in patients with hepatitis C virus- related chronic liver disease. Arch Intern Med 2003;163:218- 224.
17) Thiele M, Madsen BS, Hansen JF, Detlefsen S, Antonsen S, Krag A. Accuracy of the enhanced liver fibrosis test vs FibroTest, elastography, and indirect markers in detection of advanced fi-brosis in patients with alcoholic liver disease. Gastroenterology 2018;154:1369- 1379.
18) Whitfield JB, Masson S, Liangpunsakul S, Hyman J, Mueller S, Aithal G, et al.; GenomALC Consortium. Evaluation of labora-tory tests for cirrhosis and for alcohol use, in the context of alco-holic cirrhosis. Alcohol 2018;66:1- 7.
19) Nyblom H, Berggren U, Balldin J, Olsson R. High AST/ALT ratio may indicate advanced alcoholic liver disease rather than heavy drinking. Alcohol Alcohol 2004;39:336- 339.
20) Angulo P, Hui JM, Marchesini G, Bugianesi E, George J, Farrell GC, et al. The NAFLD fibrosis score: a noninvasive system that identifies liver fibrosis in patients with NAFLD. Hepatology 2007;45:846- 854.
21) Guechot J, Boisson RC, Zarski JP, Sturm N, Cales P, Lasnier E; ANRS HCEP 23 Fibrostar Group. AST/ALT ratio is not an index of liver fibrosis in chronic hepatitis C when aminotransfer-ase activities are determinate according to the international rec-ommendations. Clin Res Hepatol Gastroenterol 2013;37:467- 472. 22) Siddiqui MS, Yamada G, Vuppalanchi R, Van Natta M, Loomba
R, Guy C, et al.; NASH Clinical Research Network. Diagnostic accuracy of noninvasive fibrosis models to detect change in fibrosis stage. Clin Gastroenterol Hepatol 2019;17:1877- 1885.e5.
23) Alatalo PI, Koivisto HM, Hietala JP, Puukka KS, Bloigu R, Niemelä OJ. Effect of moderate alcohol consumption on liver en-zymes increases with increasing body mass index. Am J Clin Nutr 2008;88:1097- 1103.
24) Borodulin K, Tolonen H, Jousilahti P, Jula A, Juolevi A, Koskinen S, et al. Cohort profile: the national FINRISK study. Int J Epidemiol 2018;47:696- 696i.
25) Sund R. Quality of the Finnish hospital discharge register: a sys-tematic review. Scand J Public Health 2012;40:505- 515.
26) Walldius G, Malmström H, Jungner I, de Faire U, Lambe M, Van Hemelrijck M, et al. Cohort profile: the AMORIS cohort. Int J Epidemiol 2017;46:1103- 1103i.
27) Hagström H, Talbäck M, Andreasson A, Walldius G, Hammar N. Ability of noninvasive scoring systems to identify individuals in the population at risk for severe liver disease. Gastroenterology 2020;158:200- 214.
28) Sterling RK, Lissen E, Clumeck N, Sola R, Correa MC, Montaner J, et al.; APRICOT Clinical Investigators. Development of a sim-ple noninvasive index to predict significant fibrosis in patients with HIV/HCV coinfection. Hepatology 2006;43:1317- 1325. 29) Hagström H, Nasr P, Ekstedt M, Hammar U, Stål P, Hultcrantz
R, et al. Fibrosis stage but not NASH predicts mortality and time to development of severe liver disease in biopsy- proven NAFLD. J Hepatol 2017;67:1265- 1273.
30) Becker L, Salameh W, Sferruzza A, Zhang KE, Chen R, Malik R, et al. Validation of hepascore, compared with simple indices of fibrosis, in patients with chronic hepatitis C virus infection in United States. Clin Gastroenterol Hepatol 2009;7:696- 701. 31) Thiele M, Detlefsen S, Sevelsted Møller L, Madsen
BS, Fuglsang Hansen J, Fialla AD, et al. Transient and 2- dimensional shear- wave elastography provide compa-rable assessment of alcoholic liver fibrosis and cirrhosis. Gastroenterology 2016;150:123- 133.
32) Wai CT, Greenson JK, Fontana RJ, Kalbfleisch JD, Marrero JA, Conjeevaram HS, et al. A simple noninvasive index can predict both significant fibrosis and cirrhosis in patients with chronic hepatitis C. Hepatology 2003;38:518- 526.
33) Poisson J, Lemoinne S, Boulanger C, Durand F, Moreau R, Valla D, et al. Liver sinusoidal endothelial cells: physiology and role in liver diseases. J Hepatol 2017;66:212- 227.
34) Kamimoto Y, Horiuchi S, Tanase S, Morino Y. Plasma clearance of intravenously injected aspartate aminotransferase isozymes: ev-idence for preferential uptake by sinusoidal liver cells. Hepatology 1985;5:367- 375.
35) Horiuchi S, Kamimoto Y, Morino Y. Hepatic clearance of rat liver aspartate aminotransferase isozymes: evidence for endocy-totic uptake via different binding sites on sinusoidal liver cells. Hepatology 1985;5:376- 382.
36) Nalpas B, Vassault A, Charpin S, Lacour B, Berthelot P. Serum mitochondrial aspartate aminotransferase as a marker of chronic alcoholism: diagnostic value and interpretation in a liver unit. Hepatology 1986;6:608- 614.
37) Pukkala E. Biobanks and registers in epidemiologic research on cancer. Methods Mol Biol 2011;675:127- 164.
38) Brooke HL, Talbäck M, Hörnblad J, Johansson LA, Ludvigsson JF, Druid H, et al. The Swedish cause of death register. Eur J Epidemiol 2017;32:765- 773.
39) Ludvigsson JF, Andersson E, Ekbom A, Feychting M, Kim J- L, Reuterwall C, et al. External review and validation of the Swedish national inpatient register. BMC Public Health 2011;11:450. 40) Barlow L, Westergren K, Holmberg L, Talback M. The
complete-ness of the Swedish Cancer Register: a sample survey for year 1998. Acta Oncol 2009;48:27- 33.
41) Ludvigsson JF, Almqvist C, Bonamy AK, Ljung R, Michaelsson K, Neovius M, et al. Registers of the Swedish total population and their use in medical research. Eur J Epidemiol 2016;31:125- 136. 42) Polanco- Briceno S, Glass D, Stuntz M, Caze A. Awareness of
nonalcoholic steatohepatitis and associated practice patterns of pri-mary care physicians and specialists. BMC Res Notes 2016;9:157. 43) Serfaty L. Management of patients with non- alcoholic
steatohep-atitis (NASH) in real life. Liver Int 2018;38(Suppl. 1):52- 55. 44) Younossi ZM, Henry L. Are noninvasive scoring systems
for persons with chronic liver disease ready for prime time? Gastroenterology 2020;158:40- 42.
45) Castera L, Friedrich- Rust M, Loomba R. Noninvasive assessment of liver disease in patients with nonalcoholic fatty liver disease. Gastroenterology 2019;156:1264- 1281.e4.
Supporting Information
Additional Supporting Information may be found at onlinelibrary.wiley.com/doi/10.1002/hep4.1700/suppinfo.