Örebro universitet Örebro University
Institutionen för School of Science and Technology
naturvetenskap och teknik SE-701 82 Örebro, Sweden
Degree Project, 15 Credits
Evaluating the measured grip stiffness of different
carton board material properties and geometries
Ahmed Abdulkareem, Omar Al-Radi Mechanical Engineering, 180 Credits
Örebro Spring Semester 2018
Abstract
This candidate thesis reports the findings of a study on an objective method for measuring grip stiffness in carton board packages with different geometries and material properties. Syntouch Biotac and a tensile tester were used as an objective method for measuring grip stiffness. In this project tests were carried out on packages with three different grammages and two different geometries. For each grammage and geometry, ten packages were tested. The study identifies that the applied method for the measurement of grip stiffness works to measure the change in grip stiffness regardless of where a load was applied on a package. Furthermore, the method demonstrates reasonable results. Finally, the study concluded that the objective testing method could distinguish between different material properties and geometries of the cartons being measured.
Sammanfattning
En studie om en objektiv metod för mätning av greppstyvhet hos kartongförpackningar med olika geometrier och materialegenskaper rapporteras här. Syntouch Biotac och en provdragare användes som objektiv metod för mätning av greppstyvhet. I detta projekt utfördes tester på förpackningar med tre olika materialegenskaper (ytvikter) samt två olika geometrier. För varje ytvikt och geometri testades tio förpackningar. Studien visar att den maskinbaserade metoden för mätning av greppstyvhet fungerar för att mäta förändring i greppstyvhet oberoende av på var tryck appliceras på förpackningen. Dessutom påvisade studien rimliga resultat. I studien kom författarna även fram till att den maskinbaserade metoden kan skilja olika materialegenskaper och geometrier åt, vilket är verifierar metoden.
Preface
This thesis was written by Ahmed Abdulkareem (Swedish ID No.: 770611) and Omar Al-Radi (Swedish ID No.: 960424), then bachelor’s students at Örebro University. The subject of the thesis was chosen because of the authors’ interest in material science and mechanics. By taking part in this project we had the opportunity to learn about a new material which for us was unknown in terms of its mechanical behavior. Paper is a very interesting material and it plays a huge role in creating more environment friendly packaging. We want to thank our supervisor associate professor Christer Korin (Phd) at Örebro University for introducing us to packaging. We also want to thank him for all the time he spent answering all our questions, for all the meaningful advice he gave us and for sharing a lot of his experience and
information about cartonboard packaging.
We also want to thank Lena Dhalberg for giving us the opportunity to visit BillerudKorsnäs and for giving us the opportunity to manufacture the cartonboard packages we needed to conduct this study.
Lisa Furingsten, thank you for welcoming us to BillerudKorsnäs and for patiently teaching us how to manufacture the cartonboard packages we needed. You were very patient with us and tried your best to give us perfect packages for testing. Thank you very much for the time you spent teaching us and helping us.
Table of content
1 INTRODUCTION ... 6
1.1 The project ... 6
2 BACKGROUND ... 7
2.1 The problem of measuring grip stiffness ... 7
2.2 Current work ... 8
2.3 Previous work ... 8
2.4 Technical field ... 9
2.5 Theory ... 9
2.5.1 Biotac ... 9
2.5.2 Paper products and their properties ... 10
2.5.3 Grip stiffness ... 13
2.5.4 Carton board used in this research ... 13
3 METHOD ... 15
3.1 Cartonboard manufacturing ... 15
3.2 Preparation before laboratory tests ... 17
3.3 Testing the packages with Lloyd tensile tester and Biotac ... 20
3.4 Climate... 21
3.5 Data processing... 22
3.5.1 Synchronizing Nexygen with Syntouch Biotac in Excel ... 23
3.6 Data analysis ... 24
3.7 Methodology to gain quality of results ... 26
4 RESULTS ... 27
4.1 Results for material 290 g/m2 geometry 78x50x110 ... 27
4.2 Results for material 315 g/m2 geometry 78x50x110 ... 28
4.3 Results for material 340 g/m2 geometry 78x50x110 ... 29
4.4 Results for material 290 g/m2 geometry 98x98x280 ... 31
4.5 Comparison between material properties ... 33
4.6 Comparison between the two geometries ... 36
5 DISCUSSIONS ... 39
5.1 Potential sources of error ... 39
5.1.1 Package placement on the matrices ... 39
5.1.2 Climate ... 39
5.1.3 Lloyd LR5K Tensile Tester ... 39
5.1.4 Micro deformation ... 40
5.2 Evaluation of results ... 40
5.2.1 Behavior of the points located in row A and B ... 40
5.2.2 Comparison between the two geometries ... 41
5.2.3 Comparison between different material properties ... 41
5.2.4 The average stiffness recorded by Lloyd LR5K ... 41
5.3 Future work... 42
7 REFERENCES ... 44 APPINDICES
A: Graphs for material 290 g/m2 geometry 78-A points
B: Graphs for material 290 g/m2 geometry 78-B points
C: Graphs for material 315 g/m2 geometry 78-A points
D: Graphs for material 315 g/m2 geometry 78-B points
E: Graphs for material 340 g/m2 geometry 78-A points
F: Graphs for material 340 g/m2 geometry 78-B points
G: Graphs for material 290 g/m2 geometry 98-A points
H: Graphs for material 290 g/m2 geometry 98-B points
I: Graphs for Comparison between materials – point 1A J: Graphs for Comparison between materials – point 1B K: Graphs for Comparison between materials – point 3A L: Graphs for Comparison between materials – point 3B M: Graphs for Comparison between materials – point 5A N: Graphs for Comparison between materials – point 5B O: Graphs for Comparison between geometry – point 1A P: Graphs for Comparison between geometry – point 1B
Q: Graphs for Comparison between geometry – point 3A_G78 & 5A_G98 R: Graphs for Comparison between geometry – point 3B_G78 & 5B_G98 S: Graphs for Comparison between geometry – point 5A_G78 & 9A_G98 T: Graphs for Comparison between geometry – point 5B_G78 & 9B_G98
1
Introduction
In this section the project and its purpose are explained. It is also followed by the delimitations made on the project.
To conduct this thesis properly it is necessary to understand the purpose of this thesis and to delineate the work so that the problem can easily be defined. This will follow in section 1.1. 1.1 The project
The thesis is a part of a research project called “A new model for deformation of carton board packages by manual handling”, led by associate professor Christer Korin. The purpose of the research project is to better understand what happens mechanically in carton board packages when consumers grab them or move them. The purpose of this thesis is to examine the
measured grip stiffness of carton board packaging with different material properties and geometries using a machine-based method rather than a human based method, to evaluate the machine-based method and if possible to verify its objectiveness.
There are different manufacturing methods used today which affects the grip stiffness of a carton board package. Crease geometry [1] is one of the factors that affect the stiffness of a carton board package. This thesis focuses mainly on examining cartonboards with different geometries and material properties, therefore the thesis is limited to one single manufacturing method and creasing geometry for all packages.
In this research, packages with two different geometries and three different material properties were examined. The examined packages where tested at Örebro University laboratory using a tensile tester, model Lloyd LR5k [2] and Syntouch Biotac tactile sensor. [3].
In the following section a background to the problem is addressed. The problem is first explained in section 2.1 and then it is followed by section 2.2 addressing the current work done by companies to solve the problem. In sections 2.3 previous work done to solve part of the problem is addressed and it is followed by section 2.4 which addresses the technical field of this thesis. After addressing the background to the problem in section 2, the theory needed to understand how to solve the problem and the knowledge needed to conduct the study will be addressed in section 2.5. Section 2 is then followed by section 3 which addresses the methods used to perform this study. After addressing the methodology, the results of the study will be presented in section 4. Section 4 is then followed by section 5 in which the authors discuss the results and if there could be any potential sources of error. Lastly in section 6 the conclusions achieved through this study are addressed.
2
Background
In this section the problem is first addressed. The problem and its importance are explained in detail. The problem is then followed by section 2.2 and 2.3 in which the current work done by companies and the studies done in the same field are presented. In section 2.4 the knowledge needed to conduct this thesis are addressed. In section 2.5 the theory gathered to conduct this thesis is presented.
To easily fulfill the purpose of this thesis and to achieve a better understanding of the purpose and why it is important, it is necessary to address the actual problem of measuring grip stiffness, how manufacturers have tried to solve this problem and how far the research in this field have come.
2.1 The problem of measuring grip stiffness
Under a long period of time packages have been used by people to store and protect their goods. Because of today’s increasing demand from consumers and industries to integrate information and marketing into packages, the function of packages evolved to also provide essential information about the product [4]. Additionally, packages should also have a good overall quality in terms of grip stiffness and packaging design. The overall quality of the package as perceived by the consumer reflects the quality of the product inside. Thus, manufacturing packages which possesses good overall quality is essential for venders, as the package acts as a “silent seller” [4], [5]. In fact, Studies has shown that consumers are willing to pay more for a good quality package, instead of paying less for a package of less quality even if the content is the same [6].
Carton board packages have a very important property, namely grip stiffness [4]. When consumers grab a carton board package for instance a milk package at a store and perceive it as slack, it is then very likely that the consumer will exchange the package for a stiffer package. The perceived quality of the package gave the consumer a negative view on the product inside although the product inside where not observed [7]. On top of that, low perceived grip stiffness also leads to food waste since a package perceived as slack is very likely to be left out and then wasted [7]. The waste of food has serious environmental impact especially on climate, land, biodiversity and water [8]. And afar from its environmental impact, food waste costs food producers (excluding fish producers) 750 billion dollars annually [8].
For such an important property as grip stiffness, there is no universal and objective method used among packaging manufacturers to measure it with. This leads to difficulties in
predicting how a carton board packages would behave when handled manually by consumers. Therefore, using an objective method to measure the grip stiffness is very important.
This thesis focuses on examining an objective method for measuring the grip stiffness, since the current process used in the paper industry of focus group testing take exceeding time and is subjective [9]. The method will include the use of Syntouch Biotac described in section 3.1 to examine the grip stiffness.
The following points are investigated in this thesis:
- By using Syntouch Biotac examine the connection between different material properties and the measured grip stiffness.
- By Syntouch Biotac examine the connection between different geometries and the measured grip stiffness.
- By Syntouch Biotac examine if the measured grip stiffness changes depending on where a compression is applied on the packages.
2.2 Current work
Today, packaging manufacturers use human focus groups (“panels”) to study how different material properties and packaging geometries affects the grip stiffness [9]. These panels consist of several people trained to manually feel different carton board packages and thereby give a feedback on the perceived grip stiffness of the package. However, this method is not fully reliable because it takes exceeding time and is subjective [9] It is not possible for people to give quantifiable and objective data on the perceived quality of a package and therefore the perceived quality of a package will differ depending on the persons own experience. This testing method is also a time-consuming and costly method to conduct because the panels need to be trained and payed [9].
2.3 Previous work
In the research project “Damage to Carton Board Packages Subjected to Concentrated
Loads”, a study was conducted to investigate the damages developed in carton board
packages subjected to concentrated loads using a tensile tester. In the research it was concluded that stiffness was more dependent on the geometry of the packages than the strength of the material [10].
In the thesis “Distribution of Pressure on Carton Board Packages- An objective analysis”, Biotac was used to investigate if the material of the carton board package had an affected on the distribution of pressure after a deformation had occurred. The different materials of the packages tested showed the same behavior in terms of pressure distribution. However, the Biotac could still identify the strength of the materials tested, and thereby tell the different materials apart [11].
In the thesis “A Comparison Between Two Methods for the Measurement of Grip Stiffness of
Carton Board Packages”, two methods for the measurement of grip stiffness where compared
and examined. The first method included the use of a tensile tester to examine the stiffens of different carton board packages. The second method included the use of Biotac to examine the stiffness. The conclusions were that the tensile tester did not offer any consistent results at lower forces. However, the tensile tester was good at distinguishing the grammage of the packages at higher forces. The Biotac sensor, on the other hand, had the ability to distinguish the grammage of the packages at lower forces [12].
2.4 Technical field
To be able to understand how different material properties and geometries of carton board packages affects the grip stiffness of the packages, fundamental knowledge in material science is necessary. In addition, it is necessary to have additional knowledge of solid
mechanics and paper mechanics. This knowledge helped the authors to study, to develop and discuss the obtained results, and thereby reach essential conclusions. Computational
knowledge of numerical data program is also necessary to sort the large amount of data obtained from the tests.
2.5 Theory
In this study Syntouch Biotac was used to measure grip stiffness of cartonboard packages. Thus, to understand the results and to achieve essential conclusions it is necessary to understand the properties of the product (cartonboard) to be tested. It is also essential to understand the equipment (Syntouch Biotac) used to conduct the tests and also very important to understand the concept of grip stiffness. This will therfore be presented in this section.
2.5.1 Biotac
Syntouch Biotac is a tactile sensor with a wide range of functions found in human fingertips. The sensor is able to detect a wide range of sensory information that human fingertips can detect, such as temperature, force and vibration.
The sensor consists of a rigid core surrounded by an elastic skin made from a polymer material and filled with a
conductive liquid. The sensor also consists of a nail screwed on top of the skin to hold the skin and the rigid core
together, see figure1. This design provides the Biotac with an appearance very similar to a human fingertip [3]. The
different components and sensors of Syntouch Biotac are presented in figure 2.
To determine point of contact and pressure, Biotac uses 19 electrodes spread evenly across the Biotac surface to collect data. These electrodes are placed on the rigid core below (and not on) the polymeric skin. As pressure is applied to the polymeric skin, the fluid inside will move outwards. The place where the pressure is more concentrated will have less fluid than the place where the pressure is less concentrated. Hence the electrodes located in the area with
Figure 1 Close-up picture of Syntouch Biotac. [3]
less fluid will show lower impendence, whereas the electrodes located in the area with more fluid will show higher impedance. To measure vibrations that occur when the polymeric skin ridges slide over a surface, the Biotac sensor uses a hydro-acoustic pressure transducer placed inside the core. The Biotac also has a thermistor located in the tip which detects changes in temperature between the Biotac and the object that encounters it.
All this sensory information is registered by the Biotac with a frequency between 100-1000 recordings per second. This information enables the Biotac to determine, estimate and sense the following information [3].
- Differentiate objects by their texture.
- Differentiate objects by their thermal properties.
- Determine where pressure is applied on the “finger” of the Biotac (point of contact). - Differentiate between corners, edges and flat surfaces.
- Estimate the radius of an object.
- Detect slip between the surface of an object and the Biotac.
2.5.2 Paper products and their properties
Several factors affect the material properties of paper products and these will be presented in this section. Production procedures, relative humidity, temperature and construction of the layers in a paper product all influence the properties of paper products. Each factor will be andressed in a subsection.
2.5.2.1 Production procedures and their effect on the properties of paper.
Paper is nearly a two-dimensional sheet material, manufactured primarily from wood fibers. Paper with thicker sheets and a surface weight over 200 g/m2 is referred to as paperboard or
carton board. [4] [13] The manufacturing process of paperboard starts as a furnish containing about 0.16-1 % solid content and 99-99.84% liquid water is sprayed on a moving wire. To enhance a smooth spreading of the furnish, a small speed deference between the furnish jet and the wire is necessary. This small difference in speed causes more fibers to turn parallel to the machine direction, causing the anisotropy of fiber orientation [13].
The anisotropic fiber orientation gives the paper product anisotropic mechanical properties. Meaning that paperboard have different mechanical properties in different directions. A finished paperboard product can have a stiffness 2 to 300 times higher in machine-direction than in cross or thickness-direction. The different directions of a paperboard or a cartonboard are illustrated in the figure 3. The different directions are called machine-direction, thickness-direction and cross-thickness-direction and from now on will be abbreviated MD, ZD and CD. MD is the direction of the paper when it runs through the machine, ZD is the direction running alongside the z-axis and CD is the lateral direction [13].
Figure 3. Illustrating CD and MD of paperboard. [13]
Another factor that also affects the mechanical properties of paperboard products, is the type of pulp used to manufacture the paper. There are two manufacturing principles used for manufacturing paperboard, which are mechanical pulp and chemical pulp [13].
In the mechanical procedure in which wooden fibers are produced mechanically, the first procedure is to convert debarked logs into smaller wood chips, see box (3) in figure 4. The wood chips typically containing of 25%-30 % moisture are then squeezed between rotating discs. In the process heat and vapor is applied to soften the lignin so the fibers can be separated. [14] An additional mechanical procedure called beating or refining is used to increase flexibility of the fibers and to achieve a good bonding between them, see box (4) figure 4. This helps the final paper product to achieve sufficient load bearing capacity [13]. In the mechanical process a large amount of fibers is intentionally damaged and broken into smaller particles. The small particles contribute to a uniform structure on the final paper product and improve printability [13].
The wood fibers produced in the chemical procedure are separated using a chemical solution. To separate the fibers, wood chips are cooked in a chemical solution to dissolve 80-90% of the lignin and thereby allowing fibers to separate easily [14]. Because the mechanical
procedure is not used to separate the fibers, and instead a chemical solution is used, the fibers separated in the chemical process are left intact and undamaged. Consequently, longer fibers are obtained. Thus, the pulp obtained in the chemical process is generally stronger than the one obtained mechanically [13].
(1) Logs (2) De-barking (3) Chipping and washing (4) Beating/ Refining
Usually, carton board materials consist of one or more layers of either mechanical pulp or chemical pulp. Depending on the pulp used, each layer will have different mechanical
properties [15]. Consequently, layers are placed in different places depending on the required mechanical or material properties of the final product. This will be discussed furthermore in section 2.5.2.5.
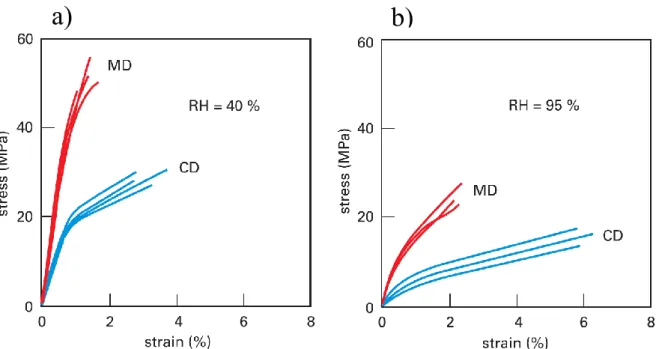
2.5.2.2 Effect of relative humidity and moister content on stress-strain behavior of paper
Besides the effect of different manufacturing procedures on the properties of paper products, moisture content (MC) [13] and relative humidity (RH) [13] also have an effect. For example, when paper is dipped in water, it is suddenly very easy to pull apart. This phenomenon
happens due to the increased moister content which softens the paper and reduces its elastic moduli. The paper softens because moister allows the fibers to easily come apart. When a certain level of moister is reached the elastic moduli riches zero[13]. The different stress-strain behavior of paper at different relative humidity is illustrated in figure 5.
It is clearly shown how the increase in relative humidity reduces the elastic moduli of the paper. The stress-strain strength difference between MD and CD mentioned previously in section 2.5.2.1 is also observable in figure 5.
Figure 5. Illustrating the behavior of paper at 40% RH in figure a) and 95% RH in figure b) and how MD is stronger than CD. [13]
2.5.2.3 Relative humidity
Relative humidity (RH), is the ratio between the amount of moisture present in the atmosphere at a given temperature relative to the amount of saturation present in a totally saturated atmosphere at the same temperature. Relative humidity ranges between 0 percent moister for totally dry air and 100 percent for a totally saturated air. This can be understood by Equation 1 below [16]:
𝑅. 𝐻. = 𝑎𝑐𝑡𝑢𝑎𝑙 𝑣𝑎𝑝𝑜𝑟 𝑑𝑒𝑛𝑠𝑖𝑡𝑦
𝑠𝑎𝑡𝑢𝑟𝑎𝑡𝑒𝑑 𝑣𝑎𝑝𝑜𝑟 𝑑𝑒𝑛𝑠𝑖𝑡𝑦 𝑥 100% (Equation 1)
2.5.2.4 Moisture content
Moisture content is the quantity of moisture in a material, which in our case is cartonboard or paperboard. Moisture content is determined by weighing the paper and then drying it for a specific number of hours. The paper is then reweighed, and the weight difference can be calculated as weight percentage. [17]
2.5.2.5 Multiple layer of fiber
Paperboard refers to paper exceeding a surface weight of 200 g/m2, containing a multiple
layer construction. The advantages of multiple layer construction are the ability to optimize fiber properties in different layers to achieve the desired properties of a paperboard. This is achieved by varying the type of wood fibers, type of pulp, and pulp treatment for each layer depending on the desired properties of the final product. Usually paperboard manufacturers prefer a high in plane stiffness and high modulus of elasticity for the outer layers. Thus, chemical pulp is used. Fibers produced by mechanical pulp are bulkier and therefore used as center layers. [15] This combination of stiffer and strong outer layers and bulkier center layers give paperboard an I-beam effect offering more rigidity per unit weight.
2.5.3 Grip stiffness
Grip stiffness is a term used amongst paperboard packaging industries [7], referring to the perceived robustness of a package when handled manually by a costumer. However, the term is not well defined since a specific measuring method is not specified [7]. Grip stiffness is a crucial factor for costumers when determining the perceived quality of a package and its content. In fact, studies shown that costumers are willing to pay more for a good quality package instead of paying less for a package of less quality even if the content is the same. [6] In many cases products of high value come in packages of high quality in terms of good grip stiffness and design, an example is mobile phones. Mobile phone packages are often robust and stiff enabling consumers to squeeze them without damaging them nor the product inside. Whatever is being measured by Syntouch Biotac will be referred to as measured grip stiffness when discussing the obtained results.
2.5.4 Carton board used in this research
The carton board used in this research is called BillerudKorsnäs White and is manufactured at BillerudKorsnäs in Frövi, Sweden. From this carton board product three different material properties (grammage) are used to test the accuracy of the testing method using Biotec, intending to verify or falsify the methods objectiveness.
White is a carton board which has a good combination of formability and printability. It is
manufactured out of 100% virgin wood fibers with a double clay coating layer on the top and a single clay coating layer on the reverse side. This type of cartonboard suits products that require good design, shape and graphics. It is mostly used for products such as; luxury beverages, exclusive confectionery, perfumes and medicine. [18]
The carton board white is manufactured out of virgin fibers and consists of four layers and two coatings. The first top layer is a clay coating to provide a whiter surface and excellent printability. The second top layer consists of TCF bleached fibers to improve smoothness and printability. The two middle layers are also manufactured from TCF bleached fibers but are
reinforced with a chemical pulp and CTMP to give the carton board good design ability, grip stiffness and consumer friendly characteristics. The final two layers consists of TCF blanched fibers and clay coating as the top two layers. [18] The amount of chemical and mechanical pulp of the cartonboard is presented in figure 6.
All the theory presented in this section will help to understand the achieved results and the discussions that revolve around the obtained results. The theory presented in this section will also be essential to achieve a reliable methodology. The methods used to conduct the tests are presented in section 3.
3
Method
The method used to conduct this study is divided into five subsections. Firstly cartonboard manufacturing is addressed then the preparations made before testing the cartonboard packages, followed by the actual testing of the carton bard packages, the large data obtained from testing and how it was processed and lastly how the obtained data would be analyzed.
To ensure that the test results are reliable and valid, it is necessary to document all the
methods used to conduct the tests. This will also help in finding any potential sources of error and if these would have any extensive effect on the results. This section will therefore address the methods used in this study.
3.1 Cartonboard manufacturing
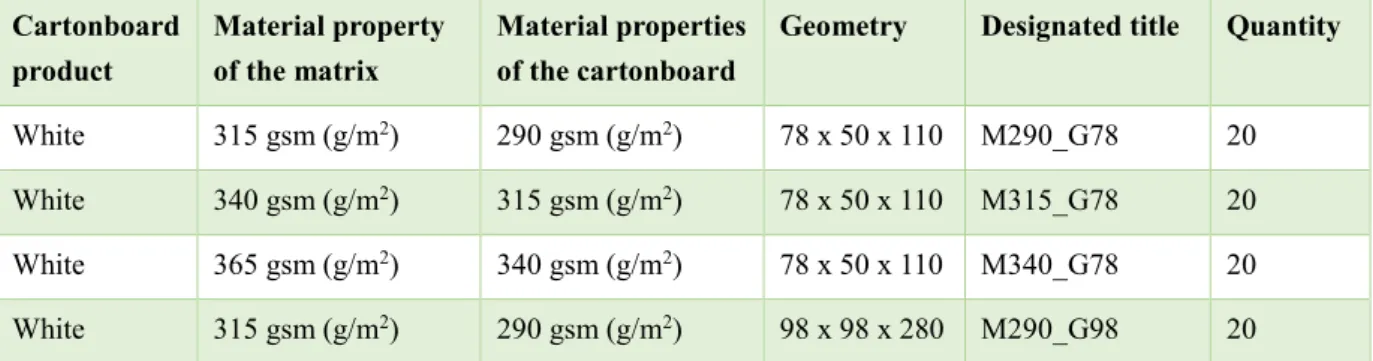
The Cartonboard packages used in this study were manufactured at BillerudKorsnäs located in Frövi. The manufactured packages had three different material properties (grammages) and two different geometries as described in table 1. The design and shape of the packages can also be seen in figure 9
All the packages were manufactured by a CAM-table to assure that all packages had the same creasing geometry and the same manufacturing conditions. CAM stands for computer aided manufacturing. The total amount of packages manufactured were 80 packages, 20 packages for each material property and geometry. However, 10 packages of each material property and geometry were tested in this study. Table 1 displays the different packages manufactured.
Tabell 1. Table displaying the different packages manufactured at BillerudKorsnäs, their material properties and their designated name. Cartonboard product Material property of the matrix Material properties of the cartonboard
Geometry Designated title Quantity
White 315 gsm (g/m2) 290 gsm (g/m2) 78 x 50 x 110 M290_G78 20 White 340 gsm (g/m2) 315 gsm (g/m2) 78 x 50 x 110 M315_G78 20 White 365 gsm (g/m2) 340 gsm (g/m2) 78 x 50 x 110 M340_G78 20 White 315 gsm (g/m2) 290 gsm (g/m2) 98 x 98 x 280 M290_G98 20
On the CAM-table, a sheet of cartonboard was placed to cut out a creasing matrix for each cartonboard material. The CAM-table Kongsberg Esko used to manufacture the packages is used for sample making and production of cartonboard in small quantities. The CAM-Table used in this thesis can be seen in figure 7. By using computer aided engineering, the CAM-Table cuts the shape of a preferred cartonboard blank and the shape of a preferred creasing geometry. The material property of the creasing matrix used for each cartonboard is shown in table 1. Another cartonboard sheet was then placed on top of the matrix, and a creasing wheel with a thickness of 7, 1-mm was then rolled on the cartonboard sheet, acting as a creasing rule. After the creasing process, the cartonboard blanks were cut out by the Cam-table, see figure 8. The cartonboard blanks were then folded manually and a double ended tape was added on the flaps, see figure 8. However, the cartonboard packages were not erected immediately and were instead erected four hours later.
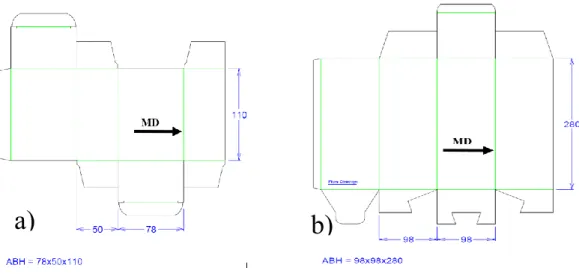
The cartonboard packages obtained after creasing, cutting, folding and taping the flaps had the following dimension; 78x50x110 and 98x98x280. The smaller package is a capsule package with an insert tab on top and bottom, as observed in figure 9 a). The bigger package on the other hand, had an envelope bottom and an insert tap on top illustrated in figure 9 b).
Figure 8. Folded blank cut out by the cam-table with a double ended tape on the flap.
Figure 9. The design of the two packages manufactured at BillerudKorsnäs and their corresponding MD direction. The smaller package in figure a) and the bigger package in figure b).
Figure 7. CAM-Table used for cutting and creasing the cartonboard blanks.
3.2 Preparation before laboratory tests
The cartonboard manufactured packages were taken to the laboratory at Örebro University to be erected. The erected packages were then placed in a cabinet for 72 hours to let them acclimatize to the climate at Örebro University were the testing would take place.
Acclimatization was essential since the elastic moduli of cartonboard is affected by relative humidity and moister content. [13] In the laboratory where the packages were held, a climate log was placed to document relative humidity and temperature prior to testing and under testing.
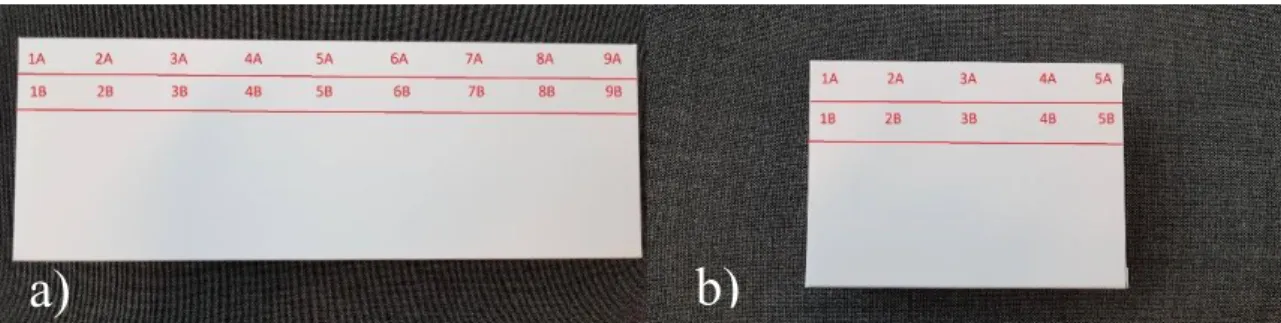
To understand how cartonboard packages behave depending on where on the package a load was applied by a consumer, several points on the cartonboard package were to be loaded by the Biotac. Allowing us to examine how the stiffness of a package changes depending on where the load was applied. Therefore, as the packages where acclimatizing the points where the Biotac would initiate contact were determined. For the smaller packages, two rows, A and B consisting of five load points each, would be loaded by the Biotac. As for the bigger
packages, two rows, A and B consisting of nine points each would be loaded by the Biotac. Figure 10 a) below illustrates the load points established for the bigger package and figure 10 b) illustrates the load points established for the smaller package.
The distance between every load point is 8 mm for the smaller packages, and 18 mm for the bigger packages. An 8-mm distance between every load point resulted in five load point in each row for the smaller package, which was considered to be moderate. This because, a longer distance between the load points would only give three load point, two in the corners and one in the middle of the package. Consequently, giving us insufficient information about how the stiffness changes depending on where the cartonboard was loaded. In addition, a shorter distance than 8-mm between the load points would result in overlaying load points. A distance of 8-mm for the bigger package was not chosen because it would lead to an
unnecessary number of tests without providing any additional information. Thus, a distance of 18 mm was chosen. The 18-mm distance between load points for the bigger package resulted in nine load points for each row, which was considered to provide sufficient data. The two packages were loaded 15 mm from the crease representing row A, and 30 mm from the crease representing row B. See figure 11.
Figur 10. Illustrating the loading points on the bigger package in a) and smaller package in b)
Figur 11. The 30mm distance given for row B in figure a) and the 15 mm distance given for row B in figure b)
Each point presented in figure 10 would be placed under the Biotac sensor attached to a tensile tester. The tensile tester would then apply pressure on each point with the Biotac. Therefore, a uniform and repeatable method for placing each point exactly under the Biotac was necessary to avoid variations between tests. Thus, tow templates for each cartonboard package were made. See figure 12.
The package was placed on the start line to compress or load the first point, then the package was moved to the second line to compress the second point continuing until point five or nine was compressed depending on the package tested. The package was then returned to the start point, i.e. point one, however it was placed on line B to test the second row.
After determining the points where compressive load would be applied, it was necessary to determine the depth of the compressive load i.e. extension needed to obtain the required data from the packages. The options were to either compress every point with a depth of 10 mm leading to plastic deformation, or to compress every point within the elastic limit without deforming the packages permanently. Because of the close distance between the points we needed to examine if a point were to be compressed with a depth of 10 mm leading to plastic deformation, would affect the stiffness result of the point after it. Thus, five tests were executed on the smaller packages, were all the five points in row A were compressed until deformation. These tests were then compared with tests executed on packages with exact same properties but were only one point was compressed until deformation for each package.
Figure 12. a) illustrating the template made for placing the bigger package under the Biotac and b) illustrating the template made for placing the smaller package under the Biotac in a correct and repetitive manner.
a)
b)
For instance, to examine if deformation in point 1A would affect the stiffness of point 2A, the stiffness value of 2A would be taken from the package were all point were compressed until deformation and then it would be compared with the stiffness value of 2A from the package were only 2A were compressed until deformation. Figure 13 below displays the test results.
From the test results above, it is evident that a point where one or more points were deformed before it, showed a lower stiffness value compared to the same point were the points before it were left intact. Therefore, to obtain the “unaffected” stiffness value for every point, the best option was to compress the packages within the elastic limit.
4500 5000 5500 6000 6500 AFFECTED UNAFFECTED
Point 3A
a)
4000 5000 6000 7000 8000 9000 10000 AFFECTED UNAFFECTEDPoint 5A
b)
Figure 11. a) box plot displaying the difference in stiffness at point 3A for a deformed versus a non-deformed package. B) illustrating the difference in stiffness at point 5A for a deformed and no deformed package.
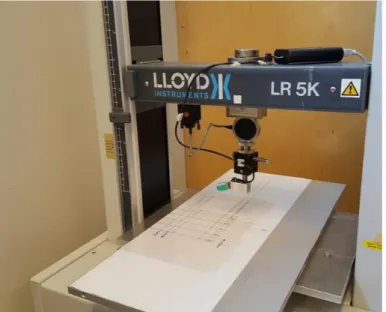
3.3 Testing the packages with Lloyd tensile tester and Biotac
Lloyd LR5K tensile tester and Syntouch Biotac described in section 2.5.1 was used to conduct the stiffness measurements of the packages. See figure 14. The tensile tester allowed a
maximum load of 500 Newton with an accuracy below 0.5 %.
Figure 14. Tensile tester Lloyd LR5K with Syntouch Biotac.
The different packages were divided into four groups, each group consisting ten packages. The groups were named according to their material property and geometry. Folders given the same designation were made to save the corresponding data from each test. The Designated name for each group is shown in table 1.
To compress the packages within the elastic limit, the tensile tester was lowered 6mm into all packages. Any extension above 6mm into the package would result in a risk of plastic
deformation. At first a zero level from which the Biotac would start the test from was defined. This was done by lowering the Biotac into the package until the tensile tester started to
measure a reaction force of 0.02 Newton. The tensile tester was at that point tarred and then the Biotac was raised 1 mm above the package. The compression test was initiated by starting the data recording of Syntouch Biotac. Within a second the tensile tester was ordered to initiate compression of the package. When Syntouch Biotac had reached its maximum depth of 6 mm into the package, it was automatically elevated by the tensile tester to its zero level. The data recording of Syntouch Biotac was then stopped manually by the user. However, unlike Syntouch Biotac, the tensile tester started and finished data recording automatically. The tested package was then moved according to the matrix below it to compress the next point.
After compressing one load point its corresponding data files collected from Nexygen and Syntouch Biotac were named according to the designated name of the point, see figure 10, and according to the package’s material property and geometry. The files were then saved in a common file.
3.4 Climate
A climate-controlled laboratory was not available at Örebro University. Therefore, a climate log was placed to document the climate prior to testing and under testing. The climate was logged by a climate logger every five minutes. Figure 15 below demonstrates when erecting, acclimatizing and testing took place. On April 17th the packages were erected and then left in
a cabinet at the laboratory to acclimatize for 72 hours.Tests were conducted on April 27th,
May 2, May 3 and May 4th. Under the manufacturing process the packages were cut, creased
and folded in a climate-controlled room.
3.5 Data processing
Nexygen, a program used for materials testing with Lloyd LR5K was used to collect data from the tests. Nexygen registered the load applied to the package in newton and the extension in millimeters. A force-displacement curve was automatically plotted by the program and the greatest slope of the curve was calculated. The greatest slope of the curve represented the stiffness measured by the tensile tester. See figure 16. Load, time and extension data registered by Nexygen were exported as a txt-file and processed in Excel.
Figure 16. Illustrates force-extension curve and its greatest slope plotted by Nexygen
From the data recorded by Syntouch Biotac, the total fluid pressure (Pdc), and the impedance of electrodes 7,8,9,10 and 17 marked in figure 17 were exported to Excel. The reason for choosing these electrodes was because they had constant contact with the package, providing information under the entire process unlike the other electrodes. The data from the electrodes were used for plotting impedance against extension.
The load and time data from Nexygen and the Pdc from
Syntouch Biotac were used to synchronize the time of Syntouch Biotac with Nexygen. This is discussed furthermore in section 3.5.1.
Figure 17. Shows the chosen electrodes and their location on the Biotac
3.5.1 Synchronizing Nexygen with Syntouch Biotac in Excel
Ten packages having the same material property and geometry were tested by compressing each of the previously selected points shown in figure 10. As a result, each point provided ten data files from which the impedance against time of the chosen electrodes was taken. From the ten data files obtained, impedance against extension of each electrode was plotted as an average. The data recording by Syntouch Biotac was started and ended manually making all the recorded data differ in time. Thus, to plot the average, it was necessary to Synchronize the recording time of Syntouch Biotac with Nexygen to ensure that all the data used for plotting the average had the exact same time span. The actual compressing process took 12 seconds, as Lloyd LR5K compressed the Biotac 6 mm into the package and elevated it 6 mm, back to the starting point with a speed of 1 mm/s. This was also the total time in which Nexygen recorded data. However, all data recorded by Syntouch Biotac was recorded under a longer period. Therefore, the unnecessary data recorded was cut, making all the recorded data have a duration of 12 seconds.
Excel was ordered to find the time at which the total fluid pressure (Pdc) showed a maximum value. Then it was ordered to preserve all data recorded six seconds before and after that time, and to discard any additional data beyond the preserved data. The time at which Pdc showed a maximum value was used as a reference to also synchronize the electrodes 7, 8,9,10 and 17, exactly the same way as Pdc was synchronized. The reason for choosing Pdc as reference was because it showed a maximum value exactly in the middle of the testing process. Meaning, the time at which a maximum value was given, was exactly register at the time in which the Lloyd LR5K had compressed the Biotac 6 mm into the package.
To ensure that the synchronization was performed correctly, a common graph was plotted by the data generated from both Biotac and Nexygen as shown in figure 18. The y- axis resembles the load in percent from 0% load to 100 % load or maximum load. This to unify the unit, because Nexygen as
mentioned previously recorded load in newton and the load recorded by Syntouch Biotac was recorded as total fluid pressure. -0.2 0 0.2 0.4 0.6 0.8 1 1.2 0 0.5 1 1.5 2 2.5 3 3.5 4 4.5 5 5.5 6 6.5 7 7.5 8 8.5 9 9.5 10 10.5 11 11.5
Synchronizing
Syntouch Biotac Lloyd LR5K
Figure 18. Synchronization in time between Syntouch Biotac and Nexygen. The figure illustrates a perfectly synchronized test.
After confirming that the data was synchronized, the impedance of the previously chosen electrodes was plotted against time for all of the ten packages tested. However, the time was written as extension but there was no need for conversion as the Lloyd LR5k compresses the packages with a speed of 1 mm/s, making 1 second in the graph equal 1 mm. See figure 19.
Figure 19. Impedance-extension curve of electrode 10 for the ten packages tested along with the average of all ten tests. The x-axis resembles extension in mm, going from 0-6mm and back again to 0mm.
3.6 Data analysis
The average impedance of each electrode obtained from the ten tests conducted on each point in each package, along with the average stiffness value obtained from Lloyd LR5k, were used to compare the behavior of the different points within the package, compare the behavior of different material properties and lastly compare the behavior of different geometries. From figure 20 and 21 below the average impedance is displayed. As mentioned in section 2.5.1 the impedance depends on the amount of liquid present between the skin and an
electrode. The electrodes were the liquid was pushed outwards showed low impedance. Thus, wen pressure by Syntouch Biotac is not applied, a high impedance value is recorded, as soon as pressure is applied by Syntouch Biotac the electrodes record a decrease in impedance. Hence, impedance does not start from a zero value, rather its starting point depends on the liquid present between the skin of Syntouch Biotac and the electrodes as mentioned in section 2.5.1. This resulted in graphs were each electrode started from different impedances, making it difficult to compare the behavior of the packages only by looking at the plotted graphs seen in figure 20 and 21. To make it easier and to compare the packages in a correct manner, the difference between the starting value and extreme value recorded by the electrodes were
0 500 1000 1500 2000 2500 3000 0 0.3 0.6 0.9 1.2 1.5 1.8 2.1 2.4 2.7 3 3.3 3.6 3.9 4.2 4.5 4.8 5.1 5.4 5.7 6 5.7 5.4 5.1 4.8 4.5 4.2 3.9 3.6 3.3 3 2.7 2.4 2.1 1.8 1.5 1.2 0.9 0.6 0.3 0
E10
M2_G1_ P1_3A M2_G1_ P2_3A M2_G1_ P3_3A M2_G1_ P4_3A
M2_G1_ P5_3A M2_G1_ P6_3A M2_G1_ P7_3A M2_G1_ P8_3A
calculated and used as comparison basis.
To compare the different material properties and examine if there is a connection between different material properties and the measured grip stiffness, the smaller packages were examined. This because the smaller packages were manufactured from different material properties as mentioned in section 3.1 in table 1. Points 1A and B, 3A and B and 5A and B in a package will be compared with their corresponding point from another package but with different material property. These points can be seen in figure 10 on the smaller package. A hypothesis was that points 2A and B and 4A and B would give results similar to point 3A and B, therefore these points will not be used in the comparison between materials. This hypothesis was assured during testing and the results can be seen in section 4.1-4.3. The three points chosen from the small package were also used to compare the two different geometries. The points’ corresponding points in the bigger package were points 1A and B, 5A and B and 9A and B, as they also are located two in each corner and one in the middle, see figure 10.
Figure 20 Illustrating the average impedance of ten tests for electrode 17. The starting value and the extreme value for impedance is also visible.
Figure 21 Illustrating the average impedance of ten tests for electrode 10. The starting value and the extreme value for impedance is also visible.
3.7 Methodology to gain quality of results
This degree project has a quantitative approach as evidenced by the fact that much of the work consisted of laboratory tests and data analysis. The thesis work also has a qualitative approach as interviews with the researchers involved in the research have been carried out. What is presented in Chapter 3 above, has to do with quality assurance. This means doing the right things (validity) and doing these things correctly (reliability). These are part of the scientific method. Validity refers to the extent to which the measured method really measures the variable or property intended to be measured [19].
The actions carried out by the authors to obtain and ensure high validity are as follows: - The purpose of the thesis work which was to examine the measured grip stiffness of
carton board packaging with different material properties and geometries using a machine/based method to verify its objectiveness has been constantly sought to be put into focus
- The data collected from Syntouch Biotac and Lloyd tensile tester has been discussed mutually between the authors and researchers in the field.
- A literature study in the research filed of carton board packaging has been carried out and discussed mutually between the authors and supervisor.
- Have tried to identify and understand the problem by discussing it with the researcher concerned at the Institute of Technology in Örebro University.
- Used triangulation by gathering information with different methods to find the most valid method
- Analyzed previous reports which discusses the sources of errors in the same
equipment (Syntouch Biotac connected to Lloyd tensile tester) and the method used and tried to avoid these.
Reliability refers to the consistency of the measurements. Meaning that the measurement is carried out in a reliable manner. [20]
The actions carried out by the authors to obtain and ensure high reliability are as follows: - Follow approved processes for carrying out laboratory tests.
- To facilitate replication, the authors tried to present the process in which the data was collected as clearly as possible.
- During the course of the project the authors continuously wrote down what has be done to ensure that such information would not be forgotten.
The methodology used by the authors can therefore be seen as valid and reliable and the test results presented in section 4 can therefore be seen as consistent.
4
Results
This section presents the results of the tested cartonboard packages. This section is divided in subsections for each material property and geometry. Firstly, the results for the small
cartonboard packages with three different material properties are presented, then the results for the bigger cartonboard package is presented. These are followed by results comparing the three material properties and the two geometries.
The results presented in this section are presented into subsections, each subsection for each material property and each geometry. The results are presented in tables in which the average difference between starting value and extreme value for the impedance of electrodes 7-10 and 17 are presented along with the average stiffness measured by the Lloyd LR5k tensile tester. 4.1 Results for material 290 g/m2 geometry 78x50x110
Tables 2 and 3 below display the average impedance difference between start value and extreme value for all five electrodes along with the average stiffness value. In table 2 the results of all points in row A are presented, and in table 3 the results of all points in row B are presented. The graphs from which the values below were obtained are found in Appendix A and B.
Average difference between starting value and extreme value for (M290_G78_RowA)
Point E07 E08 E09 E10 E17 Stiffness
Average (N/mm) 1A 506 755 658 1065 862 6126 2A 295 388 395 679 927 4854 3A 294 385 388 676 1000 4939 4A 298 387 389 681 1066 5494 5A 351 453 458 790 1225 6097
From table 2, the average impedance difference between start value and extreme value of electrodes 7,8,9 and 10 show a high value at point 1A relative to the other points. The points 2A, 3A and 4A show very close values relative to each other. And point 5A shows a value higher than points 2A, 3A and 4A, however its value is lower than point 1A. On the other hand, electrode 17 shows a higher value at point 5A relative to point 1A. In electrode 17 as well, values of points 2A, 3A, 4A are close relative to each other. The average stiffness registered by Lloyd also shows close stiffness values for points 2A, 3A and 4A. The stiffness values for point 1A and 5A are close relative to each other but have a higher stiffness value than points 2A, 3A and 4A.
Table 2. Displays the average impedance difference between start value and extreme value for all points in row A along with the average stiffness. The results are obtained from package material 290 and geometry 78x50x110mm.
Average difference between starting point and extreme point for (M290_G78_B)
Point E07 E08 E09 E10 E17 Stiffness
Average (N/mm) 1B 463 720 555 935 748 4773 2B 163 206 213 317 240 2210 3B 121 154 161 236 184 1720 4B 126 161 165 247 195 2351 5B 211 260 384 422 333 2031
All electrodes in table 3, show higher values for point 1B and 5B compared to points 2B-4B. It is also shown that point 1B have a higher value compared to point 5B. From the average stiffness it is also shown that point 1B have a higher value compared to point 5B. However, points 2B and 4B had higher stiffness values than point 5B.
4.2 Results for material 315 g/m2 geometry 78x50x110
Average difference between starting point and extreme point for (M315_G78_A)
Point E07 E08 E09 E10 E17 Stiffness
Average (N/mm) 1A 602 935 780 1293 1217 6385 2A 370 483 503 871 1431 4824 3A 381 484 517 886 1593 5072 4A 387 481 514 885 1745 4867 5A 414 524 535 930 1978 5876
Table 3. Displays the average impedance difference between start value and extreme value for all points in row B along with the average stiffness. The results are obtained from package material 290 and geometry 78x50x110mm.
Table 4. Displays the average impedance difference between start value and extreme value for all points in row A along with the average stiffness. The results are obtained from package material 315 and geometry 78x50x110mm.
Electrodes 7-10 in table 4 show very close values for points 4A. The values of points 2A-4A are the lowest values compared to the values of points 1A and 5A. Point 1A for electrodes 7-10 have a higher value that point 5A. The values of electrode 17 showed a rising value starting with a lower value for point 1A and ending with a higher value for point 5A. The average stiffness has the same behavior as electrodes 7-10.
Average difference between starting value and extreme value for (M315_G78_B)
Point E07 E08 E09 E10 E17 Stiffness
Average (N/mm) 1B 554 888 669 1132 1002 4812 2B 265 336 352 556 465 2994 3B 239 284 325 489 451 2266 4B 236 274 319 475 426 2272 5B 299 371 399 622 554 2706
In table 5 electrodes 7-17 registered the same behavior at all five points. It is shown that points 2B-4B have close values and that point 1B showed the highest value compared with points 2B-5B. The stiffness average of point 1B was the highest followed by the average stiffness of point 2B and 5B. The graphs from which the values were obtained are found in Appendix C and D.
4.3 Results for material 340 g/m2 geometry 78x50x110
Average difference between starting point and extreme point for (M340_G78_A)
Point E07 E08 E09 E10 E17 Stiffness
Average (N/mm) 1A 766 1244 1000 1670 1346 7754 2A 463 601 644 1091 1774 6534 3A 474 594 654 1097 2138 6907 4A 490 608 667 1112 2310 6980 5A 557 691 761 1248 2597 7387
Table 5. Displays the average impedance difference between start value and extreme value for all points in row B along with the average stiffness. The results are obtained from package material 315 and geometry 78x50x110mm.
Table 6. Displays the average impedance difference between start value and extreme value for all points in row A along with the average stiffness. The results are obtained from package material 340 and geometry 78x50x110mm.
Electrodes 7-10 in table 6 show close and low values for points 2A-4A and shows higher values for point 1A and 5A with the highest value for point 1A. Electrode 17, on the other hand, showed rising values starting with a lower value for point 1A and ending with the highest value for point 5A. The average stiffness showed a similar behavior to electrodes 7-10.
Average difference between starting point and extreme point for (M340_G78_B)
Point E07 E08 E09 E10 E17 Stiffness
Average (N/mm) 1B 747 1217 889 1533 1464 5683 2B 396 498 525 838 718 3818 3B 364 438 494 770 694 3093 4B 358 429 484 758 723 3469 5B 505 615 719 1105 1104 4408
Electrodes 7-10 and 17 in table 7, showed close values for point 2B-3B, and showed higher values for points 1B and 5B. However, point 1B had a higher value compared to point 5B. The average stiffness showed the same behavior as electrodes 7-10 and 17 did. The graphs from which the values were obtained are found in Appendix E and F.
Table 7. Displays the average impedance difference between start value and extreme value for all points in row B along with the average stiffness. The results are obtained from package material 3340 and geometry 78x50x110mm.
4.4 Results for material 290 g/m2 geometry 98x98x280
Average difference between starting point and extreme point for (M290_G98_A)
Point E07 E08 E09 E10 E17 Stiffness
Average (N/mm) 1A 581 565 686 1175 1147 6952 2A 328 406 404 694 1031 4369 3A 302 369 368 638 1032 3578 4A 288 352 351 608 984 3958 5A 272 336 333 582 916 4917 6A 257 320 314 549 818 4099 7A 236 299 288 504 704 4126 8A 230 296 279 484 574 3755 9A 512 628 750 1017 721 6052
In table 8 it is shown that electrode 7-10 and 17 have a similar behavior. The electrodes show a high value for point 1A and then the value decreases for point 2A. From 2A-8A the value shows a decreasing trend and then increases at point 9A. The average stiffness shows high values at point 1A and 9A with the highest value at point 1A. From 1A-3A the average stiffness starts to decrease and then increases at point 4A and 5A, then it starts to decrease at point 6A-8A relative to point 4A and 5A.
Table 8. Displays the average impedance difference between start value and extreme value for all points in row A along with the average stiffness. The results are obtained from package material 290 and geometry 98x98x290mm.
Average difference between starting point and Extreme point for (M290_G98_B)
Point E07 E08 E09 E10 E17 Stiffness
Average (N/mm) 1B 489 752 563 977 843 4556 2B 191 228 223 344 271 1814 3B 143 167 160 243 193 1911 4B 120 141 132 199 155 1354 5B 107 128 118 178 136 1264 6B 114 140 128 202 205 1556 7B 87 108 94 141 101 1611 8B 99 123 106 160 110 1916 9B 459 540 687 900 694 4571
Table 9 show that the highest stiffness values are at point 1B and 9B, the lowest stiffness value at point 5B. This behavior was also registered by the electrodes 7-10 and 17. Then an increasing trend from point 5B-9B is also observable. However, this trend was not picked up by the electrodes. The graphs from which the values were obtained are found in Appendix G and H.
Table 9. Displays the average impedance difference between start value and extreme value for all points in row B along with the average stiffness. The results are obtained from package material 290 and geometry 98x98x290.
4.5 Comparison between material properties
In this section tables will be used to display the difference between material properties. Each table in this section includes the average impedance difference between the impedance starting value and extreme value registered by electrodes 7-10 and 17 at point 1A&B, 3A&B and 5A&B, for each material property. Along with the average impedance difference, the average stiffness values of each material property are also presented.
Average difference between starting point and extreme point for (1A)
Material E07 E08 E09 E10 E17 Stiffness
Average (N/mm)
M1 (290 g/m2) 506 755 658 1065 862 6126
M2 (315 g/m2) 602 935 780 1293 1217 6385
M3 (340 g/m2) 766 1244 1000 1670 1346 7754
It is clearly evident from table 10 above that average stiffness at point 1A, increases as the grammage of the cartonboard is increased. The same behavior is also registered by electrodes 7,8,9,10 and 17 of Syntouch Biotac. The values between material 290 and 315 increases with little margin. However, the values between material 315 and 340 increase with bigger margin.
Difference between starting point and extreme point for (1B) average
Material E07 E08 E09 E10 E17 Stiffness
Average (N/mm)
M1 (290 g/m2) 463 720 555 935 748 4773
M2 (315 g/m2) 554 888 669 1132 1002 4812
M3 (340 g/m2) 747 1217 889 1533 1464 5683
Table 10. Displays the average impedance difference between start value and extreme value for point 1A along with the average stiffness. The results are obtained from package material 290, 315, 340 and geometry 78x50x110mm.
Table 11. Displays the average impedance difference between start value and extreme value for point 1B along with the average stiffness. The results are obtained from package material 290, 315 and 340 and geometry 78x50x110mm.
Table 11 shows that even at point 1B the average stiffness and impedance of electrodes 7-10 and 17, increases as the grammage of the cartonboard is increased. As the previous table, the increase of stiffness and impedance values between material 290 and 315 are little. However, the values of material 315 and 340 increase with a bigger margin. The graphs from which the values were obtained are found in Appendix I and J.
Difference between starting point and extreme point for (3A) Average
Material E07 E08 E09 E10 E17 Stiffness
Average (N/mm)
M1 (290 g/m2) 294 385 388 676 1000 4939
M2 (315 g/m2) 381 484 517 886 1593 5072
M3 (340 g/m2) 474 594 654 1097 2138 6907
The results od point 3A in table 12 displays the same behavior seen in previous tables. This behavior is the same for point 3B, 5A and 5B in table 13, 14 and 15. The graphs from which the values were obtained are found in Appendix K, L, M and N.
Difference between starting point and extreme point for (3B) Average
Material E07 E08 E09 E10 E17 Stiffness
Average (N/mm)
M1 (290 g/m2) 121 154 161 236 184 1720
M2 (315 g/m2) 239 284 325 489 451 2266
M3 (340 g/m2) 364 438 494 770 694 3093
Table 12. Displays the average impedance difference between start value and extreme value for point 3A along with the average stiffness. The results are obtained from package material 290, 315 and 340 and geometry 78x50x110mm.
Table 13. Displays the average impedance difference between start value and extreme value for point 3B along with the average stiffness. The results are obtained from package material 290, 315 and 340 and geometry 78x50x110mm.
Difference between starting point and Extreme point for (5A) Average
Material E07 E08 E09 E10 E17 Stiffness
Average (N/mm)
M1 (290 g/m2) 351 453 458 790 1225 6097
M2 (315 g/m2) 414 524 535 930 1978 6102
M3 (340 g/m2) 557 691 761 1248 2597 7387
Difference between starting point and Extreme point for (5B) Average
Material E07 E08 E09 E10 E17 Stiffness
Average (N/mm)
M1 (290 g/m2) 211 260 384 422 333 2031
M2 (315 g/m2) 299 371 399 622 554 2706
M3 (340 g/m2) 505 615 719 1105 1104 4408
Table 14. Displays the average impedance difference between start value and extreme value for point 5A along with the average stiffness. The results are obtained from package material 290, 315 and 340 and geometry 78x50x110mm.
Table 15. Displays the average impedance difference between start value and extreme value for point 5B along with the average stiffness. The results are obtained from package material 290, 315 and 340 and geometry 78x50x110mm.
4.6 Comparison between the two geometries
In this section tables will be used to display the difference between package geometry. Each table in this section includes the average impedance difference between the impedance starting value and extreme value registered by electrodes 7-10 and 17 at points 1,3 and 5 for the small package and points 1,5 and 9 for the bigger package. Along with the average impedance difference, the average stiffness values of each material property are also presented.
Difference between starting point and extreme point for (1A) Average
Geometry E07 E08 E09 E10 E17 Stiffness
Average (N/mm)
G78 506 755 658 1065 862 6126
G98 581 565 686 1175 1147 6952
Table 16 show that the smaller package has lower stiffness and impedance values at point 1A, compared to the bigger package. The impedance of electrode 8 is the only one displaying a lower value for the bigger package.
Difference between starting point and extreme point for (1B) Average
Geometri E07 E08 E09 E10 E17 Stiffness
Average (N/mm)
G78 463 720 555 935 748 4773
G98 489 752 563 977 843 4556
The stiffness and impedance values of the smaller and bigger package presented in table 17 for point 1B, are very close. The electrodes show a slightly higher impedance values for the bigger package. But stiffness shows the opposite.
Table 16. Displays the average impedance difference between start value and extreme value for point 1A along with the average stiffness. The results are obtained from package material 290 and geometry 78x50x110mm and 98x98x280
Table 17. Displays the average impedance difference between start value and extreme value for point 1B along with the average stiffness. The results are obtained from package material 290 and geometry 78x50x110mm and 98x98x280
Average difference between starting point and extreme point for (M290_G78_3A) AND (M290_G78_5A)
Geometry E07 E08 E09 E10 E17 Stiffness
Average (N/mm)
G78_3A 294 385 388 676 1000 4939
G98_5A 272 336 333 582 916 4917
rom table 18 above, it is evident that the smaller package shows slightly higher impedance and stiffness values for the middle point. However, the difference is very small.
Average difference between starting point and Extreme point for (M290_G78_3B) AND (M290_G98_5B)
Geometry E07 E08 E09 E10 E17 Stiffness
Average (N/mm)
G78_3B 121 154 161 236 184 1720
G98_5B 107 128 118 178 136 1264
The middle point in row B show higher stiffness and impedance values for the smaller package. This is shown for electrodes 7s, 8,9,10 and 17, and the average stiffness. See table 19.
Average difference between starting point and Extreme point for (M290_G78_5A) AND (M290_G98_9A)
Geometry E07 E08 E09 E10 E17 Stiffness
Average (N/mm)
G78_5A 351 453 458 790 1225 6097
G98_9A 512 628 750 1017 721 6052
In table 20 above, electrodes 7-10 show high impedance values for the smaller package compared with the bigger package. However, the stiffness value and the impedance of electrode 17 show higher values for the smaller package.
Table 18. Displays the average impedance difference between start value and extreme value for points 3A and 5A along with the average stiffness. The results are obtained from package material 290 and geometry 78x50x110mm and 98x98x280.
Table 19. Displays the average impedance difference between start value and extreme value for point 3B and 5B along with the average stiffness. The results are obtained from package material 290 and geometry 78x50x110mm and 98x98x280.
Table 20. Displays the average impedance difference between start value and extreme value for points 5A and 9A along with the average stiffness. The results are obtained from package material 290 and geometry 78x50x110mm and 98x98x280.
![Figure 3. Illustrating CD and MD of paperboard. [13]](https://thumb-eu.123doks.com/thumbv2/5dokorg/4267466.94572/12.892.137.749.153.311/figure-illustrating-cd-and-md-paperboard.webp)