Institutionen för naturgeografi
och kvartärgeologi
Detection and analysis of
changes in desertification
in the Caspian Sea Region
Tahira Abbasova
Examensarbete avancerad nivå
Geografi, 30 hp
Master’s thesis
Preface
This Master’s thesis is Tahira Abbasova’s degree project in Geography at the Department of Physical Geography and Quaternary Geology, Stockholm University. The Master’s thesis comprises 30 HECs (one term of full-time studies).
Supervisor has been Ian Brown at the Department of Physical Geography and Quaternary Geology, Stockholm University. Examiner has been Ingrid Stjernquist at the Department of Physical Geography and Quaternary Geology, Stockholm University.
The author is responsible for the contents of this thesis.
Stockholm, 6 June 2010
Clas Hättestrand Director of studies
1
Abstract
The Caspian Region includes the Caspian Sea and five littoral states: Azerbaijan, Iran, Turkmenistan, Kazakhstan and Russian. 40% of the Caspian coastal zone is arid, 69% of this territory undergone desertification according to international reports. Among the reasons are soil erosion caused by water, wind and irrigation, the salinization of soil, intense bioresources usage, and soil pollution due to oil extraction and production. Desertification is a serious problem, at global, national and local scales. It is important to know what should be sustained or developed in order to protect land from desertification. The generalization of data over desertification processes in Caspian countries, studying the dynamics of this process in space and time could help facilitate measures to counter regional desertification.
To understand Caspian Region coastal desertification phenomenon, vegetation cover satellite images for the years 1982 – 2006 were investigated to give map vegetation changes over time. The Normalized Difference Vegetation Index (NDVI) data for this study was derived from the Global Inventory Modeling and Mapping Studies (GIMMS) dataset, with the spatial resolution of 8 km.
A coastal strip 160 km from the coast, divided by countries, was investigated. The analyses were focused on extent and severity of vegetation cover degradation, and possible causes such as landscape, land use history and culture, climatic changes and policies. The aim was to address questions related to desertification phenomenon, by focusing on Caspian Region time-series of vegetation cover data and investigation patterns of desertification in the region.
In this study evidence of land degradation in the Caspian Region countries was found to occur on local scales or sub-national scales rather than across the regional as a whole. Changes in vegetation cover revealed by AVHRR NDVI appeared to be reversible in character and were dependent on the climate conditions, and anthropogenic impact in approximately equal proportions.
Key words: Caspian Region, desertification, Normalized Difference Vegetation Index (NDVI), ENVI, ArcGIS
3
Detection and analysis of changes in desertification in the Caspian Sea Region
Table of Contents
Abstract ...1
Table of Contents ...3
1. Introduction...5
1.1 Background ...5
1.2 Geography and climate of the study area...6
1.3 Aim of the study ...8
2. Theory ...9
2.1 The concept of desertification...9
2.2 NDVI as an indicator of desertification ...12
3. Method...15
3.1 Source data...15
3.2 Visualization and Analysis...17
4. Results...21 4.1 Azerbaijan………...…21 4.2 Russia………....……26 4.3 Kazakhstan………....…28 4.5 Turkmenistan………....30 4.6 Iran………....32 4.7 Summary………...…34 5. Discussions ...34 6. Conclusion ...40 References...42
Appendix 1a-c: Monthly mean precipitation in mm/day, for the years 1982-2006...45
Appendix 2: Drought Index, Azerbaijan...47
Appendix 3: Clipping of the USSR atlas...48
Appendix 4: Vegetation classification maps...49
Appendix 5: Histograms, showing vegetation types distribution through 1982 – 2006... 56
Appendix 6: NDVI Standard deviation maps...57
Appendix 7: NDVI Standard deviation charts...64
5
Introduction
Background
Desertification is serious environmental and socio-economic problem encompassing huge territories at a global, and regional and local scale. The features of the process of desertification and its end result are devastating for the environments, economies and political stability of the countries they occur. The features include reductions of crop yields, perennial plant cover and rangeland’s biomass productivity, woody biomass, water shortages, water and air pollution, and other drawbacks, potentially leading to societal disruption (UNEP, 1992).
The Caspian Region includes five states surrounding the Caspian Sea: Azerbaijan, Russia, Kazakhstan, Turkmenistan and Iran. According to the Caspian Centre for Combating Desertification reports, more than 81% of the Caspian Sea coastal zone is subject to different types and degrees of desertification processes due to the rising sea level and intense human economic activities (Figure 1). Among the causes are water, wind and irrigation caused soil erosion, salinisation of soil, intensity of bioresources usage, and soil pollution due to oil extraction and production. The Caspian Sea level fluctuations are stated as the major cause, leading to soil erosion and wind desertification during the sea regression, and abrasion desertification at the time of increasing water level. Soil and vegetation cover is being heavily deteriorated as a result of exploitation of the oil on the Caspian coast. Overgrazing, failure of irrigation and drainage systems and excessive logging for constructions materials and for heating fuel are among the main causes of the Caspian coastal zone desertification processes (Caspian Regional Thematic Centre for Combating Desertification /CRTC, 2000).
According to CRTC (2000), 7 990 km2 of the Azerbaijan coastal vegetation cover is
undergoing heavy degradation under the influence of intensive economic activities such as timber felling and grazing over a long period of time. The areas prone to water erosion make up 2.890 km2, sufficient ground-water level raise up to 1-2 meters and concomitant salinisation character the irrigated lands of Kura-Araz and Samur-Divichi lowlands (CRTC, 2000). The
most widespread, type of desertification, covering area of 18 629 km2, in the Caspian coastal
zone of Kazakhstan is technogenic desertification, connected to the intensive development of natural resources such as areas with oil and gas extraction. The Iranian coast of the Caspian Sea has more favorable sub-humid climate. Nevertheless, 25.1 % of the area is reported to be affected by a heavy degree of desertification processes (CRTC, 2000). However, such figures for the Caspian Region were last updated using data from the end of 1990s. Moreover, areas of natural deserts were often included into consideration.
6
This study will assess the Caspian Region coastal desertification phenomenon, using vegetation cover satellite images for the years 1982 – 2006 in order to evaluate recent desertification. Normalized Difference Vegetation Index (NDVI) data, a measure of vegetation health and productivity, was used to map vegetation changes over time in the region. The coastal strip of 160 km from the coast was examined. It was divided by 5 littoral countries (Azerbaijan, Russia, Kazakhstan, Turkmenistan and Iran), for a better understanding the causes and patterns of vegetation change.
Figure1. Map of the severe desertification in the Caspian coastal zone, TDA (2002), downloaded from GRID.
Geography and climate of the study area
The study area covers the Caspian coastal zones of five littoral countries. In this study the coastal zone was defined as up to 160 km from the coastal line. The Caspian Sea is the biggest enclosed body of water on Earth. It is situated in between the South-Eastern Europe and Asian
continent, between latitudes 47.07° N and 36.33° N, and longitudes 45.43° E and 54.20° E. The
Sea is approximately 1,030 km long and ranges from 196 to 435 km width. Its surface level at the moment is around 26.5 m below global MSL. The coastal zone of the Caspian Region is also situated below sea level, with the exception of the Caucasus and Talish mountains, and mountain ranges of Iran (Figure2). The climate of the Region varies from arid and semi-arid in the east to sub-humid and humid in the south western coastal zone. The eastern coast zone of the Caspian Sea, where Turkmenistan and Kazakhstan are located has very low precipitation;
7
desert and semi-desert vegetation is typical for this half of the Caspian coast. The western coast is less arid because of the surrounding mountains (TDA, 2002). North-western part of the Caspian coast has semi-arid climate with precipitation between 200 and 400 mm/year. The land surface of the Dagestan Republic of Russian Federation characterized with natural steppe and semi-desert vegetation. General land-use practice in this region includes food crop and livestock production.
The eastern Caspian coast includes, from north to south, Astrakhan region of Russian, Atyrau and Magistau provinces of Kazakhstan, and Balkan region of Turkmenistan. Kazakhstan coastal provinces amount to 28 427.3 thousand ha or 10.4% of the country’s territory; the length of the Kazakhstan part of the Caspian shoreline is 2 320 km; the received precipitation varies from 200 to 140 mm/year north to south. The main land use is agricultural, followed by settlements, industry and infrastructure. Agricultural lands are mostly used as pastures. The vegetation of the Kazakhstan coastal region is considered desert-steppe, meadow-riparian and halophytic plants (CEP (d), 2000).
Turkmenistan coast has an arid climate with 70 – 210 mm/year average rainfall. Turkmenistan coastline is more than 1 200 km long, including the gulf of Karabogazgol. Industrial land use is significant, due to great reserves of hydrocarbons, the development of chemical refineries and natural resources extraction. The area lacks the fresh water, resulting in the poor development of agriculture. The landscape consists of sand dunes, semi-deserts and wormwood – brackish and wormwood - ephemeral vegetation. Sandy plains cover vast massifs of the Caspian coast including Chilmamedkum, Kumsebmesh, Meshedkum sands and western part of Karakum lowland sands. Drift sands consist of bare sands in combination with solonchaks, and occupy a considerable area in the central part of coastal zone – the Cheleken peninsula. Riparian-marshy complexes appear in Balkan bay, and south-east of North Cheleken bay (Caspian Environmental Organization, 2000).
The coastal zone of Iran is characterized by an arid to humid climate from the east to west part of the coast, with precipitation ranging from 200 to 2000 mm/year. The eastern Gholestan province is part of the sub-humid region, while the northern areas around Bendar-Turkmen belong to the inner-Asian arid climatic zone. Due to the variation in climate conditions, there are different cultivation types and crops in the Caspian zone of Iran. In Ardabil plain agriculture includes orchard and arable land. Non-irrigated cultivation is common to Ghilan and Centre of Caspian coastal area due to sufficient precipitation (CEP(c), 2000; TDA, 2002).
The Azerbaijan coast receives average precipitation of 100- 250 mm/year in the arid and semi-arid zones and up to 1000 mm/year in sub-humid and humid climate zones. Landscape is
8
characterized by wormwood-brackish and ephemeral plants, shrubs and steppes; and forests in humid areas. The humid Astara region of Azerbaijan extends from the eastern Mazandaran province in Iran. This coastal strip is characterized by well-developed deciduous forest and intensive agricultural land use. The Absheron peninsula experiences precipitation of 110 mm/year. Land use of this part of Azerbaijan is dominated by the exploitation of oil and gas deposits. Precipitation in Kura-Araz lowland is around 200-300 mm/year; the irrigated agriculture dominates in land use of this area (TDA, 2002; internet portal "Azerbaijan").
Figure 2. The Caspian Sea Region physical map, downloaded from GRID.
Aim of the study
Contemporary studies of the problem of desertification revealed discrepancies in the situational understanding and assessments of the phenomenon (Hellden and Tottrup, 2008; Reynolds and Stafford Smith 2002, cited in Hellden and Tottrup, 2008; Swearingen 2007). Disagreements arose with regard to the understanding of the concept, areas to be studied, extent of the lands under desertification, and validity of previous investigations. More analyses of the processes of land degradation will contribute the better understanding of these processes and as such facilitate better action planning.
Using a time-series of vegetation cover data of the Caspian Region, I will attempt to identify and investigate patterns of desertification in the region. I suppose to conclude how much of the area in the Caspian Region is under the processes of desertification, and infer the anthropogenic influences with reference to natural change from control data. My inferences will be made with regard to extent and reversibility of the processes of vegetation cover degradation over 25 years period of time.
9
Theory
The Concept of desertification
The term ‘desertification’ first emerged in 1949, when French scientist and forest expert, A. Aubreville, employed the term to describe the process of progressive occupation of African’s tropical and sub-tropical forests by savannas, characterized by drastic physical and chemical changes of the soils, severe soil erosion and dispersion of xeric plants, growing in dry conditions. Auberville defined anthropogenic factor as the main cause of these process, emphasizing the roles of fire and deforestation by inhabitants (Verstraete, 1986).
However, he was not the first whose attention was compelled to this environmental problem. As far as in 1910, Barber documented the evidences of severe droughts in Africa in the beginning of the 19th century. The devastating events such as Dust Bowl in the United States and expansion of the Sahara were described by Stebbing in 1935, Le Houerou in 1962, amongst others (Verstraete, 1986).
Nevertheless, the concept ‘desertification’ was popularized and defined as international problem in 1977, at the UN Conference on Desertification (UNCOD) in Nairobi. According to Grainger (1982), this conference was a direct response to the worldwide concern about the 1968-1973 drought in the African Sahel. The consequences of this event were deaths of about 100 000 to 250 000 people, according to UNCOD report (Grainger, 1982, p.39). The UN Food and Agriculture organization (FAO) estimated that 35% of the total cattle in Sahel died during 1972-1973. A decade earlier, increased precipitation allowed intensified cropping on marginal lands with the result that at the time of drought, soils were exhausted by cropping and grazing (Grainger, 1982, p.39-40).
Prior to the conference, investigations were conducted, providing the first attempt to synthesize knowledge and understanding of the environmental problem called ‘desertification’ (Verstraete, 1986).
In 1977, desertification was defined by UNCOD as ‘diminution or destruction of the biological potential of land, and can lead ultimately to desert-like conditions’ and as ‘an aspect of the widespread deterioration of ecosystems’ diminishing or destroying ‘the biological potential, i.e. plant and animal production, for multiple use purposes at a time when increased productivity is needed to support growing populations in quest of development’ (UNEP, 1992).
Desertification was recognized as a global environmental disaster. According to UNCOD data the area threatened by desertification within the world’s drylands (excluding hyper-arid deserts) was 3.97 billion hectares or 75.1 per cent of the total drylands (UNEP, 1992). An
10
assessment of the status and trends of desertification was undertaken by UNEP (1992) concluding that desertification had continued to spread and intensify despite efforts undertaken since 1977.
Based on this understanding of the process, a Plan of Action to Combat Desertification (PACD) was adopted (Grainger, 1982; UNEP, 1992). This document aimed to identify problem, and propose ways to combat desertification. Thereafter many countries have drawn up similar plans of action as a part of national development plans. According to the Glantz and Orlovsky (1983), the conference served to consolidate representatives of those countries, where desertification appeared to affect landscapes. For example, in the United States and other countries, this form of environmental degradation was taken into account by national policy-makers, and Plans of Action were adopted to assess this phenomenon in a national context (Sabadell et al., 1982, cited in Glantz & Orlovsky, 1983). Countries of the Caspian Region joined the Convention to combat desertification (Turkmenistan in 1996; Iran and Kazakhstan in 1997, Azerbaijan in 1998, and Russia in 2003). Iran, Kazakhstan and Turkmenistan adopted their latest National Action Plans (NAP) in 2004, 2005, and 2007 respectively, while Azerbaijan and Russia are in the process of preparation.
However, with the time, the first definition of UNCOD appeared to be insufficient for the operational implementation of the PACD recommendations and assessment of desertification. Weaknesses included an inability to distinguish desertification from the cyclic oscillations, related to climate fluctuations (UNEP, 1992). A new definition was adopted in Nairobi in 1990,
at the Ad-Hoc Consultative Meeting on the Assessment of Desertification:
"Desertification/Land Degradation, in the context of assessment, is Land Degradation in Arid, Semi-arid and Dry Sub-humid Areas resulting from adverse human impact. Land in this concept includes soil and local water resources, land surface and vegetation or crops. Degradation implies reduction of resource potential by one or a combination of processes acting on the land. These processes include water erosion, wind erosion and sedimentation by those agents, long term reduction in the amount or diversity of natural vegetation, where relevant, and salinisation and sodication." (UNEP, 1992)
Following revision in 1991 a new definition was adopted in a response to the identification of anthropogenic climate change: "Desertification is land degradation in arid, semi-arid and dry
sub-humid areas resulting mainly from adverse human impact." It was noticed by Governing
Council of UNEP that further refinement of the concept to include influence of climate fluctuations and soil resilience may be undertaken under the additional detailed assessments (UNEP, 1992). And finally, at the ‘Earth summit’ in 1992, climatic factors were included in
11
definition of desertification: "land degradation in arid, semi-arid, and dry sub-humid areas resulting from various factors, including climatic variations and human activities", and this statement was adopted by CCD (Swearingen, 2007).
Since 1949, scientific communities and political authorities have established differing opinions about the ‘desertification’ concept, its causes and consequences. While one of the main opinions was that desertification is man-made degradation, other researches considered climate change as equally important factor. Grainger (1982, p.5-6) argued that while drought is a result of climate system, desertification is resulting from human actions. He believed that even though drought can trigger the process, and make its effects more severe for locals, climate changes are not responsible for the rapid degradation of land and loss of fertility, resulting in reduced economic productivity of cultivation or grazing. The link between human activities and desertification is generally supported by Food and Agriculture Organization of United Nations (FAO, 1993), considering ‘human activities as the main factor triggering desertification processes on vulnerable land’. The same time, FOA states that in certain cases the processes of desertification appear in the absence of anthropogenic factor, and could be explained by global climatic changes (FAO, 1993).
A further controversial aspect of the ‘desertification’ concept is either to consider as desertification changes in the amount of vegetation with respect to its economic value, or, alternatively changes in the density of any kind of vegetation, supporting sustainable soils’ conditions. According to Glantz and Orlovsky (1983), the desertification process embraces the resulting changes in vegetation: decline in harvest of the crop, or the invasion of new vegetative species, or a decrease of vegetation density. Another debate focuses on where the process of desertification can take place. Grainger (1982, p.8) state that desertification occurs in the arid (200-250 mm of rain per year) and semi-arid (250-600 mm) lands located near to deserts, but not in natural deserts themselves. While there are scientists, who consider desertification as intensification of desert-like areas (Mabbutt and Wilson, 1980, p.11, cited in Glantz and Orlovsky, 1983). Many researches add sub-humid regions to the areas with the high risk of desertification. Verstraete (1986) has quoted Le Hourou (1977) who defined desertification as a process occurring along the natural deserts’ borders, in the regions with 100 – 200 mm annual precipitation, with outside limits of 50 and 300 mm; Rapp (1974) who included arid and semi-arid regions receiving up to 600 mm precipitation annually.
The other disagreement was about the extent of desertification. According to United
Nations Environment Programme (UNEP, 1992) data of 1978, over 3 107 km2 were severely
12
UN "Earth Summit" Conference on Environment and Development in Rio de Janeiro, it was agreed to start negotiations on an international convention to address global desertification, as the problem of desertification was already regarded as one of the more globally pressuring. Convention to Combat Desertification (CCD) with the objective is to combat desertification and mitigate the effects of drought, was adopted in 1994 and became international law at the end of 1996 (Swearingen, 2007).
However, new technologies and more detailed information from research work put previous assertions to doubt. For example, according to Swearingen (2007) studies based on satellite image analysis do not confirm the permanent shift of the Sahara's southern boundary, rather shifts related to fluctuations in inter-annual rainfall. He argues that these findings prejudice the previous claims over the global extend of desertification, based more on informed opinion than field studies and remote sensing. In addition, much of the data was collected at the periods of droughts, and many studies has neglected the fact of existence of natural drylands and desert areas, which were accounted into commonly claimed lands of risk. This brings up the question if it is possible to distinguish temporary effects and permanent alterations of ecosystem. As far as back in 1983, Glantz and Orlovsky stated for a broader conceptualization of ‘desertification’ in order to improve amelioration efforts.
NDVI as an indicator of desertification
Satellite remote sensing images has begun been used for measuring and visualization density of the vegetation cover over the earth by scientists since 1980s. In order to monitor fluctuation in vegetation and their affect to environment, scientists have been collected images of the Earth surface, using NOAA’s Advanced Very High Resolution Radiometer (AVHRR). The ‘vegetation index’ is used to quantify the green vegetation richness over the globe on the basis of reflected by the land visible and near-infrared light intensity and wavelength measurements (Weier & Herring, 1999).
The Normalized Difference Vegetation Index (NDVI) is calculated from the reflectance data in the near-infrared and visible red parts of the electromagnetic spectrum. The following equation is utilized for obtaining NDVI:
NDVI = (NIR —RED) / (NIR + RED)
NIR is near-infrared radiation is reflected by healthy vegetation. Healthy vegetation absorbs most of the visible light that hits it, and reflects a large portion of the near-infrared light. Unhealthy or sparse vegetation reflects less near-infrared radiation (Weier & Herring, 1999). NDVI is therefore a measure of vegetation health and productivity, sensitive to
13
vegetation density and photosynthetic capacity. Pixels with high values of NDVI characterized with high proportion of green biomass, while absence of vegetation on the surface, as to water or bare soil do not show response, and stressed vegetation exhibit decline in NDVI magnitude (Liu, 2003).
NDVI value for a given pixel always presented as a number that ranges from minus one (-1) to plus one (+1). No green vegetation gives a value close to zero, while values close to +1 (0.8 - 0.9) indicate the highest possible density of green leaves. For more clear interpretation of vegetation cover, values below 0.1 correspond to barren areas of rock, sand, or snow; higher values between 0.2 to 0.3 indicate shrub and grassland; and temperate and tropical rainforests are presented by values between 0.6 to 0.8 (Weier & Herring, 1999) .
According to Hellden and Tottrup (2008), desertification process has final results of continuous and significant loss of vegetation cover and biomass productivity over the area of observation. Therefore, time-series changes in vegetation index could be considered as the main indicator of desertification. The Normalized Difference Vegetation Index (NDVI) is the dominant index applied for the large-scale studies of the desertification processes. Hellden and Tottrup (2008) trace NDVI method to be first suggested and applied for the accounting green biomass in 1970s, by Rouse et al. (1973) and Tucker (1979), and thereafter measured over time and annually integrated NDVI was used as a proxy for vegetation cover by many researches, such as Hielkema et al. (1987), Diallo et al. (1991), Rasmussen (1998a,b), Ricotta et al.(1999), Maselli and Rembold (2002) and others. Following the list of previous studies, including Dregne and Tucker (1988), Hellden and Eklund (1988), Tappan et al. (1992), Nicholson and Tucker (1998), Eklundh (1996, 1998), Runnstrom (2000), and Eklundh and Olsson (2003), that demonstrated NOAA Advanced Very High Resolution (AVHRR) based NDVI for time-series regional-scale analysis, Hellden and Tottrup (2008) utilized the NOAA AVHRR data for monitoring desertification on a regional–global level. Their study covered the Mediterranean basin, the Sahel from the Atlantic to the Red Sea, major parts of the drylands of Southern Africa, China–Mongolia and the drylands of South America. Their analysis were based on the GIMMS 8 km global NDVI data set, for the 1981 – 2003 period of time, annually integrated and compared with corresponding rainfall data. Analysis included only those parts of the study regions that had a long-term mean monthly NDVI value between 0.1 and 0.5. Hellden and Tottrup (2008) concluded that applied methodology appeared to be reliable and robust for monitoring and assessing vegetation changes and related desertification on a regional–global scale.
14
Elmzoughi et al. (2008) in their study on monitoring desertification in South Tunisia, argue that remote sensing data provide homogeneity and repetitively of the data, the quality that is difficult or even impossible to reach otherwise for monitoring and acknowledging the development and final state of desertification phenomenon. They advance the argument by pointing the fact that desertification in arid and semi-arid regions straightforwardly influence the vegetation growth, making the vegetation land coverage the most important indicator for the process detection and analysis. They quote the Milich and Weiss (2000a) that variation in the vegetation distribution represents one of the main indexes of desertification on all scales, and remote sensing data is of absolute importance for ability to detect these variations.
Yuanzhi Zhang et al., (2007) in their study were attempting to develop techniques for assessing and analyzing land desertification in Yulin of Northwest China. They support their arguments that integration of remote sensing with GIS techniques is becoming increasingly important with the references on Zhou 1989; Ehlers and Edwards 1989; Star et al. 1997.
Anyamba & Tucker (2005) in their paper about the Sahel seasonal and inter-annual land surface variability examination by vegetation index data, also use time-series satellite vegetation measurements from National Oceanic and Atmospheric Administration (NOAA) Advanced Very High Resolution Radiometer (AVHRR) aboard NOAA polar orbiting satellite series (NOAA-7, 9, 11, 14, 16). In their research, Anyamba & Tucker (2005) utilize time-series mean NDVI, accepting NDVI value less than 0.2 as indicator of the prevalence of drought conditions, and values from 0.2 to 0.5 as showing transition from dry to wet savanna.
Liu at al. (2003) utilized the coefficient of variation (COV) of the NDVI values as a stable measure of the vegetation growth cycle, to examine the approaches of macro-scale desertification monitoring based on the Pathfinder global 10-day composite 8 km AVHRR NDVI data in arid and semi-arid regions. Their decision to apply NDVI for their research was based on previously established notion that NDVI in arid and semi-arid regions is highly correlated with such biophysical parameters as biomass and vegetation cover. For example, Prince (1991) successfully employed AVHRR NDVI data to assess vegetation conditions in arid and semi-arid areas; Weiss et al. (2001) found the methodology of using COV of NDVI to assess changes successful, after testing it in their research of Saudi Arabia’s rangelands. Distinctive curve for the most of the vegetation in arid and semi-arid environments is showing higher values during the growing season, therefore coefficient of variation or standard deviation (STD) of NDVI values per individual pixel over the year will show higher values in vegetated areas rather than bare lands.
15
According to Symeonakis (2004), in the 1980s Food and Agriculture Organization (FAO) and the United Nations Environment Programme (UNEP) developed a Provisional Methodology for Assessment land desertification control with the list of previous studies (Carretero 1993; Hutchinson and Orr 1994), and Mapping of Desertification. Methodology consisted of 22 indicators, to monitor desertification at all special scales. This methodology was evaluated at regional scale by Grunblatt et al. (1992), in the Lake Baringo district in Kenya. After the work done to map all 22 indicators using field methods, they came to the concision that most of the proposed by UNEP indicators could only be used at the local scale. They reasoned this argument by the time-consuming and costly data collection at the regional scale, and referred to the remotely sensed data as most appropriative for assessing desertification over large areas. Therefore, Symeonakis (2004) summarizes in his study that time-series remote sensing observations provide cost-effective and applicable indicators for regional-scale assessment. Based on persuasion that vegetation cover and soil erosion are important indicators of desertification processes, Symeonakis (2004) tested these indicators in his study over sub-Saharan Africa for 1996 using Advanced Very High Resolution Radiometer (AVHRR) Normalized Difference Vegetation Index (NDVI) data extracted from a continental database generated by the National Aeronautics and Space Administration (NASA) Global Inventory Monitoring and Modeling Studies (GIMMS) group (Los et al. 1994; http://edcintl.cr.usgs.gov/ftp2/ndvi). And he concluded that this important indicator should be utilized for measuring the extent of desertification.
Method
Source data
The Normalized Difference Vegetation Index (NDVI) data for this study was derived from the Global Inventory Modeling and Mapping Studies (GIMMS) dataset. It is highly reliable NASA dataset, with the spatial resolution of 8 km (Tucker et al., 2005). NDVI data, covering all continents except Antarctica is available for a 25 years period spanning from 1982 to 2006, were obtained from the Advanced Very High Resolution Radiometer (AVHRR) instrument onboard the NOAA satellite series 7, 9, 11, 14, 16 and 17. This dataset that has been corrected for sensor inter-calibration differences and other effects related to vegetation change, such as: solar zenith angle and viewing angle effects, volcanic aerosols, missing data in the Northern Hemisphere during winter using interpolation, short-term atmospheric aerosol effects, atmospheric water vapor effects, and cloud cover (Tucker et al., 2005).
16
Satellite sensor data with scan angles < ±40 from nadir was improved through remapping to the output bin closest to the centre location of each 8 km equal area grid cell. Maximum
value NDVI was composed for a bimonthly time step, from first day of the month to the 15th
day, and from 16th day till the end of the month. (Tucker et al., 2005) Maximum value
compositing was used to simultaneously minimize atmospheric and directional reflectance
effects (Holben and Fraser 1984, cited in Tucker et al, 2005).Every image was then manually
checked for navigation accuracy and images with >±1 pixel navigation errors were investigated. The days with the navigation error were separately manually reprocessed, the NDVI data was calibrated and formed into maximum value composites. Cloud screening for the all continents, except Africa, was provided by a channel 5 thermal mask of 0°C (Tucker et al., 2005).
The quality of the AVHRR NDVI dataset was assessed in different ways through the time. One of the assessment methods to be mentioned was comparing the time-series NDVI values with desert objects, which were not used in NDVI calibration and normalization procedures, at different latitudes. The results showed that among different satellite periods, for all the investigated deserts, NDVI slopes are very close to zero (Tucker et al., 2005).
Some limitations of this database should be mentioned. At first, according to Tucker et al. (2005), due to the lack of consistent AVHRR water vapor records between 1981 and 2004, they were not able to correct atmospheric and directional reflectance explicitly. Limitations may also be found due to the coarse special resolution of 8 km (Defries et al., 2000, cited in Elmzoughi et al., 2008).
The precipitation data was derived from the Global Precipitation Climatology Project (GPCP) webpage. This project is an element of the Global Energy and Water Cycle Experiment (GEWEX) of the World Climate Research program (WCRP), established to provide time-series monthly mean precipitation data, beginning from the year 1979. This target was completed using rain gauge data from more than 6,000 stations merged with infrared and microwave
satellite estimates of precipitation (http://cics.umd.edu/~yin/GPCP/main.html).
Precipitation data from the Global Precipitation Climatology Project are presented as interactive maps and graphs (see Appendix 1). Due to the lack of precipitation dataset in a raster form, precipitation patterns will be explored visually. Therefore, certain level of approximation should be taken into account as limitation for this study.
A climatic indicator of desertification is the drought index. The Self-Calibrating Palmer Drought Severity Index was extracted for the Azerbaijan study area, in order to statistically correlate the vegetation and climate changes (Wells et al., 2004, Appendix 2). The Drought
17
Index was extracted from Grid cell with coordinates 49.25E and 40.25N, the cell size was 0.5°
x 0.5°. The Palmer Drought Severity Index is based on a water balance model, and was in use
since 1965 as a standard for measuring metrological drought, especially in USA. The classification of PDSI values has 11 categories from the extreme drought to extreme wet spell, with values 0.49 to –0.49 classified as normal conditions. The index calculates the difference between the volume of precipitation appropriate for the normal conditions and the amount of actual precipitation, taking into account regional and seasonal climatic differences. However, PDSI values were not suitable for all the diverse climatologic regions. Therefore it was improved by numerical methods replacing the averaged constants of the Palmer’s formula using local climate products. The self-calibrating index (SC-PDSI) has been created and tested, and confirmed to provide more accurate comparison of the index at different locations (Wells et al., 2004).
Visualization and Analysis
Visualization and analysis of the available data using image processing and analysis tools integrated with a Geographic Information System (GIS).
The first task for the visualization and analysis of the Normalized Difference Vegetation Index (NDVI) data obtained from the Global Inventory Modeling and Mapping Studies (GIMMS) dataset was the images processing. This task was conducted in ENVI software, best suited to process satellite images, where 600 NDVI sub-images were extracted for each of five Caspian region countries for the years 1982-2006 (24 images per year). Each image represented NDVI temporally l averaged over a 15-day period. ENVI software was utilized for creating 1 file per year that should comprise all 24 images. This task was achieved by applying the Layer Stacking tool that imported all 24 images per year into 1 output file, containing 24 bands. As a result of this process, 25 new files were created for each of the five countries.
For the generalization and reduction the complexity of the NDVI data, it was decided to calculate numerical summaries, the annual Mean and Standard Deviation (STD). The purpose of these statistics is to describe individual variables in numerical terms, to summarize the row data (Walford, 1995). The Mean is a measure that in the form of single number presents a summary description of a series of numbers; it is calculated as a sum of the numbers, divided by the number of numbers. However its weakness is in giving the same weight to all the values, which makes it predisposed to the influence of extreme values (Longley et al, 2005).
Standard deviation is the square root of the variance (the mean squared difference from the mean). Variance also measures dispersion, however it not very convenient measure for
18
descriptive purposes because variance measure is given in squared units, not in the same as units as originally variables were measured. STD overcomes this disadvantage by estimating squared root of variance. Dispersion measures are adopted to express the range of NDVI variation in highly seasonal environments (Liu et al., 2003). Standard deviation images were used to map vegetation decline under desertification (Liu et al., 2003). Hence, standard deviation statistics measure NDVI variation over time at every pixel, and therefore dynamics of the vegetation over time, as the main indicator of the scales of land cover deterioration processes (Tucker et al, 1991; Liu et al., 2003).
Imagery displaying the mean and STD of NDVI were produced using ENVI image processing software. 50 images for each of the five countries of the Caspian Region were created (NDVI mean and STD per year for the 25 year study period). These data were exported to ArcMap for further processing (Figure 3).
Figure3. Flowchart of the raw data processing in the ENVI software
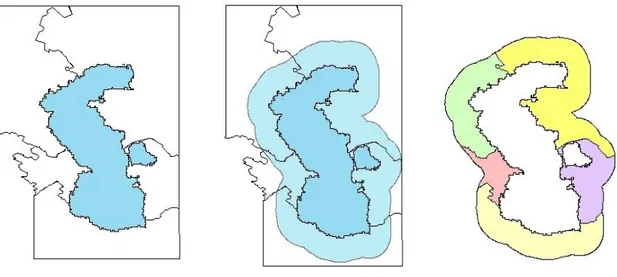
As it was stated at the introduction, the processes of desertification were supposed to be detected and analyzed at the Caspian Region, which was defined as 160 km stripe from the coast line. In order to produce this strip, the following steps were undertaken in ArcGIS software. At first, the Caspian Sea coast line was digitized from the one of original NDVI images in ArcMap. This resulted in a shapefile defining the water mask applied to all the data in the NDVI processing. The next step was to digitize political boundaries of all five countries to be investigated. As a result, 6 shape files were created in ArcCatalogue (Figure 4a). After this, a buffer of 160 km was created around the Caspian Sea, and then subdivided on 5 separate polygons, 1 file per country sharing region ≥ 160 km from the Caspian Sea for the following analysis (Figures 4b & 4c).
GIMMS dataset 24 images / year 25 years = 600 images Layer Stacking 24 layers 25 years 1 file/year with 24 bands 25 years = 25 files Statistics Mean/year and STD/year 25 years 25 Mean NDVI images 25 STD NDVI images
19
Figures 4a-4c. Coastline and political boundaries digitizing; Buffering of the coast line; Creation of 5 new polygons, sharing countries’ region ≥ 160 km from the Caspian Sea.
After five zones for investigation were defined as polygon layers in ArcMap, the new NDVI images were created by dividing Mean and STD layers by study polygons. This task was performed by Extract by Mask tool in ArcMap (Figure 5).
Figure 5. Flowchart of the procedures in ArcGIS
Defining a visualization and analysis system for the NDVI images in this study to analyze desertification was a primary task of this investigation. Guided by the previous research methods described in the Theory section (above), I will consider desertification process as the process of vegetation degradation, especially in arid and semi-arid areas, lasting for long periods that could not be fully explained by fluctuations in precipitation. From the NDVI point
NDVI images (worldwide) Caspian Region
political map
Digitize the Caspian Sea coastline Digitize 5 countries' boundaries 6 Shape files Buffering Tool 160 km from the coast Clip county/buffer intersect
1 new shape file per country = 5 shape files 25 Mean NDVI images 25 STD NDVI images Extract by Mask
1 file per country sharing region ≥ 160 km from the Caspian Sea (for the following Spatial Analysis in
20
of view, values less than 0,1 will be considered as desert, between 0,1 and 0,2 as semi-desert, areas with 0,2 – 0,3 values range will be considered as steppe, 0,3 – 0,4 as shrub and grassland, and finally pixels with more than 0,5 will be assumed having forest land cover. These definitions were based on the literature (cf. Anyamba & Tucker, 2005). An NDVI value less than 0.2 is therefore regarded as an indicator of the prevalence of drought conditions. Hellden and Tottrup (2008), classified regions that had a long-term mean monthly NDVI value between 0.1 and 0.5 as subject to desertification. Weier & Herring (1999) assumed NDVI values below 0.1 correspond to barren areas of rock or sand and values between 0.2 to 0.3 indicating shrub and grassland.
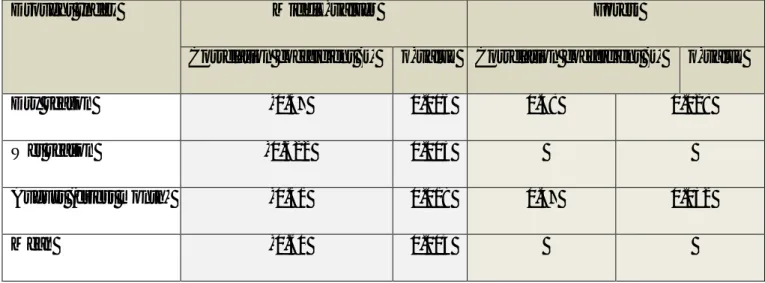
However, climate conditions between Eastern and Western coastal areas of the Caspian Sea differ as it was described (see Introduction, above). The East coast has lower precipitation, and arid to semi-arid climate, while the West coast climate types stretch from arid to sub-humid and humid in the south-western zone. Taking into account that vegetation cover characteristic features differ between littoral countries, it was decided to apply 2 different vegetation classifications for the NDVI mean value images (see Table 1). For classifying the vegetation types of the Caspian Region, the Vegetation map from the atlas of former USSR (Union of Soviet Socialist Republics) was investigated (see Appendix 3).
Table1. Land cover classification relatively to NDVI values
Azerbaijan, Russia, Iran Kazakhstan, Turkmenistan
NDVI value
Classification NDVI Value Classification
< 0.1 Desert < 0.07 Barren land
0.1 – 0.15 Wormwood-solonchak semi-desert 0.07 – 0.1 Desert
0.15 – 0.2 Ephemeral half-shrub semi-desert 0.1 – 0.15 Wormwood-solonchak semi-desert 0.2 – 0.3 Meadow steppe 0.15 – 0.2 Ephemeral half-shrub semi-desert 0.3 – 0.4 Shrub and grassland 0.2 – 0.3 Solonchak steppe
> 0.4 Forest > 0.3 Shrub and grassland
The mean yearly NDVI data was presented in raster form for visual analysis. After raster images of the mean NDVI were created for every year, and for each of five countries, data was classified in accordance with the Table 1. Vegetation cover was presented as areas with hue
21
symbolization, which means that colors were applied to discriminate between classes. The final maps were created to visualize the time-series changes in vegetation cover in the Caspian Region countries (Appendix 4).
For better analysis of the supposed desertification patterns in the Region, data was collated into Excel tables, with the classes organized as rows, and NDVI values as columns. Pixel
counts were converted into square kilometers, on the assumption of 64 km2 per pixel when
pixel resolution is 8 km2. Histograms were produced to compare the area distribution of each
vegetation class every year (Appendix 5).
For more clear visualization of changes in the Caspian Region countries’ vegetation cover, and therefore possible desertification processes detection, Standard deviation (STD) of NDVI values maps and pie charts were also created. Pixels with high STD values correspond to intensive vegetation cover, while pixels with low STD values should correspond to the areas with scarce vegetation. Difference between pixels natural grouping ranges of STD values is presented by saturated color symbolization, the darker color the higher STD value (Appendix 6). The circular pie charts show percentage of areas with different STD values range. Time-series presentation of STD in the form of pie-charts is used for detecting changes in vegetation cover over the period of time (Appendix 7 & 8).
Results
(for maps, tables and graphs, see Appendixes 1 - 8)
Azerbaijan
In the study area of Azerbaijan, the precipitation graphs show a reduction in precipitation of more than 50% over the period 1982-2006 (Appendix 1a). However there were several years, between 1986 and 1988, with better than average precipitation. The peak of mean monthly precipitation in these years was approximately 4.7 mm/day; in 1993-1994, when the maximum value was about 4.4 mm/day. Even though precipitation exhibited an approximately 6-year periodic patterns in Azerbaijan coastal area from 1982 to 1995, precipitation since appears to be in a steady decline.
The Drought Index for Azerbaijan supports the precipitation data with regard to the long period of drought conditions at the late years of the study period. According to Drought Index data, since the year 1997 the climate conditions in the study area are gradually worsening from incipient drought to extreme and severe drought in years 2000- 2002. The correlation statistical analyses were applied for revealing dependency of vegetation classes on the changing climate conditions represented in Drought Index. The land cover classes were correlated with the
22
annual mean of Drought Index variable by Spearman’s rank correlation analysis. The correlation coefficients (r) of - 0.56 and -0.54 for the desert and wormwood-solonchak semi-desert area respectively shows negative relationship between total area of this land cover classes and the drought index. The p-value in these cases shows high significance of correlation (Table 2). However, in Table 2 it could be noticed that results of the correlation analysis for the rest classes did not reveal relationship with drought index, with exception of the forest class slight correlation. The forest land cover class appear better correlation of r = 0.48 with the drought index during dry season from July to October, and r = 0.47 in August (the driest month) (see Table 3). The wet and dry seasons’ definition was based on the mean monthly drought index for 1901-2002. The wet season in Azerbaijan covers months from January to April.
Table 2. Land cover classes area (mean annual NDVI) vs. Annual mean of Drought Index
Land cover classes Correlation coefficient (r) p-value
Desert -0.56 0.008
Wormwood-solonchak semi-desert -0.54 0.011
Ephemeral half-shrub semi-desert -0.09 0.484
Meadow steppe 0.16 0.691
Shrub and grassland 0.06 0.78
Forest 0.39 0.077
The correlation analysis of the Drought Index with the ephemeral half-shrub and semi-desert class, meadow steppe and shrub and grassland class did not reveal correlation. However, this could be explained by imprecise land cover classification definitions due to the lack of field measures. Merging middle-value (semi-arid classes) of mean NDVI classes, which are ephemeral half-shrub semi-desert, meadow steppe and shrub and grassland classes, correlation analysis with the Drought Index return stronger correlation (Table 3). Therefore, it could be supposed that changes of middle-value land cover classes occur internally between these classes. Hence, classes’ boundaries that are difficult to define properly could be limitation for this study, causing problems with correlation analysis.
23
Table 3. Middle-value (mean NDVI) classes and Forest area correlation vs. Drought Index
Drought Index Middle-values Forest
Correlation coefficient (r) p-value Correlation coefficient (r) p-value
Dry season -0.57 0.006 0.48 0.028
Wet season -0.622 0.003
August (driest month) -0.51 0.019 0.47 0.032
Mean -0.60 0.004
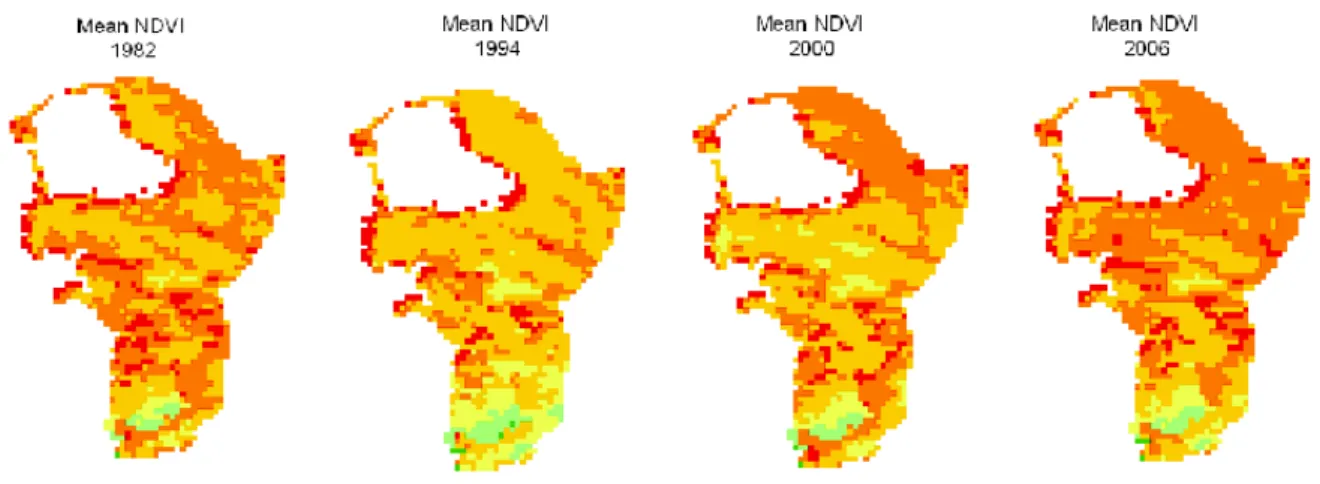
In Azerbaijan the mean of NDVI images, display a degradation of the vegetation in 2006, relative to the year 1982, mostly in Absheron, Aran and Shirvan plain areas. Areas mapped in green show high mean NDVI value, while areas in red show low NDVI values, and classified as deserts (Appendix 4). By comparing images of mean NDVI for 25 years, we can visually estimate changes in vegetation. The images of 1994 - 1995 show growth patterns in vegetation (Figure 6), and this could be explained by drastic rise break in the precipitation graph in years 1993-1994.
Figure 6. Vegetation changes in Azerbaijan (Mean NDVI)
The Azerbaijan mean NDVI histogram reveals more detailed information about changes in vegetation cover. The sizes of the territory per vegetation classes presented in histogram are found to be fluctuating over the study period of time. For the mean NDVI values that were classified as desert, the histogram shows the lowest mean NDVI values in 1987 – 1990 and 1994 – 1996 year periods, and highest values in 1986, 1998 and 2001. This might be negatively compared with the patterns in rainfall, though dates are not completely coincide, and rather show a lag. However, since 1996 to 2006, the desert vegetation cover was steadily increasing,
24
and up to 2006 desert was expanded on 70%, relatively to the year 1982 (Figure 7). This behavior is negatively correlated with the drought index, though correlation coefficient of 0.56 does not allow consider climate as fully causing the changes. Thus, other factors such as anthropogenic pressure should be considered.
Areas classified as semi-deserts also exhibit some negative correlation with precipitation trend. So, wormwood-solonchak type of semi-desert vegetation appears to increase up to 30% for the 25 years investigated, in spite of a decline in 1983 – 1986. Ephemeral and half-shrub semi-desert class bar graphs demonstrate quite stable condition over the 25 years period, with the exception of considerable drop in 1995.
Figure 7. Histogram of the ‘Desert’ land cover class area, Azerbaijan
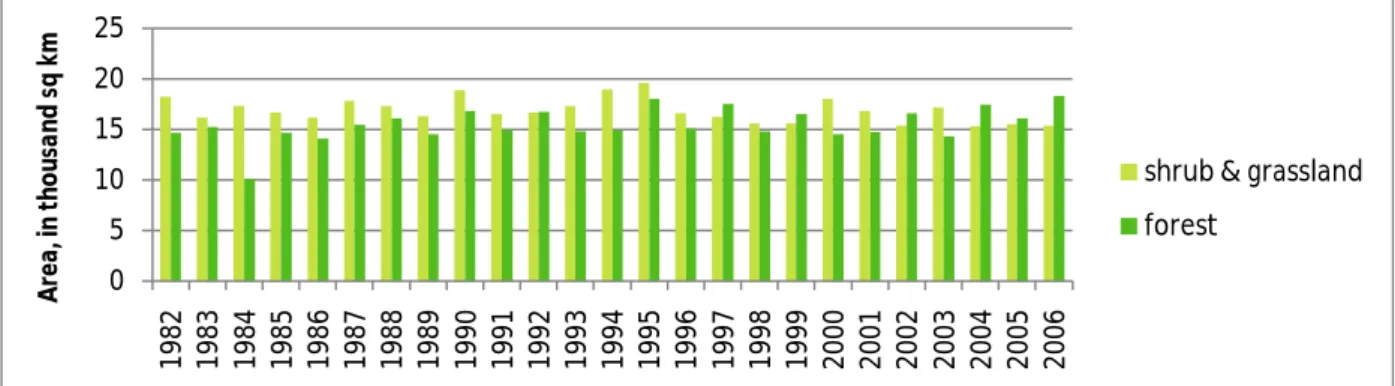
Bar graphs of the meadow steppe class shows fluctuation pattern till the year 1996 a peak year, and after the general pattern of decline, with the total decline of near 2.5 thousand square kilometers or 20% relative to 1982. This vegetation class exhibits comprehensive correspond with the rainfall trend, with the lag of about year. Areas, covered with shrubs and grassland, have shrunk during the study period by 14%. The last peak of this class area coverage was observed in 1995. Nevertheless, forest exhibited a steady rise of about 25% over the study period (Figure 8).
Figure 8. Histogram of the ‘Forest’ and ‘Shrub and grassland’ classes, Azerbaijan
0 1 2 3 4 1 9 82 1 9 83 1 9 84 1 9 85 1 9 86 1 9 87 1 9 88 1 9 89 1 9 90 1 9 91 1 9 92 1 9 93 1 9 94 1 9 95 1 9 96 1 9 97 1 9 98 1 9 99 2 0 00 2 0 01 2 0 02 2 0 03 2 0 04 2 0 05 2 0 06 A re a, in t h o u sa n d s q k m
desert
desert Trendline 0 5 10 15 20 25 1 9 8 2 1 9 8 3 1 9 8 4 1 9 8 5 1 9 8 6 1 9 8 7 1 9 8 8 1 9 8 9 1 9 9 0 1 9 9 1 1 9 9 2 1 9 9 3 1 9 9 4 1 9 9 5 1 9 9 6 1 9 9 7 1 9 9 8 1 9 9 9 2 0 0 0 2 0 0 1 2 0 0 2 2 0 0 3 2 0 0 4 2 0 0 5 2 0 0 6 Ar e a, in t h o u sa n d s q k mshrub & grassland forest
25
The Azerbaijan map of yearly Standard deviation (STD) of the NDVI, illustrates a general expansion of the area with low values of STD, typical for desert-like land cover (Appendix 6). However, the image of the year 1988 shows a growth of vegetation (Figure 9). This might be explained by the precipitation increase in 1986-1988.
Figure 9. Vegetation cover changes in Azerbaijan (Standard Deviation of NDVI)
The histogram and pie charts presenting the same information in percentage, confirm the pattern of expanding desert-like conditions through the years 1982-2006 (Figure 10, Appendix 8). The areas with lowest range of values declined in 1988 (that could be linked to the high precipitation), and then expanded from 17% of total territory to 36% in 2006. The middle-range values 0.096-0.140 exhibit an increase in 1988 from 19% to 28%, then to 31% in year 1994, and subsequently a reduction to 17% of the total area. It could be interpreted that middle-range values follow the precipitation trend. High STD values of 0,140-0,279 indicating areas with high seasonal changes, such as shrubs and forests, also well corresponds to the rainfall patterns with expand in area in 1988 and 1994, at the times of high precipitation. However, the total area with this range of values declined by 2006 to 16%, relative to 24% in 1982.
26
Russia
In the Russian study area the precipitation graphs a fluctuating rainfall over the period 1982-2006, with a periodicity of 10-12 years (Appendix 1b). There are no significant breaks and the maximum of average monthly precipitation, about 3.3 mm/day, was observed in 1985; the next highest value was about 2.9 mm/day in 1997. Considerable drops in precipitation occurred in 1984, 1994, and 2006. Though, the year 2006 has also occurred to have a high rainfall at the end of the year. The years 1986 – 1990 are characterized with low precipitation period.
From the map of mean of NDVI for the Russia, it is obvious that desert-like territories cover small areas, relative to meadow steppe (Figure 11, Appendix 4). Due to the limited space of this paper, only five images with equal interval between them will be presented on a map, for years 1982, 1988, 1994, 2000, and 2006. The mean NDVI histogram shows the desert class
declined from 1856 km2 in 1982 to 832 km2 in 2006, which is approximately a 55% decrease
(Figure 12). The peak was at the beginning of the study period, in 1982; lowest value was in 1990, followed by the rise in years 1991-1995. These patterns cannot be directly linked to the patterns in rainfall, rather they show existence of other factors influencing the turns of desert on the territory of Russia.
Figure 11. Vegetation cover in Russia coastal area (Mean NDVI)
The wormwood-solonchak semi-desert class demonstrates relatively small changes in area. It is of interest to notice some positive correspondence with precipitation. For example, there occurs wormwood-solonchak semi-desert expansion in 1985 – 1987, in spite of the peak in precipitation in year 1985, and low precipitation in 1986 - 1990. The area of wormwood-solonchak reduced in 1994-1995 at the time following a drop in rainfall in 1994 and only a small increase in precipitation in 1995. The histogram shows ephemeral and half-shrub semi-desert class exhibits decline over the study period from 10 048 km2 in 1982 to 3904 km2 in
27
precipitation in the same year. However, considerable decline in 1988 – 1993 fall short of the rainfall pattern the same years. Despite fluctuation behavior of about 10 years periodicity, meadow steppe class declined by 20% over 25 years. The maximum of the meadow steppe territory is found in 1983, while the minimum was in year 1996.
Figure 12. Histogram of the ‘Desert’ land cover class, Russia
Though mean NDVI values classified as shrub and grassland exhibit fluctuating behavior, this class could be regarded as more or less stable. A small reduction in area of this class appears in years 1985-1987, with the minimum in 1987. This could be explained by low precipitation rate, after the drop in rainfall in 1984. The maximum area covered with this class of vegetation was in 1993. However, the area of forest class exhibits a rising tendency, in spite of all fluctuations, such as 4 years decrease after the maximum in 1990, and following increase in 1994-1997. Since 2003 the forest expanded, and its area in 2006 is nearly 58% bigger than it was in 1982 (Figure 13).
Figure13. Histogram of the ‘Forest’ land cover class, Russia
At the territory of the Russian coastal zone, the NDVI Standard deviation data show the replacement of the vegetation with high STD by the land cover with middle-range STD of
0 0,5 1 1,5 2 2,5 1 9 8 2 1 9 8 3 1 9 8 4 1 9 8 5 1 9 8 6 1 9 8 7 1 9 8 8 1 9 8 9 1 9 9 0 1 9 9 1 1 9 9 2 1 9 9 3 1 9 9 4 1 9 9 5 1 9 9 6 1 9 9 7 1 9 9 8 1 9 9 9 2 0 0 0 2 0 0 1 2 0 0 2 2 0 0 3 2 0 0 4 2 0 0 5 2 0 0 6 Ar e a, in th o u sa n d s q k m
desert
0 10 20 30 40 1 9 82 1 9 83 1 9 84 1 9 85 1 9 86 1 9 87 1 9 88 1 9 89 1 9 90 1 9 91 1 9 92 1 9 93 1 9 94 1 9 95 1 9 96 1 9 97 1 9 98 1 9 99 2 0 00 2 0 01 2 0 02 2 0 03 2 0 04 2 0 05 2 0 06 Ar e a , i n t h o u sa n d s q k mforest
28
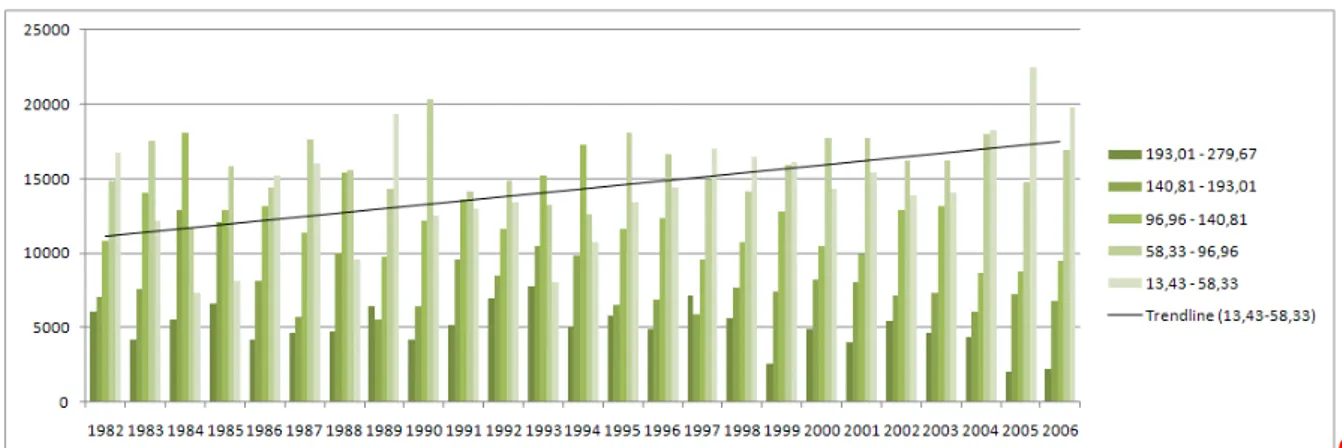
NDVI values, which could be interpreted as degradation of vegetation to some extent (Figure 14). Mostly, this trend features the 3 highest ranges for STD values. The STD range of 0,140 - 0,193 doesn’t look to be totally recovered after the precipitation drop in 1995. The middle-range values exhibit fluctuations with the small steady increase started since year 1996. However, lowest STD values indicate diminish in area through the years, as well as significant
fluctuations with sharp shifts. For example dramatic drop in the year 2002, when there was not
observed significant rise in precipitation.
Figure14.Histogram, presenting Standard Deviation of NDVI for Russia
Kazakhstan
On the precipitation graph of Kazakhstan no longer term could be noticed, although there was a remarkable peak in 1985 (Appendix 1c). The rise in precipitation occurs also in 2002-2004 years, with the peaks in 2002 and 2003. The drops in rainfall rate are noticed in 1984, 1986, 1994, and 2004. With regard to precipitation behavior, the variations in the barren land areas show small correspond, the minimum area occurred in 2002. A drop in area in 1986, and reductions in 1987-88 could be explained by the peak in precipitation in 1985, taking into account some lag. However, considerable rise in area of barren land in 2005 does not repeat this trend, as occur after high rainfalls in 2002-2004 (Figure 15).
Figure15. Histogram of the barren land class, Kazakhstan
0 100 200 300 400 500 600 700 800 1 98 2 1 98 3 1 98 4 1 98 5 1 98 6 1 98 7 1 98 8 1 98 9 1 99 0 1 99 1 1 99 2 1 99 3 1 99 4 1 99 5 1 99 6 1 99 7 1 99 8 1 99 9 2 00 0 2 00 1 2 00 2 2 00 3 2 00 4 2 00 5 2 00 6 193,01 - 279,67 140,81 - 193,01 96,96 - 140,81 58,33 - 96,96 13,43 - 58,33 0 10 20 30 1 9 8 2 1 9 8 3 1 9 8 4 1 9 8 5 1 9 8 6 1 9 8 7 1 9 8 8 1 9 8 9 1 9 9 0 1 9 9 1 1 9 9 2 1 9 9 3 1 9 9 4 1 9 9 5 1 9 9 6 1 9 9 7 1 9 9 8 1 9 9 9 2 0 0 0 2 0 0 1 2 0 0 2 2 0 0 3 2 0 0 4 2 0 0 5 2 0 0 6 Ar e a , i n t h o u sa n d s q km
barren land
29
In the case of Kazakhstan, the map of the mean NDVI shows an increase in steppe area, especially in year 2000 in the North part of the study area, where the overall transformation is from the wormwood-solonchak semi-desert, into the semi-desert with ephemeral and half-shrub plants and solonchak steppe (Figure 15, Appendix 4). While in the South steppe the changes are less significant.
With regard to the mean NDVI values classified as desert, they present significant variation in area through the study period. Changes in area covered with desert class vegetation occur, for example, in the peak of 1990, and drop in 1991, while no considerable changes happen with precipitation values. Expansion of the desert in 2002 – 2005, at the time of the high rainfall rates, could be interpreted as the result of the additional factors, rather than climate (Figure16).
Figure 15. Changes in Kazakhstan coastal area land cover (Mean NDVI)
Figure16. Histogram, showing changes in areas covered with desert and 2 types of semi-deserts, Kazakhstan.
The peak of desert coverage in 1990, and drop in1991, coincide with diminish of the wormwood-solonchak areas in 1990 and peak in 1991, showing interactional fluctuation. The bar chart of the wormwood-solonchak semi-desert class exhibits an overall decline in area during the study period of approximately 15%. A decrease in area is noted in 2000 – 2001, and a rise in 1991-1993. These variations are also not conditioned with any remarkable changes in the rainfall. The overall trend is a significant increase by 2006, in comparison to 1982.
0 20 40 60 80 100 120 1982 1984 1986 1988 1990 1992 1994 1996 1998 2000 2002 2004 2006 Ar e a, in t h o u se an d s q k m desert wormwood-solonchak semi-desert
ephemeral & half-shrub semi-desert
30
The area of the steppe class exhibits a rise pattern. What is to be noted is that changes in area could be negatively compared to the rainfall pattern. The values of 1985, 1994, and 2002-2004 indicate a diminished steppe area, less than what could be expected from the increase in rainfall. With regards to very small areas covered with shrubs and grassland, here the growth trend also occurs; an especially significant rise could be noticed in years 1989 – 1994. The NDVI STD data also shows transformations in the North part, with a reduction in the low-range deviation, especially in year 2000 (i.e. a reduction in desert or semi-desert area). In the South part, very low deviation from NDVI, indicate poor desert-like vegetation (Appendix 6).
The obvious decrease in standard deviation in this area over the 25 years period indicates a reduction in seasonal changes, and therefore the possible onset of desertification. The pie charts showing how STD of NDVI was changing every 5 years, brings out considerable increase in middle and high deviation (Appendix 7). Particularly notable is the range of 0,098 – 0,182 that
covered 47 km2 in 1982 compared with 359 km2 in year 2006 (Figure17).
Figure17. Graph, showing development of the vegetation with seasonal NDVI range (STD = 0.098 – 0.182), Kazakhstan
Turkmenistan
The precipitation graph of Turkmenistan is relatively stable, with a peak in precipitation in 1993 – 1994 (Appendix 1d). Other increases in rainfall rate were observed in 1985-1987, with another peak in 1985, and in 2003 – 2004 years. The years 1988 – 1990 and 2004 – 2006 are characterized with the decline in precipitation. The NDVI histogram of the Turkmenistan study area shows that significant territory is covered with barren land. Its maximum coverage is
observed in 1983 – 1986, with the peak in 1983, when the area of this class was 25216 km2.
Such high figures could not be explained with the rainfall pattern, as years 1982 and 1985 indicate high rate of precipitation. The bar chart presents fluctuation pattern with decline in 1994 – 1998 that could be explained by the raise in precipitation in 1994-1995. After the next peak in 2001, the class of barren land exhibits a lowering in area.
0 0,2 0,4 0,6 0,8 8 2 84 86 88 09 92 94 96 98 2 00 0 2 00 2 2 00 4 2 00 6 Ar e a , i n t h o u sa n d s q km
Standard Deviation, Kazakhstan
31
The desert class of land cover in Turkmenistan repeats the pattern of the barren land till 1994. The overall rising tendency over study period is observed, with the peak in 1986. The wormwood-solonchak semi-desert covers the same amount of area as desert in the year 1982, but then these classes diverge. The wormwood-solonchak semi-desert fall significantly in 1983 when desert expands (Figure 18). This trend continuous tills the year 1986, and after wormwood-solonchak semi-desert reinvades the desert in 1987 when precipitation was high. Then decline is observed again in 1990, with the lowest amount in 1994, coinciding with shrinkage in desert area and peak in precipitation. In 2002 – 2006 this class exhibits a further reduction. Ephemeral and half-shrub types of vegetation covers occupy a small area, although the class increased up to 70% by 2006. Its level is very low in 1982 – 1986 and quite higher in 2002 – 2005. The peak was in 1994 at the time of peak in rainfall. Its area also shows increases in 1998 and 2003 – 2005.
Figure18. Histogram, presenting changes in wormwood-solonchak and desert classes, Turkmenistan
The solonchak steppe class shown in the histogram of the Turkmenistan, exhibit a small rise, especially in years 2003 – 2005. The peaks in the area coverage were in years the 1998 and 2003. The area covered with highest mean NDVI values, classified as shrub and grassland
also has rose from 64 km2 in 1982 to 256 km2 in 2006. The last reduction in area relative to
1982 was in the year 1993.
The images of the mean NDVI for Turkmenistan shows expanding desert in the area around Garabogazkol Bay, although, in 1994 it was invaded by wormwood-solonchak semi-desert (Appendix 4). In the South of the study area there is a small island of steppe, and general prevalence of the semi-desert (Figure 19). The Standard deviation of NDVI indicates more plants with high NDVI STD in 1988 and 2000 than in 1994, especially in the middle of the country. South of the study area is richer with plants presenting higher variation during the
0 10 20 30 40 50 60 70 80 19 8 2 19 8 3 19 8 4 19 8 5 19 8 6 19 8 7 19 8 8 19 8 9 19 9 0 19 9 1 19 9 2 19 9 3 19 9 4 19 9 5 19 9 6 19 9 7 19 9 8 19 9 9 20 0 0 20 0 1 20 0 2 20 0 3 20 0 4 20 0 5 20 0 6 Ar e a, in t h o u sa n d s q k m desert wormwood-solonchak semi-desert