In Situ Investigations of the
Metal/Atmosphere Interface.
Influence of Humidity, Sulfur Dioxide, Ozone and
Nitrogen Dioxide on Copper.
Teodor Aastrup
Doctoral Thesis
Department of Materials Science and Engineering Division of Corrosion Science
Royal Institute of Technology SE-100 44 STOCKHOLM, SWEDEN
Stockholm 1999 Avhandling
som med tillstånd av Kungliga Tekniska Högskolan i Stockholm framlägges till offentlig granskning för avläggande av teknisk doktorsexamen, fredagen den 10 december 1999 kl. 10.00 i Kollegiesalen, Valhallavägen 79, Kungliga Tekniska Högskolan.
Fakultetsopponent är Prof. Beatrice Hannoyer, Univ. de Rouen, LASTSM-IUT, Frankrike. ISRN KTH/MSE/Korr/DA-99/2-SE
Cover picture: A TM-AFM image of copper exposed to a corrosive atmosphere.
© Teodor Aastrup 1999
Printed by: Högskoletryckeriet, KTH 1999 ISRN KTH/MSE/Korr/DA-99/2-SE
Teodor Aastrup (1999)
In Situ Investigations of the Metal/Atmosphere Interface. Influence of Humidity, Sulfur
Dioxide, Ozone and Nitrogen Dioxide on Copper. Department of Materials Science and Engineering Division of Corrosion Science
Royal Institute of Technology
SE-100 44 STOCKHOLM, SWEDEN
Abstract
This thesis presents a new experimental setup for surface analysis studies, incorporating chemical information from infrared reflection absorption spectroscopy (IRAS) and quantitative information from quartz crystal microbalance (QCM). The integrated IRAS/QCM surface analysis system enables in situ studies to be conducted of the metal/atmosphere interaction on a sub- monolayer level. In combination with topographical information from tapping mode atomic force microscopy (TM-AFM), it was possible to follow the formation of corrosion products providing information about chemical identity, quantity and lateral distribution. The newly developed system was used to study the influence of relative humidity (RH) and levels of sulfur dioxide (SO2), ozone (O3) and nitrogen dioxide (NO2) down to
concentrations of sub parts-per-million (ppm), on the initial stages of atmospheric corrosion of copper.
Exposure to RH led to the formation of small grains of cuprous oxide (Cu2O), with an average
diameter of approximately 40 nm. The grain nucleation rate increased with increasing RH due to the increasing amount of physisorbed water on the surface.
Exposure to RH and SO2 led to the formation of copper sulfite (CuSO3•xH2O) species as well
as reduction in the rate of Cu2O formation. The formation of CuSO3•xH2O occurred through
the dissolution and consecutive precipitation of surface-bound copper sulfite complexes. The roles of O3 and NO2 in the SO2-induced atmospheric corrosion of copper was also
investigated. O3 was found to have a two-fold effect, resulting in the oxidation of the copper
sulfite species to copper sulfate and the enhancement of Cu2O formation. NO2 promoted the
oxidation of copper sulfite species, though less efficiently than O3, and reduced Cu2O
formation. In addition, copper nitrate formation was observed.
IRAS was also used to investigate the interaction between SO2 and surfaces made of platinum
and palladium. Sulfuric acid formation was observed on both metals, showing the importance of the surface on the formation of the metal/atmosphere reaction products.
Keywords: Atmospheric corrosion, IR-spectroscopy, IRAS, QCM, AFM, SO2, O3, NO2, Cu.
Preface
The thesis includes the following papers, referred to in the text by their roman numerals. I Simultaneous infrared reflection absorption spectroscopy and quartz crystal
microbalance measurements for in situ studies of the metal/atmosphere interface
T. Aastrup and C. Leygraf, J. Electrochem. Soc., 144, 2986 (1997)
II Experimental in situ studies of copper exposed to humidified air
T. Aastrup, M. Wadsak, M. Schreiner and C. Leygraf, Corr. Sci., (accepted for publication)
III In situ studies of the initial atmospheric corrosion of copper - Influence of humidity, sulfur dioxide, ozone and nitrogen dioxide
T. Aastrup, M. Wadsak, C. Leygraf and M. Schreiner, J. Electrochem. Soc., (submitted)
IV In situ infrared reflection absorption spectroscopy studies of sulfuric acid formation on platinum and palladium
T. Aastrup, D. Persson, I. Odnevall Wallinder and C. Leygraf, J.Electrochem.
Soc., 145, 487 (1998)
There are three additional papers completed, relating to but not included in the thesis.
V A comparison of preparation methods of copper surfaces for in situ scanning force microscopy (SFM) investigations
M. Wadsak, M. Schreiner, T. Aastrup and C. Leygraf, J. Appl. Surf. Sci., (accepted for publication)
VI Experimental in situ studies of the metal/atmosphere interface
T. Aastrup, C. Leygraf, M. Wadsak and M. Schreiner, Proc 14th Int. Corr. Congress, paper No. 1 (1999)
VII Combined in situ investigations of atmospheric corrosion of copper with SFM and IRAS coupled with QCM
Contents
Introduction... 1
Brief description of the techniques ... 3
Infrared reflection absorption spectroscopy... 3
Quartz crystal microbalance ... 6
Tapping mode atomic force microscopy... 8
X-ray photoelectron spectroscopy... 9
Combined IRAS and QCM setup. ... 11
Summary of the included papers ... 13
How well do IRAS and QCM correlate with each other, and what are the limits of the system? ... 13
How can TM-AFM be used for in situ studies of the metal/atmosphere interface in combination with IRAS/QCM?... 18
How does Cu2O formation proceed during the exposure of copper to humidified air?... 20
What are the roles of O3 and NO2 in SO2-induced atmospheric corrosion of copper? ... 23
The role of SO2 on copper corrosion... 23
The role of O3 in SO2-induced copper corrosion... 24
The role of NO2 in SO2-induced copper corrosion... 27
Can metal surfaces catalyze the oxidation of bisulfate ions to sulfate ions in the aqueous adlayer?... 28
Future work... 29
Acknowledgements... 30
References... 32
Introduction
The interaction between a metal and the surrounding atmosphere is of profound importance for many natural and technical processes, such as the degradation of metals discarded in the environment and the build up of corrosion products leading to defective contacts in electronic devices caused by corrosion. Corrosion through the interaction of metal surfaces with the atmosphere has been observed by human societies ever since people first began to use metals. However, it was not until Vernon 1 in the 1920s that the area of atmospheric corrosion became a true scientific discipline.
OH M SO2 HSO3- + H + M Atmosphere Aqueous adlayer Solid NO2 O3 O 2 N2 NO3- + H+ OH
Figure 1 Diagrammatic representation of the metal/atmosphere interface.
During the last 30 years the field of corrosion science has developed substantially. All the phases involved in the metal/atmosphere interface are considered as illustrated by Figure 1, which includes gas, liquid and solid phases and their interfaces. As a consequence of development in the field, collaboration between chemists, electrochemists, physicist and material scientists is nowadays necessary achieving a comprehensive understanding of atmospheric corrosion. It can therefore truly be called an interdisciplinary field of science.
The interaction between water and various surfaces in vacuum conditions has been studied using a number of techniques, and extensively reviewed by Thiel and Madey 2. There have also been many studies focusing on the adsorption of water on metal surfaces at atmospheric pressure 3-5. Several research groups 6-9 have also examined the role of water in atmospheric corrosion in combination with various gases or other corrosion stimulators in laboratory experiments. The corrosion products formed in field environments and their formation sequences have been studied for various materials including copper 10-13. However, well-defined studies of the processes occurring at the metal/atmosphere interface are difficult to perform and many questions still remain unanswered. The mechanisms involved in the corrosion process must be clearly understood before accurate accelerated tests can be performed. Accelerated tests have been growing in importance in the industry for a number of reasons, such as the rapid development of new materials and pollutants, the miniaturization of electronics, and for financial reasons.
The research works undertaken here has led to the development of an experimental setup for in situ studies of the metal/atmosphere interface combining infrared reflection absorption spectroscopy (IRAS) and quartz crystal microbalance (QCM). IRAS has previously proved to be an excellent tool for in
situ studies of atmospheric corrosion 9,14, however the quantification of corrosion products using IRAS is difficult. Mass-sensitive QCM has for this reason been integrated with the IRAS setup. QCM has previously shown promising results in both field 15-17 and laboratory 3-5,7 studies. The IRAS/QCM setup has been combined with tapping mode atomic force microscopy (TM-AFM) studies to obtain information about the lateral distribution of the corrosion products formed. The techniques have been applied in a study of the copper-atmosphere interface (chosen for its significant importance to industry), revealing new and detailed information about the mechanisms involved in copper corrosion.
Brief description of the techniques
Infrared reflection absorption spectroscopy
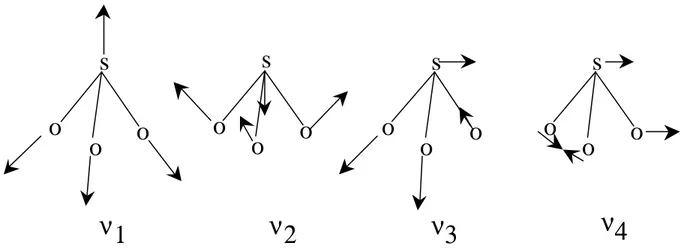
Infrared spectroscopy has been used for approximately 100 years 18. The development started with the invention of the Michelson interferometer in 1891. Michelson received the Nobel Prize in Physics in 1907, quote: "for his optical precision instruments and the spectroscopic and metrological investigations carried out with their aid". However, it was not until the late 1960s that infrared spectroscopy became widely used. The main reason for the timing of this increased use was the development and increasing availability of microcomputers, which meant that Fast Fourier Transformations of the interferogram could then be performed in the laboratory to calculate the infrared spectra of samples. One of the advantages of FT-IR spectroscopy is that in contrast to many other techniques, it can be used to characterize surfaces at atmospheric pressure. The physical principle behind FT-IR spectroscopy is that atoms within a molecule vibrate and can absorb a photon through the activation of a vibration. A non-linear molecule with N atoms has 3N-6 internal degrees of freedom (3N-5 for a linear molecule) when the translational and rotational motions are subtracted 19. This means that there can be 3N-6 possible vibrations within a non-linear molecule. The possible vibrations for a sulfite ion are illustrated in Figure 2 20. The two asymmetric vibrations are doubly degenerated, as the three oxygen atoms can not be distinguished from each other. However chemical coordination of a sulfite ion and the surface via an oxygen atom will split the degenerated vibrations due to the loss of symmetry, hence, allowing all six vibrations to become distinguishable.
s
o
o
o
s
o
o
o
s
o
o
o
s
o
o
o
ν3
ν1
ν2
ν4
Figure 2 Diagrammatic representation of the four fundamental vibrational modes in a sulfite ion: ν1 (symmetric stretch), ν2 (symmetric bend), ν3 (asymmetric stretch) and ν4 (asymmetric
bend).
Coordination through the sulfur atom will not only cause a split in degenerated vibration modes, but it will also increase the vibration frequency of the stretching modes ν1 and ν2. A vibration can also interact with the oscillating
electrical field of light. Since the wavelength of infrared light ( 1 µm) is roughly three order of magnitude larger than the size of the molecule being considered here ( 1 nm), then this molecule will experience a uniform electric field over its entire extent. As an example, consider the ν1 vibration of the sulfite
ion represented in Figure 2. An upward electric field will move the positive sulfur atom upward and the negative oxygen atoms downward. As the electric field oscillates it will induce an upward and downward movement of the atoms, thereby causing vibration in the molecule. If this vibration causes a change in the dipole moment of the molecule (as in this example), then the vibration is said to be infrared active and can absorb energy from the light (see Figure 3). This absorption is most efficient when the frequency of the oscillating electric field is close to the resonance frequency of the vibration and is proportional to the square in the change of dipole moment; which is expressed by A∝( µ/ Qi)
2
E
||s
o
o
o
s
o
o
o
ν3
ν1
Žµ /Žy
Žµ/Žx
Figure 3 Diagrammatic representation of the surface selection rule. A change in the dipole moment must have a component in the plane of incidence, perpendicular to the surface. The
ν1 vibration mode can interact and absorb the light whereas ν3 has its change of dipole
moment in the surface plane and is therefore unable to interact.
It should be stressed however that a molecule does not have to be a dipole to be able to absorb infrared light, as a change in the dipole moment is sufficient. In IRAS light is reflected off the surface of a sample. The electrical field of the light can be divided into two perpendicular components (E and E⊥) as it strikes the surface. E is located in the plane of incidence, parallel to the angle defined by the normal to the surface and the direction of the incoming light at the point of incidence, and E⊥ is perpendicular to the plane of incidence. E⊥ exhibits a phase shift of close to 180° on reflection at the surface, hence the sum of the incident and reflected electric fields is approximately zero 21. The net effect of this is that the infrared light polarized in the surface plane can not activate a molecular vibration. Analogously, a molecule can only absorb infrared light when the change in the dipole moment has a component in the plane of incidence, perpendicular to the surface (see Figure 3). This is called the surface selection rule. Thus, with p-polarized light (E⊥=0), surface sensitivity can be increased as the background noise is reduced
The main advantage of IRAS is that it can be used at atmospheric pressure or even in liquids. The information depth using IRAS ranges from sub-monolayer depths to approximately 1 µm and it is relatively straight forward to operate. The drawbacks are mainly its poor lateral resolution ( 10 mm2), relatively poor time resolution in thin layers, and difficulties encountered in interpreting spectra and quantifying the different species that are formed.
In summary, IRAS can be used to detect and follow the formation of species at atmospheric pressure and enables information to be obtained about the coordination of the various surface species being formed.
Quartz crystal microbalance
QCM is based on the piezoelectric effect discovered by Pierre and Jacques Curie in 1880. The piezoelectric effect can be illustrated by applying pressure to a piezoelectric material to generate an electric potential between the deformed surfaces 22. A year later the same researchers discovered the inverse
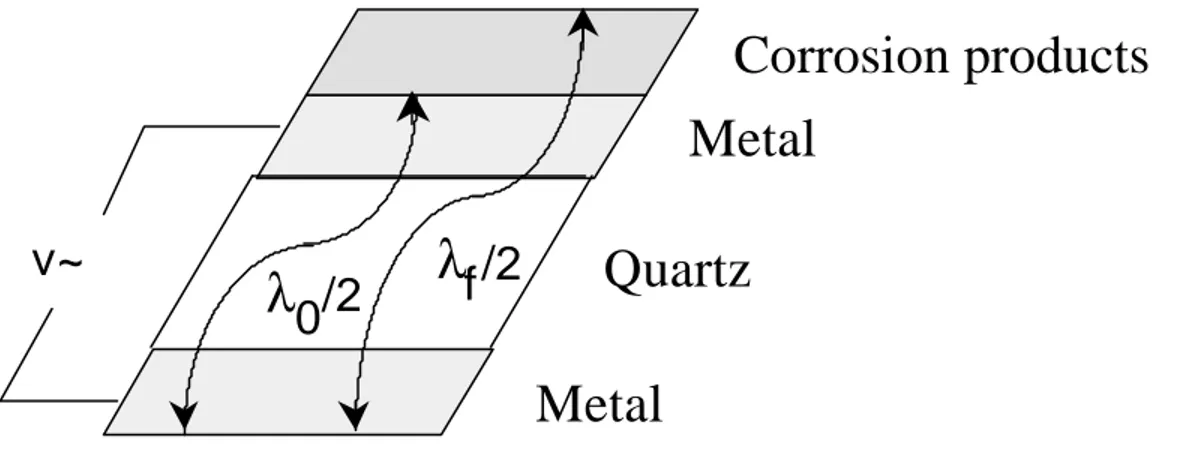
phenonomen, that the application of a voltage to a piezoelectric material will deform it. Consequently the application of an alternating voltage can result in a deformation oscillation in a piezoelectric material. By shearing a piezoelectric material along specific crystalline directions and sandwiching it between two electrodes, these deformation oscillations can be controlled. The, so called, AT-cut results in shear deformation of the crystal with a stable and sharp resonance frequency. Figure 4 depicts an oscillating crystal, where λi represents the
wavelength for the resonance oscillation both with and without corrosion products. The resonance frequency can be measured easily and λi calculated
thereafter. As λi is proportional to the thickness and the mass of the coated
crystal, the mass of the corrosion products can be calculated by comparing the resonance frequency with and without corrosion products.
Metal
Quartz
Metal
Corrosion products
λ
0
/2
λ
f /2
v~
Figure 4 Diagrammatic representation of an oscillating crystal, where λf and λ0 represents
the wavelength for the oscillation with and without corrosion products, respectively.
In 1959 Sauerbrey derived the Sauerbrey equation [1], to correlate change in frequency change with change in mass 23
∆f = -2f0 2∆
m/(ρqνq) [1]
where ∆f is the frequency shift, f0 the resonance frequency at the start of the
experiment, ∆m the mass change per area, ρq the density of quartz and, νq the
shear wave velocity of quartz. A change of 1 Hz corresponds to a mass change of 20 ng/cm2 for a 5 MHz crystal. This is less than the weight of one monolayer of water 24. ∆f is derived by assuming that the density and shear-wave velocity are the same for all the materials involved (that is for the metal electrode, the corrosion products and the quartz crystal). This assumption is valid where the thickness of the quartz crystal is one or more orders of magnitudes greater than that of the metal and the corrosion products formed. The assumption is also made that the various layers are rigid, homogeneous and have good adhesion properties. The validity of this assumption is not so obvious in the case of water adsorbed on a surface. However, Rodahl and Kasemo 25 showed that the Sauerbrey equation could be used with a high degree of accuracy in films of water up to 0.1 µm thick.
The main advantages with using QCM are that it can be used at atmospheric pressure and can measure changes in mass of less than a monolayer, with a degree of accuracy and high temporal resolution. The main drawbacks of QCM are its lack of lateral resolution, inability to distinguish between the different species responsible for the change in mass and its sensitivity to pressure and temperature changes in the atmosphere.
In summary, QCM can monitor changes in mass with sub-monolayer sensitivity, and can monitor adsorption of water films thinner than 0.1 µm.
Tapping mode atomic force microscopy
TM-AFM belong to a group of techniques collectively referred to as scanning force microscopy (SFM). In 1981, Binnig et al. 26 invented the scanning tunneling microscope (STM). Binnig and Rohrer received the Nobel Prize in Physics in 1986, quote: "for their design of the scanning tunneling microscope". With a STM it is possible to study single atoms on conducting materials at atmospheric pressure. In 1986, Binnig et al. 27 introduced the atomic force microscope (AFM), which can also be used on non-conducting materials. Various modified forms of the SFM have followed since the development of the AFM, including the kelvin force microscope (KFM), the magnetic force microscope (MFM), and the friction force microscope (FFM) or the phase detection imaging (PDI) microscope. The AFM uses a small tip to scan the surface. The tip is maintained in constant contact with the surface, and is therefore also referred to as contact mode-AFM, and the forces acting on the surface are measured. If the sample is a soft material, the tip can cause a deformation of the sample surface. This undesirable deformation is minimized through utilizing TM-AFM, where the cantilever holding the scanning tip oscillates with a frequency in the range of 10-400 kHz. As a result, the tip has
only intermittent contact or even no contact at all with the surface, thereby minimizing the resulting deformation of the sample surface (see Figure 5).
Sample
Oscillating cantilever with tip
Figure 5 Diagrammatic representation of a TM-AFM scanning tip.
A phase shift can occur between the driving signal for the cantilever and the actual cantilever oscillation. This phase shift depends on many properties, such as the composition of the sample material or its edges. PDI can be used to enhance the contrast of an image as well as to obtain chemical information from the sample.
The two main advantages of TM-AFM/PDI are the high lateral resolution that can be obtained down to the atomic level at ambient conditions, and the avoidance of sample-deformation by the tip during scanning. The main drawbacks with TM-AFM/PDI are the difficulties experienced with PDI signal interpretation when trying to extract chemical information from it and distinguishing between the various different phases being formed.
In summarizing, TM-AFM/PDI can be used for in situ studies of the atmospheric corrosion with a lateral resolution on an atomic level. However, chemical information is difficult to extract.
X-ray photoelectron spectroscopy
X-ray photoelectron spectroscopy (XPS), also known as electron spectroscopy for chemical analysis (ESCA), was developed by Siegbahn and coworkers 28-29. Siegbahn received the Nobel Prize in Physics in 1981, quote: "for his
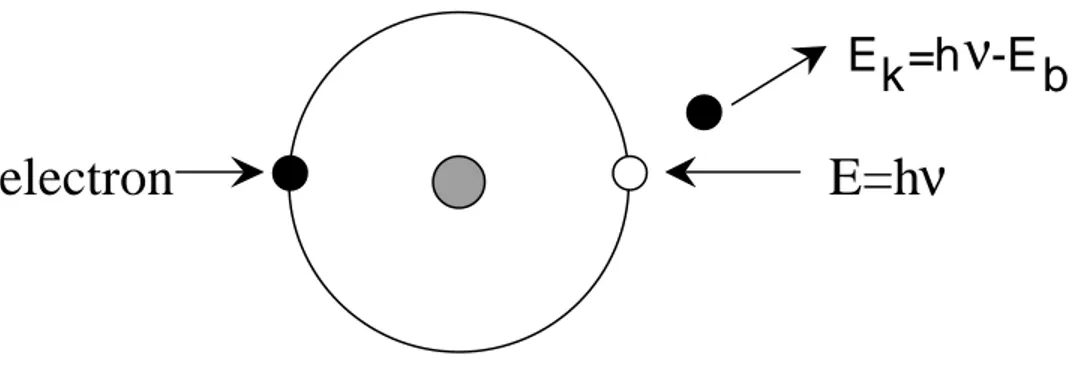
contribution to the development of high-resolution electron spectroscopy". XPS is based on the principle that when a sample is irradiated with x-rays, it will emit three components, scattered x-rays, secondary x-rays characteristic of the irradiated sample, and electrons. The energy of an emitted electron, (Ek) equals
the energy of the x-ray photon, (hν) minus the binding energy of the electron, (Eb)(see Figure 6).
electron
E=h
ν
Ek=h
ν
-E b
Figure 6 Diagrammatic representation of the emission of a photoelectron from an atom irradiated with x-rays.
Eb is characteristic for each atom and its valence state, and can therefore be used
to identify the chemical state of an atom. An emitted electron can penetrate through a few layers of atoms, therefore providing information to a depth of a few nm. In order for the emitted electron to reach the detector, ultra high vacuum (UHV) conditions are required.
The main advantages associated with XPS are the relative ease with which the various different chemical species can be identified, and the relatively high sensitivity to the sample surface that can be achieved. The main drawbacks are the requirement for UHV conditions, the difficulties in obtaining information from thicker layers of sample materials, and poor lateral resolution, approximately 0.1 mm2.
Combined IRAS and QCM setup.
An important part of this doctoral study was to integrate QCM into an existing IRAS setup used for in situ atmospheric corrosion studies. To the best of the author’s knowledge, there have been three other setups similar to this one 30-32. Integration has been accomplished here through placing the metal-coated quartz crystal (probe) in the same position as the sample in the IRAS setup, so that the chemical information obtained from IRAS could be combined with the kinetic information obtained from QCM. Figure 7 is a diagrammatic representation of the experimental setup. The experimental setup consists of a FTIR spectrometer with an external detector, a QCM sensor probe with a frequency counter, a corrosive air generation and analysis system, and an exposure chamber.
FTIR spectrometer Gas analysis: T, RH, O3 SO2, NO2 Gas analysis Sample and QCM probe Polarizer
Detector
Figure 7 Diagrammatic representation of the experimental setup.
The FTIR spectrometer and detector allow scanning across the frequency range where most metal oxides and corrosion products can be found, and the QCM sensor probe can detect sub-monolayer amounts of, for instance, water or metal
oxides. The gas generation/analysis system can at the present time handle a corrosive gas containing humidity, SO2, O3 and NO2, which are some of the
most important corrosion stimulators present in the atmosphere.
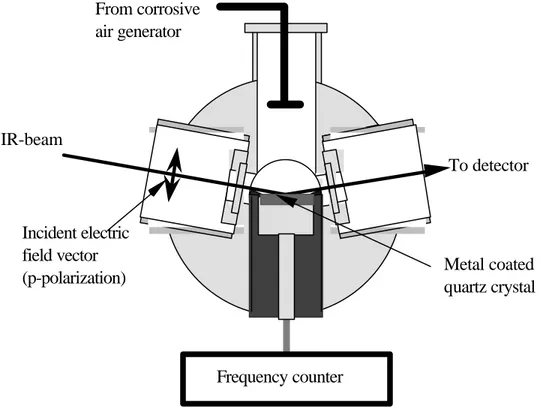
A cross section through the exposure chamber showing the QCM sensor probe and IR beam path is depicted in Figure 8. In order to enhance the surface sensitivity to the sample, the beam is p-polarized and the angle of incidence is optimized to approximately 80°. The corrosive air enters the chamber from above. In Papers I and II, the air inlet was perpendicular to the surface sample, whereas in Paper III the air inlet was as depicted in Figure 8.
Polarizer
Incident electric field vector (p-polarization) From corrosive air generator Metal coated quartz crystal IR-beam To detector Frequency counterFigure 8 Cross-section of the exposure chamber, showing the path for the IR-beam and the corrosive gas inlet, as used in Paper III.
Summary of the included papers
How well do IRAS and QCM correlate with each other, and what are the limits of the system?
The practical potential of the IRAS/QCM setup was explored by studying the atmospheric corrosion of copper. Here copper was initially exposed to purified air at various levels of RH (see Paper I). As humidity entered the chamber QCM registered a positive change in mass increasing with time (see Figure 9). When the humidity was turned off, a negative change in mass was registered, though this amount was less than the gain in mass previously registered. As humidity was reintroduced, an increasing mass gain was registered once again.
0
0,1
0,2
0,3
0,4
0,5
0,6
0,7
0
0,005
0,01
0,015
0,02
0
200
400
600
800
1000 1200
Mass change /µgcm
-2Absorbance /-log(R/R
0)
Time /minutes
QCM
Cu
2O
Dry Dry DryFigure 9. Mass change registered by QCM (y-axis LHS) and intensity of the IRAS absorbance band for Cu2O (y-axis RHS) versus time.
In the IRAS spectra recorded simultaneously, there were three main absorbance bands observed, the positions of which are indicated in Figure 10. The band at 645 cm-1, which grew with time (see Figure 9), corresponds to the formation of
cuprous oxide 33-34, hereafter denoted Cu2O. The band at 1600 cm -1
corresponds to the scissors vibration mode of water ( ) and the broad band at 3400 cm-1 to the symmetric and asymmetric stretching vibrations of water (ν), that is, the OH groups in water 35. The latter band probably contains a minor contribution from the hydroxylated surface (in other words the OH groups present at the interface between a metal oxide and the aqueous adlayer 36). The absorption of water in the gas phase is also visible here. When the humidity was turned off, the intensity of the water bands decreased by more than 90%, whereas the intensity of the Cu2O band remained essentially constant.
0 0,005 0,01 0,015 0,02 0,025 0,03 0,035 0,04 500 1000 1500 2000 2500 3000 3500 4000
Absorbance /-log(R/R
0)
Wavenumber /cm
-1νΗ
2Ο/ΟΗ
ŽH 2O Cu 2O H 2O gas phaseFigure 10 IRAS spectrum of copper exposed to 80% RH, showing the absorbance bands due to Cu2O and water. Background spectra (R0) were recorded in a dry atmosphere.
The combined information from IRAS and QCM suggests that the mass loss registered by QCM when turning the humidity off corresponds to the amount of physisorbed water on the surface (the aqueous adlayer), and that the remaining
mass gain corresponds to the formation of Cu2O. Thus, the combination of the
both techniques enables quantification of the various different species formed during exposure.
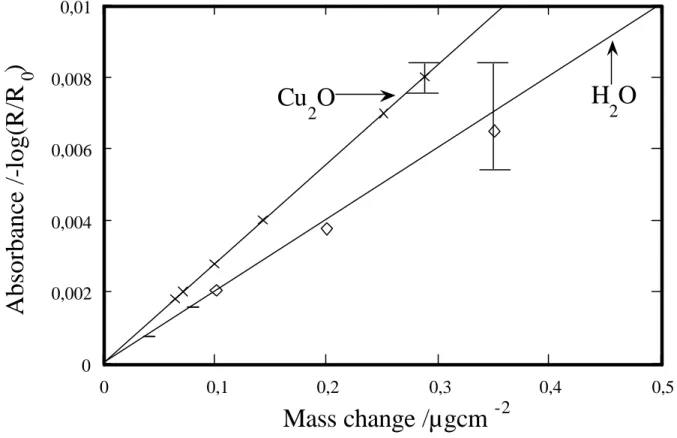
The relationship between the intensities of both the Cu2O and the water
absorbance bands and the corresponding mass gain was determined using the following procedure. First of all, varying the RH resulted in a variation in the amount of physisorbed water and thereby a variation in the intensity of the water absorbance bands. Plotting the intensity of the water bands due to the physisorbed water against the amount of the physisorbed water measured by QCM shows a linear relationship (see Figure 11).
0 0,002 0,004 0,006 0,008 0,01 0 0,1 0,2 0,3 0,4 0,5
Absorbance /-log(R/R
0)
Mass change /µgcm
-2H
2O
Cu
2O
Figure 11 Intensity of the Cu2O and water absorbance bands vs. mass change measured by
QCM. The error bars indicate the scatter of the experimental data.
Using this relationship and subtracting the mass gain due to water from the total mass gain registered by QCM, results in the mass gain due to Cu2O. In Figure
11, the intensity of the Cu2O absorbance band is plotted against the mass change
due to Cu2O, and shows in a linear relationship. This relationship was verified
by plotting IRAS against cathodic reduction by Persson and Leygraf 33 and by calculating theoretical IRAS spectra for a given Cu2O mass
37
. All three methods generated the same linear relationship. A final verification was done by comparing the resonance frequency of the copper-coated quartz crystal prior to the exposure, and after the experiment when the corrosion products had been removed by pickling. The change in resonance frequency corresponds to the maximum amount of copper oxidized during exposure (that is the total amount of copper contained in the corrosion products). This amount agreed excellently with the formation of Cu2O. Note that QCM only measures the addition or
removal of mass, therefore the mass gain due to Cu2O must be multiplied by
8.94 (the molar weight of Cu2O divided by the molar weight of O) to obtain the
actual mass of Cu2O, as it is only the addition of O that is measured here.
In Paper III, copper was exposed to RH, SO2, O3 and NO2. Using the same
procedure as describe above (subtracting the mass change of the known phase and plotting the intensity of a new band against the remaining mass change), the relationships for copper sulfite for simplicity reasons denoted CuSO3
38-39
, copper sulfate (CuSO4)
9,40
, and copper hydroxy nitrate (CuNO3) 41-42
could also be obtained. In Figure 12, the intensities of the three bands are plotted against the mass gain due to each respective phase, resulting in a linear relationship.
0 0,002 0,004 0,006 0,008 0,01 0 0,1 0,2 0,3 0,4 0,5
Absorbance /-log(R/R
0)
Mass change /µgcm
-2CuSO
3CuNO
3CuSO
4Figure 12 Intensity of the copper sulfite, copper sulfate and copper nitrate absorbance bands
vs. mass change measured by QCM. The error bars indicate the scatter of the data.
The detection limits for the different species were obtained from the noise levels around the respective absorbance bands and corresponded to 2 for Cu2O, 0.5 for
CuSO3, 0.2 for CuSO4 and 0.7 for CuNO3 monolayers. The detection limit for
QCM was obtained from the drift in resonance frequency and was 0.5 Hz, which corresponds to 10 ng/cm2.
In summarizing, the intensity of the absorbance band due to water, Cu2O, copper
sulfite, copper sulfate and copper hydroxy nitrate in the IRAS spectra could be related to a mass change measured with QCM. From the relationship between each of the absorbance bands and the corresponding mass change, it was possible to quantify the respective amount of each of the different species formed down to monolayer resolutions.
How can TM-AFM be used for in situ studies of the metal/atmosphere interface in combination with IRAS/QCM?
The IRAS/QCM setup does not reveal any information about the morphology of the corrosion products formed. As a consequence, complementary TM- AFM studies were implemented (though not integrated with the IRAS/QCM setup) in collaboration with the Institute of Analytical Chemistry at the Vienna Technical University. As a first step in these complementary studies, suitable methods for preparation of the surface were investigated in Paper V (not included in the thesis). The methods investigated included various mechanical and electrochemical procedures for polishing of copper sheets, as well as others for pickling the copper-coated quartz crystals used in the IRAS/QCM experiments and the copper sheets. Electrochemical polishing and mechanical polishing with monocrystalline diamond paste down to 0.25 µm were found to be the most suitable methods for in situ studies of copper, with the latter being selected for use in the papers included in the thesis. The polished surface both before and after exposure to 80% RH is depicted in Figure 13 (a and b respectively). The polished surface is very flat, and it is relatively easy to follow the formation of small, round corrosion products less than 10 nm in diameter. The pickled copper-coated quartz-crystal surface is much rougher and consists of round copper grains (see Figure 13c). The formation of corrosion products could not be observed in this case because of the rough surface. Exposing polished copper to RH, led to the formation of small, round surface features typically just a few tenths of a nanometer in diameter. These can be seen in Figure 13b. They completely covered the surface, even in the scratches. No significant changes were observed of the surface when the experiment was concluded in dry air. Based on the IRAS/QCM measurements, the features could therefore be attributed to the formation of Cu2O grains (Paper II).
a b c
Figure 13 Micrographs from the TM-AFM experiments. a, Copper sheet mechanically polished with monocrystalline diamond paste down to 0.25 µm. The surface is very flat, but scratches from the polishing are visible. b, Polished copper sheet after 1400 minutes exposure to 80% RH. Scratches are still visible and round features are completely covering the surface. c, Pickled copper-coated quartz crystal. The surface consists of round copper grains with a diameter of 70 nm. Height range (from black to white):25 nm in a and b, and 50 nm in c. Scan size: 1 x 1 µm2.
In Paper III, the corrosion behavior of copper was investigated in a humidified SO2 atmosphere after the addition of O3 or NO2. The formation of two distinctly
different sized features was observed, one smaller (similar to the Cu2O grains)
than the other. In a humidified SO2 atmosphere, the larger features were
attributed to the formation of copper sulfite species (CuSO3), probably
precipitated onto the surface and the smaller features attributed to a combination of a Cu2O and CuSO3 (see Figure 14a). Exposure to RH, SO2 and, O3 led to the
formation of smaller features all over the surface (Figure 14b). These features were attributed to the formation of Cu2O and CuSO4. The combination of RH,
SO2 and NO2 also resulted in a similar behavior to that seen in the SO2 and O3
experiments (Figure 14c), with the exception that some larger features could be correlated with CuNO3 formation, and the smaller features could be correlated
a b c
Figure 14 Micrographs from the TM-AFM experiments in Paper III. a, Polished copper exposed to 80% RH and 500 ppb SO2 for 1120 minutes. The larger features seen here have a
typical diameter of 150 nm and are spread sparsely over the surface. The smaller features cover the surface. b, After exposure to 80% RH and 250 ppb SO2 and O3 for 1000 minutes.
The small features (though larger than seen in a) cover the surface. One larger feature is visible at the righ side of the picture. c, After exposure to 80% RH and 250 ppb SO2 and NO2
for 1080 minutes. The smaller features completely cover the surface. Only a few larger features are visible here. Scan size: 1 x 1 µm2. Height range: black to white is 25 nm.
In summary, the combintion TM-AFM and IRAS/QCM was able to determine the formation of Cu2O grains with a diameter of only a few tenths of a
nanometer. When exposed to an experimental atmosphere containing SO2 plus
O3 or NO2, the formation of corrosion products could be followed but not
unambiguously identified.
How does Cu2O formation proceed during the exposure of copper to
humidified air?
In Paper II, the formation of small grains of Cu2O with a diameter of around a
few tenths of a nanometer, and a physisorbed water layer could be followed at exposure to RH. The rate of formation of Cu2O could be fitted reasonably well
to a logarithmic rate law, and increased with increasing RH, as did the amount of physisorbed water. In Paper III, the flow conditions were changed and
exposure to 80% RH revealed a faster rate of Cu2O formation as well as a
greater amount of physisorbed water on the surface compared to the exposure to 80% RH in Paper II. Thus, an increased amount of water on the surface resulted in an enhanced Cu2O formation rate. This indicates that the physisorbed water
layer influences the oxidation rate. In Figure 15, freshly polished copper (a) can be compared with copper exposed to 80% RH for 80 minutes (b) and to 60% RH for 1300 minutes (c). The surface seen in Figure 15b is completely covered with Cu2O grains, whereas areas devoid of Cu2O grains can be seen in Figure 15c.
Thus increasing RH and thereby increasing the amount of physisorbed water resulted in an enhanced rate of nucleation of Cu2O grains.
a b c
Figure 15 a, Freshly polished copper. b, 80 minutes exposure to 80% RH. c, 1300 minutes exposure to 60% RH.
One possible explanation for the enhanced rate of nucleation of Cu2O grains can
relate specifically to the adsorption of water. According to a review conducted by Thiel and Madey 43, water tends to adsorb in clusters onto metal surfaces because this minimizes the surface energy of the adsorbed water. The number and the size of water clusters increase with the amount of adsorbed water on the surface, towards a total coverage at a high RH. Assuming that sufficiently large water clusters act as nucleation sites for the formation of Cu2O grains, the
number of nucleation sites increases with the amount of physisorbed water on the surface and thus, with relative humidity (Figure 16).
Cu Cu2O H2O Cu2O H2O Atmosphere
Figure 16 Water adsorption as clusters, with rapid Cu2O formation within the water cluster
and negligible Cu2O formation between the water clusters.
Interaction occurs between the surface and dissolved oxygen gas contained in the water within the water clusters. The properties of the water depend on the thickness of the water cluster. According to Franks 44, a water molecule is only affected by water molecules closer than three water molecule diameters, suggesting that at least five but probably more monolayers of water molecules are necessary to obtain bulk properties. Assuming that a half spherical cluster of ten water molecule diameters is necessary to act as a nucleation site for Cu2O
formation, then approximately 100 ng/cm2 would be necessary to completely cover the surface with such clusters. This is equal to the amount of physisorbed water seen at 80% RH but more than the amount of physisorbed water at 60% RH in Paper II. Even though a direct comparison is impossible due to the different flow conditions between the IRAS/QCM and TM-AFM experiments, it is it worth noting that Figure 15 shows a complete surface coverage at 80% RH but not at 60%. Water is directly involved in the oxidation process. Hultquist et
al. 45 showed that oxygen in Cu2O formed at 100° C originated from water as
well as from oxygen gas. Assuming that this also is true at room temperature, the oxide being formed probably contains more defects and water with increasing RH. Lenglet et al. 46 suggested that the Cu2O being formed is
non-stoichiometric. The defects and the water probably influence the transport properties of the oxide resulting in an enhanced oxidation rate.
In summary, Cu2O was formed at an increasing rate of nucleation with
increasing RH. The increased rate of nucleation was probably associated with an increased number of adsorbed water clusters, acting as nucleation sites for Cu2O
formation. The properties of the Cu2O formed might also be affected by the
presence of water on the surface, which leads to the formation of a more defect rich oxide and alters the transport properties of the oxide, thereby leading to a faster rate of Cu2O formation.
What are the roles of O3 and NO2 in SO2-induced atmospheric corrosion of
copper?
The role of SO2 on copper corrosion.
The presence of either O3 or NO2 strongly increases the corrosion rate of copper
in an atmosphere containing SO2. In Paper III, the effects of synergism between
SO2 and either O3 or NO2 on the initial corrosion of copper were explored.
Exposing copper to 200 ppb SO2 and 80% RH resulted in the formation of Cu2O
and copper sulfite (CuSO3•xH2O). Systematic experiments showed that the rate
of formation of CuSO3•xH2O was independent of surface condition, such as the
thickness of the Cu2O layer, or even a pre-exposure to 40% RH and 200 ppb
SO2. Persson and Leygraf 39
adopted a concept developed by Stumm and coworkers 47 concerning the dissolution of minerals in contact with water. This concept assumes that bisulfite ions, formed when SO2 dissolves in the
physisorbed aqueous adlayer (step 1 in Figure 17), interact with the hydroxylated surface, thereby forming surface bound copper sulfite complexes (step 2 in Figure 17). These complexes are in equilibrium with the bisulfite ions, but slowly dissolve into the aqueous adlayer and precipitate onto the surface as CuSO3•xH2O (step 3 in Figure 17). In step 3, the detachment process is the
OH Cu SO2 HSO3- + H + SO3 Cu CuSO3 Atmosphere Aqueous adlayer Solid 1 2 3
Figure 17 Formation of surface bound copper sulfite. Step 1, dissolution of SO2 in the
aqueous adlayer forming bisulfite ions. Step 2, formation of surface bound copper sulfite complexes. Step 3, consecutive dissolution of the surface bound complexes.
The formation of Cu2O was reduced by the presence of SO2. This effect is
probably connected to the formation of sulfite, which is formed at the expense of Cu2O.
In summary, copper exposed to 80% RH and 200 ppb SO2 forms Cu2O and
CuSO3•xH2O as its main corrosion products. The formation of CuSO3•xH2O
occurs through a rate-limiting dissolution process of surface-bound copper sulfite complexes followed by a consecutive precipitation of copper sulfite at the expense of Cu2O.
The role of O3 in SO2-induced copper corrosion
Exposure to 80% RH, 200 ppb SO2 and 200 ppb O3 led to the relatively rapid
rate of formation of copper sulfate, CuSO4•xH2O and Cu2O. The formation of
sulfate was explored using different exposure schemes. First of all, results from exposure to SO2 followed by exposure to O3, showed that the precipitated
copper sulfite (CuSO3•xH2O) on the surface was partly oxidized to copper
as the O3 concentration was increased, indicating that mass transport of O3 was
the rate-limiting step for this oxidation process.
Subsequent simultaneous exposure to SO2 and O3 resulted in the same constant
rate of formation of copper sulfate as the initial rate of formation in the previous experiment. However, as there could only have been a negligible amount of precipitated copper sulfite, another process for the formation of copper sulfate must exist. O3 SO3 Cu CuSO4 OH Cu SO2 HSO3- + H+ Atmosphere Aqueous adlayer Solid CuSO3 1 2 4 5
Figure 18 Copper sulfate formation through oxidation of copper sulfite. Steps 1-2 illustrate the formation of surface-bound copper sulfite complexes. Step 4 shows the oxidation of precipitated copper sulfite, and step 5 the oxidation of surface-bound copper sulfite complexes to copper sulfate.
Step 5 in Figure 18 illustrates one probable process in which O3 oxidizes surface
bound-copper sulfite complexes to copper sulfate, which immediately detaches from the surface. The detachment of copper sulfate is very fast and hence not rate-limiting as in the case of the detachment of copper sulfite. A third possibility is illustrated by step 6 in Figure 19, where the combination of SO2
and O3 results in acidification of the aqueous adlayer. A more acidic
dissolution). In step 7 of Figure 19, the protons accelerate the detachment of surface-bound copper sulfite complexes, which can then be further oxidized as in step 4. Atmosphere Aqueous adlayer Solid SO3 Cu O3 SO2 HSO3- + H+ SO42- + H+ CuSO3 O H C u O H 2 + Cu Cu+ 6 7 8
Figure 19 Proton promoted dissolution of a hydroxylated copper surface. H+ formed by the oxidation of bisulfite ions in step 6, accelerates the detachment of surface-bound copper sulfite complexes in step 7, and the dissolution of copper in step 8.
The fact that the sulfate-formation processes appeared to be the same irrespective of whether step 3 alone or all of the three steps were possible, indicates that the sulfate-formation process was limited by the mass transport of O3. However, mass transport of SO2 would be rate-limiting if the relative
concentration of O3 increased compared with the concentration of SO2.
In the experiment with simultaneous exposure to SO2 and O3, the rate of
formation of Cu2O was strongly enhanced compared with exposure to pure
humidified air. Two main explanations are offered for this. The first is that the more acidic aqueous adlayer here results in an increased dissolution of copper, (see step 8 in Figure 19). The dissolved copper ions can then react within the
aqueous adlayer and precipitate as Cu2O. The second explanation is that the
copper sulfate formed has no protective properties, therefore the more aggressive environment probably leads to the introduction of defects in the oxide, and thereby to a faster transportation mechanism and ultimately an enhanced rate of oxidation.
In summary, O3 effectively oxidizes copper sulfite species forming copper
sulfate (CuSO4•xH2O). The rate of formation of CuSO4•xH2O was found to be
limited by mass transport of O3, however at increased concentrations of O3,
mass transport of SO2 would be rate-limiting. Simultaneous exposure to SO2 and
O3 increased the rate of Cu2O formation, probably because of the formation of a
more defect-rich oxide in a more acidic aqueous adlayer.
The role of NO2 in SO2-induced copper corrosion.
Exposure to 80% RH, 200 ppb SO2 and 200 ppb NO2 resulted in the formation
of Cu2O, copper sulfate (probably CuSO4•xH2O) and copper hydroxy nitrate,
(probably Cu2NO3(OH)3). The formation of sulfate was explored using different
experimental schemes.
The introduction of NO2 after exposure to SO2, resulted in an oxidation of
CuSO3•xH2O to CuSO4•xH2O in a similar way to the process described in step 4
of Figure 18, although at a much lower rate.
Simultaneous exposure to SO2 and NO2 at 80% RH after exposure to SO2
revealed an initially rapid rate of formation of CuSO4•xH2O, around the same
rate as seen with SO2 and O3. This suggests that the oxidation and dissolution
processes are similar to those of SO2 and O3, including steps 4-8 of Figures 18
and 19. However, roughly three hours after the introduction of NO2 the rate of
formation of sulfate decreased and the formation of copper nitrate started. The reason for this incubation time is unknown, but one possible explanation is that the formation of surface-bound copper sulfite complexes occur initially more
rapidly than the formation of surface-bound copper nitrate. However, once formed, the nitrate complex inhibits the formation of sulfite complexes.
The maximum rate of nitrate formation was one order of magnitude less than the rate of sulfate formation. This may be related to the deposition velocity of NO2
being one order of magnitude less than for SO2 and O3 48
. Hence the formation rateof nitrate can be limited by the mass transport rate of NO2.
The rate of formation of Cu2O was approximately the same, as with the
exposure to SO2, therefore suggesting that a similar process is probably
occurring here.
In summary, Cu2O, CuSO4•xH2O and Cu2NO3(OH)3 were the dominating
corrosion products formed at exposure to a mixture of SO2 and NO2 in a
humidified atmosphere. NO2 was able to oxidize surface copper sulfite species
to CuSO4•xH2O. In addition the formation of Cu2NO3(OH)3 could be followed.
The rate of formation of Cu2O was reduced compared to exposure to humidified
air.
In summarizing the different roles of O3 and NO2 in the SO2-induced corrosion
of copper, O3 can be seen as having a two-fold effect, both participating directly
in the oxidation of copper sulfite species, and also increasing the formation of Cu2O. NO2, on the other hand, reduces the formation of Cu2O and does not
oxidize copper sulfite species as efficiently as O3. In addition a copper hydroxy
nitrate also was formed.
Can metal surfaces catalyze the oxidation of bisulfate ions to sulfate ions in the aqueous adlayer?
In Paper IV, the influence of a catalyzing metal surface on the oxidation of SO2
was investigated using IRAS. Previous studies 39 showed that metal sulfites were formed on copper, nickel and zinc. However, experiments exposing platinum and palladium to 210 ppb SO2 at 80% RH, led to the formation of sulfuric acid
in the aqueous adlayer. The sulfuric acid was transformed to hydrated crystalline sulfuric acid, H2SO4•xH2O, when the experiments were concluded in a dry
atmosphere, illustrating the importance of the metal/atmosphere interface on the surface products formed.
Sulfuric acid was found to form on platinum at approximately the same initial rate as copper sulfate in the copper studies, indicating a mass-transport-limited process, where bisulfite ions immediately oxidize to sulfate ions upon reaching the surface of the platinum. A similar process was observed with palladium, although a period of incubation was observed prior to the commencement of sulfuric acid formation. Although this incubation period is not fully understood yet, it may relate to palladium’s ability to dissolve hydrogen at an order of magnitude greater than other metals, thereby possibly affecting the oxidation rate of bisulfite ions to sulfate ions. In both metals, the rate of sulfuric acid formation decreases as greater amounts were formed, suggesting the formation of a surface film inhibiting the oxidation process.
In summary, the oxidation of sulfur (IV) to sulfate ions on platinum and palladium could be connected to some surface-mediated process. In contrast to copper, nickel and zinc, both platinum and palladium catalyze the reaction.
Future work
The work presented here describes an experimental setup where two previously separate techniques, IRAS and QCM, have been combined into one. This combination has resulted in that new and improved knowledge about the atmospheric corrosion of copper has been obtained. Complementary TM- AFM experiments revealed information about the lateral distribution of the corrosion products formed. However, even though this experimental setup has generated interesting results, the individual techniques used are not state of the art. Improvement in equipment capacity would generate even more substantial results. An improved IR-detector would further advance the detection limit, and
a faster FT-IR spectrometer could improve the time resolution. The addition of further techniques into the system could also produce interesting results. Sum frequency generation (SFG), which is a technique used to study only those molecules at an interface due to the asymmetric environment, could be used to study the surface concentration of copper sulfite complexes. Nevertheless, with the existing setup many challenging research issues are able to be pursued. Currently more experimental data are needed to describe the synergism between SO2 and O3. Variation in the SO2/O3 ratio, and the influence of and the rate of
formation of the various products being formed are also areas requiring further study. The influence of humidity on the formation of Cu2O is not yet fully
understood. These are just a few interesting issues for further investigations. Acknowledgements
I would like to express my sincere gratitude to Prof. Christofer Leygraf for all his support, and for generously, imparting his knowledge, enthusiasm and ideas to me, both on and off the research arena. You have been great!
I am also very grateful to Dr. Inger Odnevall Wallinder for all countless hours spent in fruitful and enjoyable discussion and the critical examination of my work over the past years. You have managed to bring a lot of fun to this work! I wish to express my sincere thanks to Prof. Manfred Schreiner for providing the initiative for our collaboration and for the generous hospitality shown to me during my stay in Vienna.
I wish to thank my fellow PhD student in Vienna, Michael Wadsak for all TM-AFM experiments and professional help during the research work as well as for all the enjoyable extra-curricular visits around Vienna with liters of beer. Prost! I am indebted to Dr. Gunnar Hultquist for numerous discussions, critical questions and private chats.
Thanks too, Dr. Johan Tidblad for discussions concerning surface chemistry and Dr. Dan Persson for all his help with IR-spectroscopy.
I would also like to thank Sofia, Torbjörn, Mikael, Wenle, Jinshan, Jonas and all past and present members of the group for their help with the experiments discussions as well as the many pleasant times spent together and Anders Sjöman for always helping when needed.
Finally, I would like to thank:
Henrik Björkman and my other friends from my days as an undergraduate student in Uppsala, without whom I would never have started this work;
my parents for raising me to enjoy the spirit of learning;
and last but by no means least my wife, Viktoria, for always encouraging me and an infinite number of other reasons.
This work has been financed mainly by the Swedish Research Council for Engineering Science (TFR) and by Disponent Yngströms fond, Brinell Centret and Knut och Alice Wallenbergs stiftelse.
References
1 W. H. J. Vernon, Trans Faraday Soc., 23, 166, (1927) 2 P. A. Thiel and T. E. Madey, Surf. Sci. Rep., 7, 211 (1987) 3 S. Lee and R. W. Staehle, Corrosion, 53, 33 (1997)
4 J. F. Dante and R. G. Kelly, J. Electrochem. Soc., 140, 1890 (1993) 5 S. P. Sharma, J. Vac. Sci. Technol., 16, 1557 (1978)
6 P. B. P. Phipps and D. W. Rice, ACS. Symp. Ser 89,, Am. Chem. Soc., Washington, DC, p 239 (1979)
7 S. Zakipour and C. Leygraf, Br. Corros. J., 27, 295 (1992)
8 P. Eriksson, L. G. Johansson and H. Strandberg, J. Electrochem. Soc., 140, 53 (1993)
9 R. E. Lobnig, R. P. Frankenthal, J. D. Sinclair and M. Stratmann, J.
Electrochem. Soc., 141, 2935 (1994)
10 T. Graedel, K. Nassau and J. P. Franey, Corr. Sci., 27, 639 (1987) 11 T. Graedel, Corr. Sci., 27, 721 (1987)
12 T. Graedel, Corr. Sci., 27, 741 (1987)
13 I. Odnevall and C. Leygraf, J. Electrochem Soc., 142, 3682 (1995)
14 D. Persson, Thesis, Royal Institute of Technology, Stockholm, Sweden (1994) 15 P. V. Strekalov, Y. N. Mikhailovskii and M. V. Danilova, Zasch. Met., 14, 243
(1978)
16 R. Schubert, B. Meagher and C. C. Chang, J. Electrochem. Soc., 142, 3157 (1995)
17 M. Forslund, Thesis, Royal Institute of Technology, Stockholm, Sweden (1996) 18 P. R. Griffiths and J. A. DeHaseth, “Fourier Transform Infrared Spectroscopy”,
John Wiley & Sons, New York (1986)
19 N. B. Colthup, L. H. Daly and S. E. Wiberly, “Introduction to Infrared and
Raman Spectroscopy”, 3rd ed. , p 3, Academic Press, San Diego (1990)
20 B. Nyberg and R. Larsson, Acta Chemica Scandinavica, 27, 63 (1973)
21 M. Alonso and E. J. Finn, “Fundamental University Physics, Volume II, Fields
and Waves”, 2nd ed., Addison-Wesley Publishing Company, Massachusetts
22 A. W. Czanderna and C. Lu, “Application of Piezoelectric Quartz Crystal
Microbalance”, Elsivier, Amsterdam, The Netherlands (1984)
23 G. Sauerbrey, Z. Phys., 155, 266 (1959)
24 D. W. Rice, P. B. P. Phipps and R. Tremoureux, J. Electrochem. Soc., 127, 563 (1980)
25 M. Rodahl and B. Kasemo, Sensors and Actuators A, 54, 448 (1996)
26 G. Binnig, H. Rohrer, C. Gerber and E. Weibel, Phys. Rev. Lett., 50, 120 (1981) 27 G. Binnig, C. Quate and C. Gerber, Phys. Rev. Lett., 56, 930 (1986)
28 K. Siegbahn, C. Nordling, A. Fahlman, R. Nordberg, K. Hamrin, J. Hedman, G. Johansson, T. Bergmark, S.-E. Karlsson, I. Lindgren and B. Lindberg, “ESCA,
Atomic, Molecular and Solid state structure Studied by Means of Electron Spectroscopy.”, Nova Acta Regiae Societatis Scientiarium Upsaliensis, Uppsala,
Sweden (1967)
29 K. Siegbahn, C. Nordling, G. Johansson, J. Hedman, P. F. Héden, K. Hamrin, U. Gelius, T. Bergmark, L. O. Werme, R. Manne and Y. Baer, “ESCA Applied to
Free Molecules”, North Holland Publ. Co., Amsterdam, The Netherlands (1971)
30 E. Matheisen, Ph. D. Thesis, University of Dortmund, Germany (1993)
31 K. Shimazu, S. Ye, Y Sato and K Uosaki, J. Electroanal. Chem., 375, 409 (1994)
32 J. Itoh, T. Sasaki, M. Seo, and T. Ishikawa, Corr. Sci., 39, 1993 (1997) 33 D. Persson and C. Leygraf, J. Electrochem. Soc., 140, 1256 (1993)
34 P. Eriksson, L. G. Johansson and H. Strandberg, J. Electrochem. Soc., 140, 53 (1993)
35 P. A. Thiel and T. E. Madey, Surf. Sci. Rep., 7, 218 (1987)
36 E. McCafferty, J. P. Wightman and T. Frank Cromer, J. Electrochem. Soc., 146, 2849 (1999)
37 D. Persson, Thesis, pp. 20-23, Royal Institute of Technology, Stockholm Sweden (1994)
38 T. Sasaki, T. Itoh, J. Itoh, T. Ishikawa, Proc 13th Int. Corr. Congress, paper No.
29 (1996)
40 P. Ramamurthy and E. A. Secco, Can. J. Chem., 48, 3500 (1970)
41 D. Persson and C. Leygraf, 12th Scand. Corr. Congress & Eurocorr 92, 667
(1992)
42 M. Lenglet, J. Lopitaux, C. Leygraf, I. Odnevall, J. Guinement, J. Gautier and J. Boissel, J. Electrochem. Soc., 142, 3690 (1995)
43 P. A. Thiel and T. E. Madey, Surf. Sci. Rep., 7, 230 (1987)
44 F. Franks, ”Water”, p. 22, The Royal Society of Chemistry, London (1983) 45 G. Hultquist, L. Gråsjö, Q. Lu and T. Åkermark, Corros. Sci., 36, 1459 (1994) 46 M. Lenglet, K. Kartouni and D. Delahaye, J. Electrochem. Soc., 138, 697 (1991) 47 W. Stumm, Chemistry of the Solid-Water Interface, p 157, Wiley, New York
(1992)
48 C. Leygraf, in “Corrosion mechanisms in theory and practice”, P. Marcus and J. Oudar editors, p 433, Marcel Dekker, New York (1995)