Kalmar ECO-TECH '07 KALMAR, SWEDEN, November 26-28, 2007
CLASSIFICATION CRITERIA FOR
RESTORATION AND POST OCCUPATION OF
WASTE DISPOSAL SITES
Adriana de Schueler
Claudio Mahler
Rio de Janeiro Federal University, Brazil
ABSTRACTIn Brazil, 40.49% [I] of all domestic and public solid waste produced, involves unsuitable disposal. The dynamism of urban space causes a constant succession of soil uses in most Brazilian cities. When a waste disposal site is deactivated, its mere abandon may be hazardous to the environment and communities around it as a result of leachate percolation. Waste dumping sites deactivation with further use, whichever, exposes the population to contamination. This paper proposes an assessment system of areas that were used as urban solid waste disposal sites,. Even if they receive or have received care in terms of environmental protection for some time before their closure, these areas do not normally have documented background on the events occurring there. The proposed assessment establishes criteria for classifying urban solid waste fills whose activities are being closed down and for those that were already closed for a longer period. Indicators of potential environmental and health hazards are used, considering volume of the waste landfill and age; groundwater depth, soil permeability, residences proximity, commercial and industrial centres, environmental topographic and morphological indicators and the water balance. This paper is the result of a two-year field study in Paracambi landfill surrounding areas, close to Rio de Janeiro city. This study included tests of physical characterizations of soil, permeability tests in the field and laboratory, column tests on distribution and spread of pollutants, physicochemical and chemical soil analyses at various depths. Besides, downstream groundwater and surface water were analyzed. The prime purpose was to create a tool to help decide which activities are to reinsert areas used as waste disposal sites in the suitable urban context The result of the assessment will point to different levels of care in relation to the procedures to be adopted with regard to its closure and later monitoring.
KEYWORDS
Environmental Impact, Degradable Areas, Solid Waste Disposition I. INTRODUCTION
The assessment system proposed here is intended for areas that were used as urban solid waste (USW) dumps, nomially with no environmental protection infrastructure, many of them to be found in Brazil. These areas, even if they receive or have received care for some time before closure with a view to environmental protection, normally do not have a documented background on occurrences there. This paper proposes an assessment system of areas that were used as urban solid waste disposal sites, normally with no infrastructure for environmental protection. These areas, even if they receive or have received care in terms of
Kalmar ECO-TECH '07 KALMAR, SWEDEN, November 26-28, 2007
environmental protection for some time before their closure, do not normally have documented background on the events occurring there, Only after the Rio 92 Convention, some early control procedures, albeit modest, were taken by the agencies in charge, on aspects relating to environmental protection against this kind of urban occurrence, A large number of those dumps have been receiving waste for well over ten years, leaving it untreated in the open air with no environmental protection infrastructure.
The proposed assessment system establishes criteria for assessing USW landfills that are about to be closed down and those that have already been closed for a longer period, considering the potential contamination caused by their leachate, The main objective is to reinsert the area in the actual urban context. These areas are rated based on the use of indicators of potential environmental and health hazards. The result of the assessment will indicate the different levels of care in relation to the procedures to be taken concerning their closure and later monitoring,
2. MATRIX
The assessment is done by completing matrices with infonnation about the area. Parameters are adopted relating to potential contamination caused by the leachate in the USW landfill, A rating is obtained by adding up the values obtained in the matrices, and can be a sign of the need for intervention, Depending on the potential generating characteristics of leachate in the landfill and its potential capacity to affect the soil, water, special environmental protection areas and the population, interventions could be required at different levels of care and urgency, and monitoring after closure,
2.1 Assessment of urban solid waste
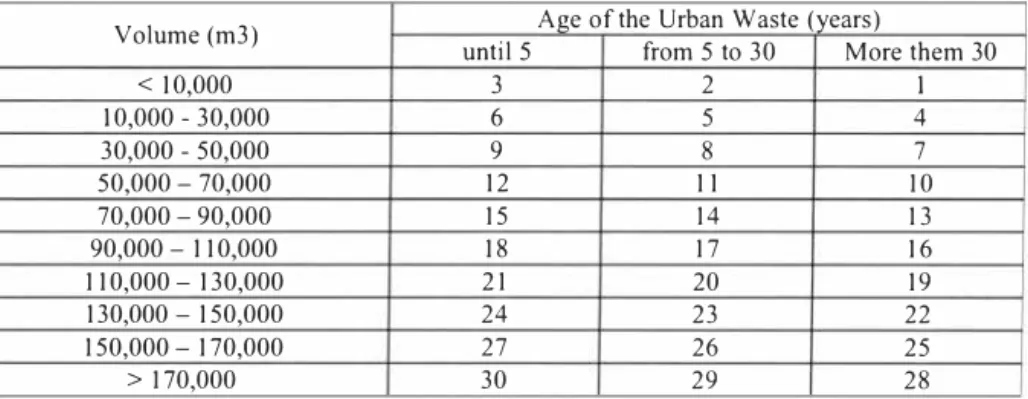
Table I gives the matrix for assessing the potential leachate production, It relates the total volume of the landfill and age of the last waste disposal, Normally there is no background about material deposited in the landfill and the input in many cases is or was not controlled over long periods. Therefore, this paper considers that the urban waste, besides consisting of domestic, commercial and public waste, may also contain waste from small or midsize industrial plants, health service and other sources,
Table 1: Matrix for waste filling assessment
Age of the Urban Waste (years)
Volume (m3) until 5 from 5 to 30 More them 30
< 10,000 3 2 I I 0,000 - 30,000 6 5 4 30,000 - 50,000 9 8 7 50,000 - 70,000 12 11 10 70,000 - 90,000 15 14 13 90,000 - 110,000 18 17 16 110,000 - 130,000 21 20 19 130,000 - 150,000 24 23 22 150,000 - 170,000 27 26 25 > 170,000 30 29 28
Kalmar ECO-TECH '07 KALMAR, SWEDEN, November 26-28, 2007
The production of liquor is controlled by the biological decay of the waste, Although the divisions of stages in which the waste is being stabilized do not have strict time limits, three main bands are being considered:
Five years or less: The pollutants borne in the liquor generally reach maximum values in the first years of operating the landfill (2-3 years) and decrease gradually during the next few years, This tendency is generally applicable to dissolved organic matter and principal inorganic ions (heavy metals, chloride, sulphate, etc.) [2, 3].
Five to thirty years: The speed of the waste's decay after it reaches its maximum continues slowly downwards for 25 years or so [4]. These values were found from gas measurements. Over 30 years: No analyses were found in literature on leachate concentration in an urban solid waste landfill over 30 years old. At this age, it is now not expected to produce a significant amount of gas, which indicates that the stabilization process of the waste is considerably advanced, affecting the reduction of leachate production,
Matrix I values were attributed from I to 30, linearly, so that for the same volume of waste, the older options were rated lowest
2.2 Assessment of landfill base
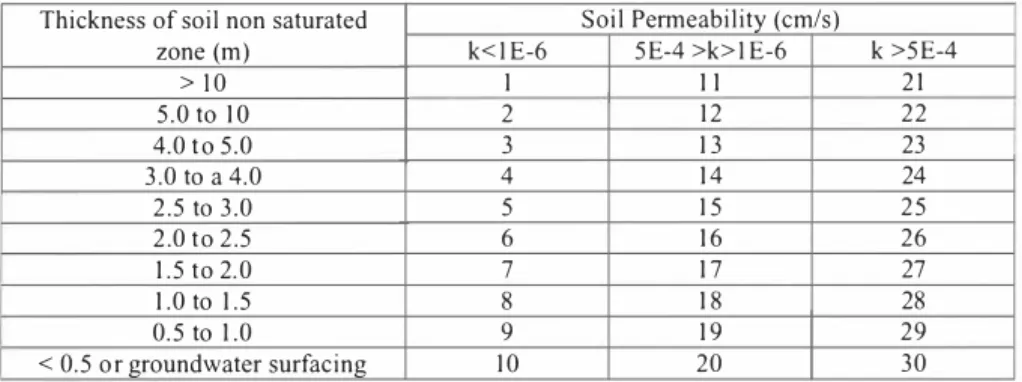
Table 2 presents the matrix for assessing the landfill base, This matrix gives values relating to penneability and thickness of the unsaturated soil band under the landfill, Its objective is to rate the leachate's capacity to reach the aquifer,
The depth of the groundwater, underground flow pattern, and scope of the regional variation of the groundwater, in accordance with the seasons of the year, quality of underground water and risk of aquifer contamination must be known.
The variation in groundwater is a result principally of the frequency and intensity of rainfall, evapotranspiration, soil permeability and topography, It is therefore possible to conclude that the groundwater level is deeper in arid regions, In general the deeper the groundwater level theoretically the more protected the aquifer, so that the physical, chemical and biological purifications of!eachate liquids are processed, since the unsaturated soil is much thicker, Standard NBR 13896 [5] states as an ideal condition for installing a landfill the place that has a 3m thick layer of homogeneous soil with a permeability coefficient of I E-6 cm/s, It is not advisable to built landfills in areas where a soil with permeability of K = 5E"4 cm/s or more prevails, even if complementary waterproofing is used, Three bands of values for soil permeability are being considered, suggested in the Brazilian standards, For low permeability the value of K < I E-6 cm/s was adopted, medium permeability lies in the interval I E-6 < K < 5E-4 cm/s, and high penneability is considered when K > 5EA cm/s,
Values of matrix 2 were attributed from I to 30, linearly, so that the lowest permeability received the lowest values, In this assessment only permeability is being considered as a characteristic influencing the capacity of the leachate to reach the aquifer, The importance of this parameter has to do with the advective transport of contaminants, responsible for further contamination, when compared to diffusive transport,
Kalmar ECO-TECH ·07 KALMAR, SWEDEN, November 26-28, 2007 Table 2: Matrix.for assessment of landfill base
Thickness of soil non saturated zone (m)
Soil Permeability (cm/s)
k< IE-6 5E-4 >k> I E-6 k >5E-4
>JO 5.0 to IO I 2 1 1 12 2 1 2 2 4.0 t o 5.0 3 I 3 23 3.0 to a 4.0 4 14 24 2.5 to 3.0 5 I 5 25 2.0 to 2.5 6 16 26 1.5 to 2.0 7 17 27 1.0 to 1.5 8 18 28 0.5 to 1.0 9 19 29 < 0.5 or groundwater surfacing IO 20 30
Diffusive transport is an important mechanism in soils with low permeability, as in the case of waste landfill base seals and liners. The soil in the liner may be contaminated through diffusion by the difference in concentration of contaminants between the landfill interior and the surface. The same may occur in the base soil, not only by what is found under the landfill but also on its edge.
2.3. Assessment of use of soil around landfill
Tables 3 and 4 provide matrices for assessing the characteristics of urban zoning in the vicinity of the landfill.
In the soil use assessment matrix in Table 3, it is related to the proximity of occupation and type of population in contact with landfill effluents. Its purpose is to rate the capacity of the effluents to reach the affected inhabitants in the region. Three kinds of use were considered relating to how long people stay on the site: farming, residential and industrial.
Values of matrix 3A were attributed from zero to 20, linearly, so that urban zones where the population's length of stay is shorter and the farther away from the urban solid waste landfill received lower ratings.
Table 3: Matrix.for assessment of urban soil use Distance (m)
Urban Zoning
Agriculture Housing and Garden Commercial I industrial / services < 100 20 I 9 (+ I) 18 De IO I to 200 17 16 (+ I) 15 De 20 1 to 400 14 13 (+!) 12 De 40 1 to 600 I I 10 (+ I) 9 De 60 1 to 800 8 7 (+]) 6 De 80 I to 1.000 5 4 (+]) 3 > 1,000 2 I (+ I) 0
Kalmar ECO-TECH '07 KALMAR, SWEDEN, November 26-28, 2007
The proximity of the landfill to urban centres provides different levels of human exposure to the waste leachate, This contact may occur by both contamination of the underground and surface water and soil, and by air, through air pollutants from the evaporation of the effluent, Contaminated water might be used for domestic animals and livestock for slaughter, and for watering plants, including vegetable gardens, direct contact through wells and even recreation, The surface-contaminated soil when leachate comes to the surface might be used in vegetable plots and gardens and even recreation areas,
Apparently, the concentration of people in a certain physical space accelerates the environmental degradation processes, as normally happens in the case of low-income housing schemes, The interest is due to the fragile sanitary conditions commonly found in the facilities, which causes more susceptibility to the influences of contact with the urban solid waste landfill, The lack of care is normal in such places both in relation to self-protection and environmental protection, very often through the dwellers' lack of infonnation and resources, and also given the difficulty of the public authorities in terms of inspection, When the residential area includes slums and low-income housing one point is added to the equivalent rating,
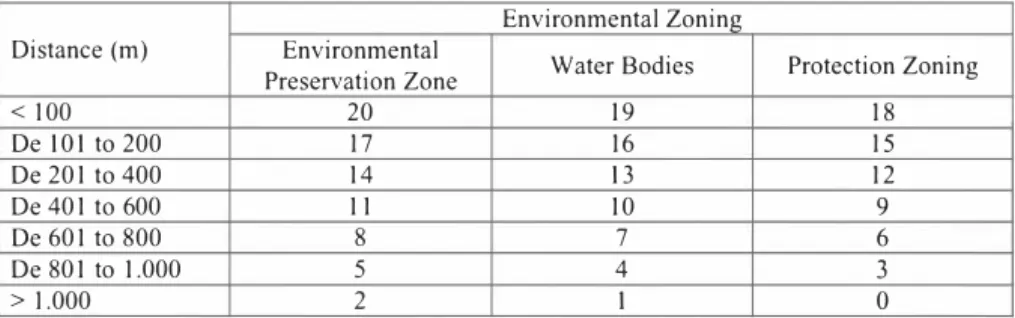
In the assessment matrix of potentially affected natural resources shown in Table 4, they are related to the proximity of the landfill to protected environmental areas or bodies of water. Its purpose is to rate the capacity of effluents to reach special zones concerning the natural environment
Urban regions that, according to their characteristics and type of vegetation have been considered as Environmental Preservation Zones are intended for preservation and recovery of ecosystems, As a consequence, it may ensure proper maintainance of the species diversity offering refuge to the fauna and protecting springs and headwaters, The regions subjected to special urban planning criteria are considered as Protection Zones, which determine the occupation with a higher permeable rate, bearing in mind the public interest in environmental protection,
Matrix 3B was attributed from zero to 20, linearly, so that the zones requiring more protection and those closer to the urban solid waste landfill were given higher ratings,
Table 4: Matrix for assessment of potentially affected natural resources
Distance (m)
Environmental Zoning Environmental
Preservation Zone Water Bodies Protection Zoning
< 100 20 19 18 De IOI to 200 17 16 15 De 20 1 to 400 14 I 3 12 De 40 1 to 600 1 1 10 9 De 60 1 to 800 8 7 6 De 80 1 to 1.000 5 4 3 > LOOO 2 I 0
Kalmar ECO-TECH '07 KALMAR, SWEDEN, November 26-28, 2007 2.4. Assessment of the topography in the region
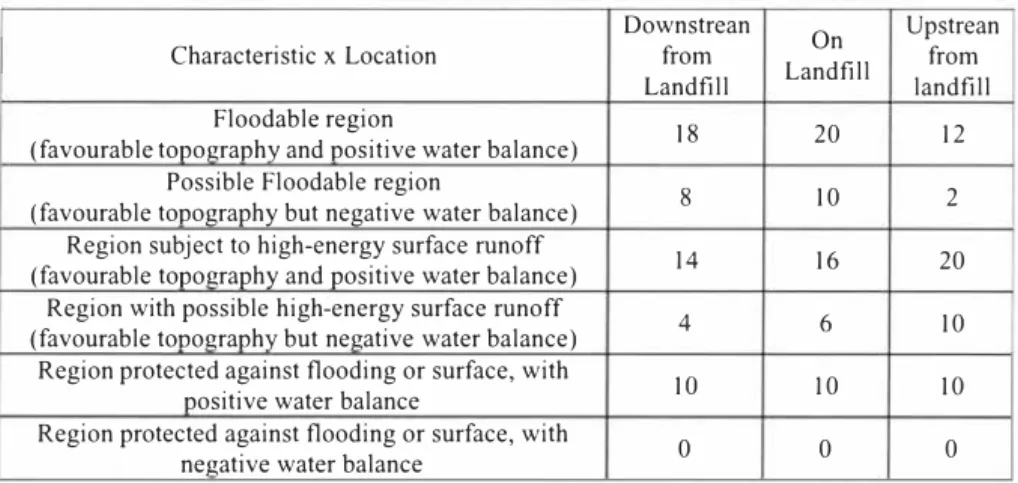
Table 5 shows the matrix for assessing surface hydrology. This matrix relates to the dynamics of surface hydrology capacity for flooding or surface runoff, which includes water balance -and its location in relation to the l-andfill. Its purpose is to rate the natural drainage capacity of the liquor and surface runoff water.
Table 5: Matrix for assessment of surface hydrology
Characteristic x Location Downstrean from Landfill On Landfill Upstrean from landfill Floodable region
(favourable tooograohv and oositive water balance) I 8 20 12 Possible Floodable region
(favourable tooography but negative water balance) 8 10 2 Region subject to high-energy surface runoff
(favourable toooErraphy and positive water balance) 14 16 20 Region with possible high-energy surface runoff
(favourable toooErraohv but negative water balance) 4 6 10 Region protected against flooding or surface, with
oositive water balance IO 10 10
Region protected against flooding or surface, with
negative water balance 0 0 0
Topographic information, consisting of geomorphologic compartmentalisation, the characteristics of the units comprising relief, land slope and main processes acting on the region, such as: erosion, landslide, flooding, and so on, must be analysed since there is a close relation between the relief and increase in environmental problems. Areas with little slope but with a natural difference in level or rise to minimise the surface water runoff into the landfill are recommended.
Climate conditions must be considered. The monthly water balance calculated from data such as flood records, rainfall, sunlight and evapotranspiration is of the utmost importance for effluent generation in an urban solid waste landfill. Areas with heavy rainfall may increase the production of leachate.
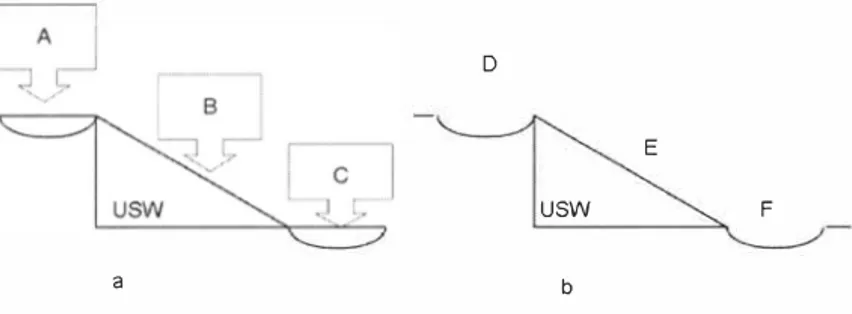
Floodable region is understood (Figure I a) to be where the water balance is positive at some time of the year and the topographical characteristics are prone to flooding. In flooded places seepage and evaporation tend to occur.
A
➔
When this occurs around the landfill upstream, seepage tends to act as a recharge of the aquifer with non-contaminated water through the leachate that, in principle, can be considered a positive aspect. However, preferential flows may occur into the landfill, which may increase its moisture.B ➔ When the situation occurs on the landfill, seepage tends to increase its moisture and consequently the production of leachate.
Kalmar ECO-TECH '07 KALMAR, SWEDEN, November 26-28, 2007
C ➔ When the same situation occurs downstream from the landfill the flooded site may be contaminated by landfill leachate. In this case, the liquid may infiltrate to cause contamination of the topsoil until it reaches the aquifer or evaporates, which is shown to be quite a negative aspect.
D
E
usw F
a b
Figure 1 a and b: Diagram of alternatives of the jloodable region category
Here the Possibly Floodable Region, (Figure I b) is where the topographical conditions permit water flooding. However, since it is a region where the water balance is negative, it is unlikely that flooding occurs at the site. Nevertheless, there is always the possibility of future climate change. Items D, E and F are similar to A, B and C in relation to topography, differing in the water balance, which is negative and is not prone to flooding.
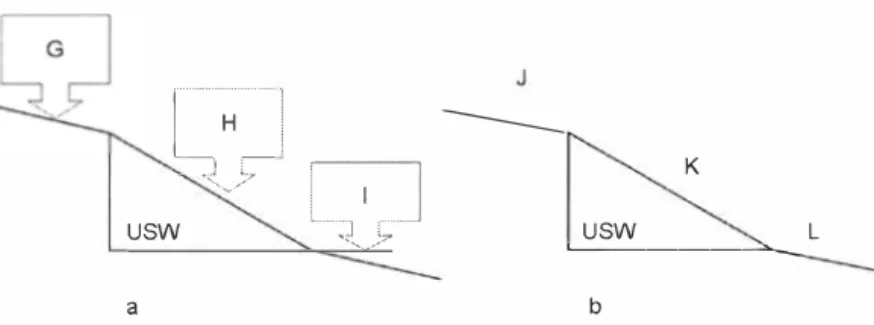
The Region Liable for Surface Runoff with High Energy Flow (Figure 2a) is where the water balance is positive at some time of the year and the sloping topographic characteristics are prone to strong surface runoff.
G ➔ When this occurs upstream from the landfill, an increase in water affecting the landfill may be noted, contributing to further leachate formation, which is a negative aspect.
H ➔ When this occurs on the landfill, an increase in erosion on the landfill's top layer may occur, which is a negative aspect.
I ➔ When this occurs downstream, the surface runoff that may be contaminated by the leachate will tend to go longer distances faster, which is also a negative aspect.
Here, Region subject to Possible Surface Runoff (Figure 2b) is considered, which is where the topographical conditions permit runoff. But this is unlikely because the water balance seems to be negative throughout the year. The conditions are similar to those in the preceding item if there is water. Items J, Kand L are similar to G, H and I in relation to topography, differing in the water balance, which is negative and not providing for surface runoff.
KALMAR, SWEDEN, November 26-28, 2007
[":l.
�v7 � Kusw
,
7
�u_sw______ L
a b
Figure 2. Diagram of the alternatives of the catego1y region subject to swface runoff with high-energy jlow:(a) Region liable for Swjace Runoff; (b) Region subject to Possible Swface Runoff
The Region Protected against Flooding or Strong Surface Runoff is an area where the topographical conditions are against flooding or strong surface runoff, even when there is a lot of water. When considering the landfill surroundings both up and downstream, no or very little water will be contributed to the area. The same does not occur when the water balance is positive.
When values were attributed from zero to 20, with multiples of 2, under the qualitative criterion (e.g., potential hazard of a floodable region on the landfill is similar to that of a region prone to surface runoff with high energy upstream from the landfill, both rated 20 points. The two situations are considered more serious than a floodable region downstream from the landfill, which was rated 18 points). The worst conditions are those with a positive water balance, rated between 10 and 20. Similar conditions, however, with the negative water balance, were rated IO points less than those with regard to the positive water balance. 3. RATINGS
The values were distributed in the matrices so that matrix 1, referring to the potential liquor production, and matrix 2, referring to the capacity of leachate to reach the aquifer, each contribute with 30% of all ratings. Matrix 3 (A + B), referring to the natural resources and population potentially affected by the contact with the effluent, contributes with 20% of all ratings. Matrix 4, referring to the climate conditions influencing the production of effluent and in topographical conditions that affect the natural drainage capacity of the liquid coming to the surface or with surface runoff, contributes with 20% of all ratings. Total points will be: Matrix I + Matrix 2 + (maximum value found in matrices 3A + 38) + (maximum value found in Matrix 4)
The result will be used to classify the area in three categories, identified as Green, Yellow and Red, which are related to the levels of post-closure environmental care. The limit values of the categories were given by adding up the values considered low, medium and high in the matrices. The quality reference value is considered to be the natural concentration of a substance in the soil and underground water in the region, which had no contact with leachate. Under 20 points: Green category
➔
The initial assessment indicates landfills whose potentialKalmar ECO-TECH '07
KALMAR, SWEDEN, November 26-28, 2007
chemical analyses of the underground water, whose results must show concentration values that do not exceed regional references,
Post-closure actions:
a) Quarterly monitoring of underground water for one year, in order to identify critical periods in relation to the possible presence of contamination,
b) Annual monitoring with chemical analysis of the underground water for five years, 21-60 points: Yellow category
➔
The initial assessment shows landfills whose potential environmental contamination caused by its leachate is considered average, This is confirmed by chemical analyses of underground water, whose results show a higher concentration than the regional references.Post-closure actions: Actions are required to protect the local environment
Quarterly groundwater monitoring during one year in order to identify critical periods regarding aquifer contamination.
Six-month period of groundwater monitoring with chemical analyses, It should be done until the results show values that do not exceed the regional references,
After this, instructions for Green b category must be followed,
61-100 points: Red category ➔ The initial assessment shows landfills whose potential environmental contamination caused by its leachate is considered high, This is confinned by means of chemical analyses of the underground water, whose results must show concentration values equal to or higher than the Maximum Pem1issible Values for the substances, pursuant to the Ministry of Health Rule 518.
Post-closure actions: Urgent actions are required to protect the local environment
Quarterly monitoring of the underground water with chemical analyses until the results show lower concentration values of contaminants than the Maximum Pennissible Values for the substances as stated in the Ministry of Health Rule 18 for hannful substances present in the leachate.
4, CONCLUSIONS
After performing the initial assessment of the area and diagnosing environmental hazards, (identifying air pollution, presence of waste collectors and animals, no compacted cover, scattered waste, breeding ground for mosquitoes, groundwater contamination, exposed populations, etc.) and information obtained about the presence of leachate and its influence on its surroundings, it is important to consider the necessary level of recovery. Normally the measures to be taken are installation of a surface drainage system, removal of waste close to watercourses or when the landfill is near flooded areas, the implementation of a percolate drainage system, installation of gas drainage, re-sloping and covering the waste.
A site that has been used as a USW dump may continue producing effluents and contaminating the surroundings for years afterwards. Measures must be taken to diminish the production of leachate and monitor the grounwater of the surrounding area, even after taking remedial actions. It should be considered that sites that were used for waste disposal, after
Kalmar ECO-TECH '07 KALMAR, SWEDEN, November 26-28, 2007
closed; sometimes it becomes areas of potential interest to be occupied by the low economic class population, Therefore it is important that those sites do not be simply abandoned, but instead, it should have an adequate destiny within the urban context, being inspected to avoid their irregular occupation,
ACKNOWLEDGEMENTS
The authors thank CNPq for the financial support. REFERENCES
[1] ABRELPE - Associa9ao Brasileira de Empresas de Limpeza Publica e Residuos Especiais (2005), Panorama dos residuos s6lidos no Brasil, Sao Paulo-SP; available on www.abrelpe.com.br [Brazilian Association of Public Cleaning and Special Waste Companies. Overview of solid waste in Brazil],
[2] lPT/CEMPRE (2000), Lixo Municipal: manual de gerenciamento integrado, 1 • ed. Sao Paulo: lnstituto de Pesquisa Tecnol6gicas/1PT; [Selection of areas for disposal of urban solid waste and proposed sanitary landfill in lguape county, Sao Paulo].
[3] ANDREOTTOLA G, & CANNAS P. (1997), Chemical and biological characteristics of landfill leachate in Landfilling of waste: Leachate, T.H, Christensen, R. Cossu and R. Stegman (editors), 1997, pp 65-88.
[4] TCHOBANOGLOUS, G,, THEISEN, H. & VIGIL, S (1994). Gestion integral dos residuos s6lidos [Integrated solid waste management] 1 ed. Madrid: McGraw-Hill, Inc, v(s).1-2, I 106p, (in Spanish),
[5] ASSOCIA<;:AO BRASILEIRA DE NORMAS TECNICAS - ABNT (1997), Aterros de residuos naoperigosos Criterios para projetos, implanta9ao e opera9ao -Procedimento, Rio de Janeiro, (NBR-13896). [Brazilian Technical Standards Association, Non-hazardous waste landfills - Criteria for designs, implementation and operation - Procedure],
[6] SANCHEZ, L (2001 ), Desengenharia - o passivo ambiental na desativa9ao de empreendimentos industriais, Edusp, Sao Paulo, 253p [De-engineering - the environmental liabilities in deactivating industrial projects],