Canadian and Swedish
Safeguards Support Programmes
DEVELOPMENT OF A HIGH SENSITIVITY
DIGITAL CERENKOV VIEWING DEVICE
PROTOTYPE DIGITAL CERENKOV VIEWING DEVICE
FIELD TEST IN SWEDEN
DEVELOPMENT OF A HIGH SENSITIVITY
DIGITAL CERENKOV VIEWING DEVICE
PROTOTYPE
DIGITAL CERENKOV VIEWING DEVICE
FIELD TEST IN SWEDEN
Prepared for the Canadian Safeguards Support Program and the Swedish Support Program
by
J.D. Chen1, A.F. Gerwing1, P.D. Lewis2, M. Larsson3, K. Jansson3, B. Lindberg4, E. Sundkvist5, M. Ohlsson6
1Channel Systems Inc., 402 Ara Mooradian Way, Pinawa, Manitoba R0E 1L0, Canada 2Canadian Nuclear Safety Commission, 280 Slater Street, Ottawa, Ontario K1P 5S9, Canada 3Swedish Nuclear Power Inspectorate, Klarabergsviadukten 90, SE-106 58 Stockholm, Sweden
4LENS-TECH AB, Fäbodgatan 26, 931 56 Skellefteå, Sweden
5Sigma Design and Development, Telegrafgatan 8A, SE-169 84 Stockholm, Sweden 6Central Interim Storage Facility for Spent Fuel, SE-572 83 Oskarshamn, Sweden
2002 May 15 SKI: ISSN 1104-1374 ISRN SKI-R-02/25-SE CSSP TASK ID: DV011 IAEA TASK: JNT/A704
i
CANADIAN NUCLEAR SAFETY COMMISSION AND SWEDISH NUCLEAR POWER INSPECTORATE
DISCLAIMER
The information provided in this publication is subject to the following provisions and any use of the information will constitute acceptance of these provisions.
The Canadian Nuclear Safety Commission and Swedish Nuclear Power Inspectorate are not responsible for the accuracy of the statements made nor the opinions
expressed in this publication, and neither the Commission, Inspectorate nor the authors nor their contractors subcontractors, consultants, and agents assume any liability with respect to any damage or loss of any kind incurred as a result of the use or disclosure of the information contained in this publication whether based on contract, tort including negligence, strict liability, or otherwise.
The Canadian Nuclear Safety Commission, Swedish Nuclear Power Inspectorate and its contractors, subcontractors, consultants, and agents make no warranties in connection with the information provided in this publication, and all merchantability, fitness for purpose, freedom from the infringement of patents or other privately held rights and including any warranties as to the accuracy, completeness, or usefulness, or the use or the results of the use of any of the information provided in this publication.
CSSP Report 123 SKI Report 02:25
ii
Document Revision History
iii
ABSTRACT
The Swedish and Canadian Safeguards Support Programs have developed a prototype Digital Cerenkov Viewing Device (DCVD) to verify long-cooled spent fuel. The instrument consists of a camera system and a custom portable computer equipped with a liquid crystal and a wearable heads-up display. The camera was coupled to a hardware user interface (HUI) and was operated with a computer program designed to image spent fuel and store the images. Measurements were taken at the CLAB facility on pressurized-water reactor fuel and non-fuel assemblies, a number of boiling-pressurized-water reactor fuel
assemblies, and long-cooled Ågesta fuel assemblies.
The camera head, attached to the HUI, a battery-operated computer carried in a backpack and the heads-up display were field tested for portability. The ergonomics of this system is presented in the report. For the examination of long-cooled spent fuel, the camera head was mounted on a bracket that rested on the railing of a moving bridge.
The DCVD instrument is approximately 100 times higher in sensitivity than the Mark IVe CVD. The oldest fuel with the lowest burnup at the CLAB facility was positively verified. The measurement capability of this instrument greatly exceeds the verification criteria of 10 000 MWd/t U and 40 years cooling.
CSSP Report 123 SKI Report 02:25
v
TABLE OF CONTENTS
1 INTRODUCTION ...1 2 INSTRUMENTATION...1 2.1 GENERAL...1 2.1.1 Railing Bracket...22.1.2 Hardware User Interface and User Software...3
2.2 COMPUTER AND DISPLAY SYSTEMS...3
2.3 CCD DETECTOR...4
2.3.1 Detector Characteristics ...4
2.3.2 Quantum Efficiency and Cooling...6
2.3.3 Dark Current and Readout Noise ...6
3 EXPERIMENTAL RESULTS ...7
3.1 ERGONOMIC TESTS...7
3.2 PERFORMANCE CHARACTERISTICS OF THE DCVD INSTRUMENT...8
3.2.1 Influence of Binning of DCVD Image on Image Quality ...8
3.2.2 Effect of Thermal Electric Cooling of the CCD Chip on Image Quality ...10
3.2.3 Effect of Choice of Lens on Image Quality...11
3.3 CERENKOV CHARACTERISTICS OF FUEL ASSEMBLIES...12
3.3.1 Cerenkov Characteristics of PWR Spent Fuel Assemblies ...12
3.3.2 Cerenkov Characteristics of SVEA-100 BWR Fuel Assembly...14
3.4 CERENKOV CHARACTERISTICS OF PWR NON-FUEL ASSEMBLIES...15
3.4.1 Skeleton PWR Non-Fuel Assembly ...15
3.4.2 Helium PWR Non-Fuel Assembly ...17
3.4.3 High-density PWR Non-Fuel Assembly ...19
3.5 DIFFERENT CERENKOV CHARACTERISTICS BETWEEN SPENT PWR FUEL AND NON-FUEL ASSEMBLIES..21
3.6 PHOTON FLUX INTENSITIES FROM DCVD MEASUREMENTS...21
3.7 FUEL ASSEMBLIES WITH MISSING FUEL RODS...22
3.8 DCVD MEASUREMENTS OF LONG-COOLED FUEL ASSEMBLIES...22
3.8.1 Long-cooled BWR Fuel Assembly ...23
3.8.2 Long-cooled Ågesta Fuel Assemblies ...24
3.9 DCVD MEASUREMENTS OF ÅGESTA FRESH-FUEL ASSEMBLY...25
3.10 DCVD MEASUREMENTS OF LONG-COOLED ÅGESTA FUEL USING THE 105-MM LENS...26
4 DISCUSSION...27
4.1 ERGONOMICS OF DCVD INSTRUMENT...27
4.1.1 Liquid Crystal Display ...27
4.1.2 Head-Mounted Display ...28
4.1.3 Hardware User Interface ...28
4.1.4 Computer...28
4.1.5 Railing Bracket...29
4.1.6 Backpack and Cables...29
4.1.7 Sensitivity...29
4.2 QUANTIZATION...30
4.3 SCANNING FUEL ASSEMBLIES...30
4.4 FALSE-COLOUR IMAGING...31
4.5 TRAINING...31
4.6 FUTURE WORK...31
5 CONCLUSIONS...31
6 ACKNOWLEDGEMENTS ...32
CSSP Report 123 SKI Report 02:25
vi
LIST OF FIGURES
Figure 1: Data acquisition system used to obtain Cerenkov images... 2
Figure 2: DCVD Components ... 3
Figure 3: Railing Bracket Mounted on Bridge... 4
Figure 4: Hardware User Interface on the Railing Bracket... 5
Figure 5: User Interface Screen... 5
Figure 6: Marconi CCD47 frame transfer chip ... 6
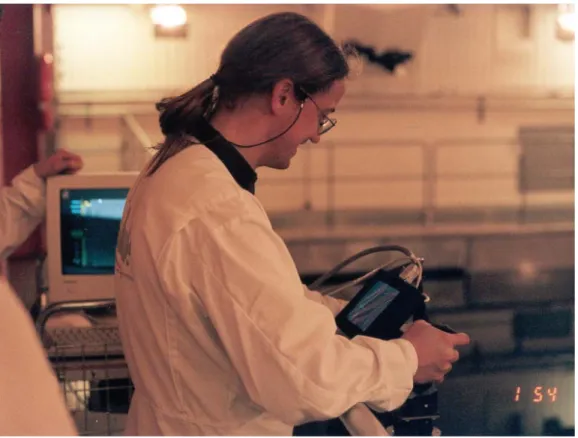
Figure 7: Handheld operation using the LCD screen ... 8
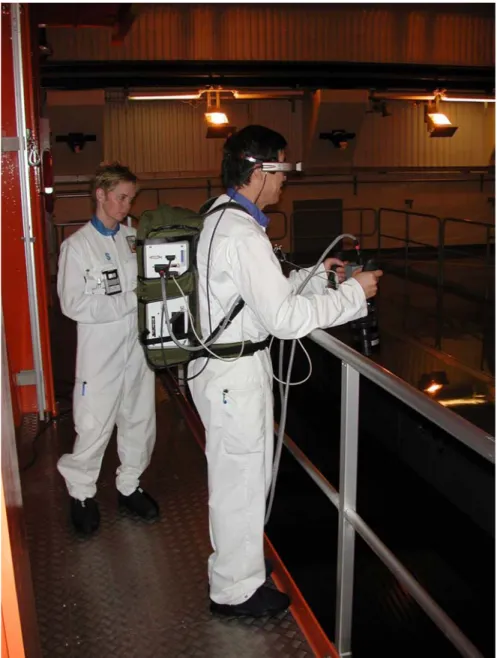
Figure 8: Handheld operation using the HMD ... 9
Figure 9: Image quality as a function of binning: PWR fuel assembly 33M, burnup 44 000 MWd/t U, cooling time 2 years, 250-mm lens ... 10
Figure 10: Image quality and binning: BWR fuel assembly 19078, SVEA-100 design, burnup 43 000 MWd/t U, 2-year cooled, 250-mm lens... 11
Figure 11: Effect of temperature on image quality: PWR fuel assembly W18, burnup 50 000 MWd/t U, cooling time 2 years, binning 1 × 1, integration time 10 s, 250-mm lens. Contrast has been altered to highlight noisy pixels... 12
Figure 12: PWR fuel assembly 0C2: 34 000 MWd/t U, 14-year cooled, exposure time 10 s, binning 1 x 1, (a) 105-mm lens, (b) 250-mm lens, (c) enlargement of the 105-mm lens image... 13
Figure 13: PWR fuel assembly 33M: burnup 44 000 MWd/t U, cooling time 2 years, binning 1 x 1, exposure time 10 s, 250-mm lens, (a) grey-scale and (b) false-colour image ... 14
Figure 14: PWR fuel assembly W18: burnup 50 000 MWd/t U, cooling time 2 years, binning 1 x 1, exposure time 10 s, 250-mm lens, (a) grey-scale and (b) false-colour image ... 14
Figure 15: SVEA-100 fuel assembly 19078: burnup 43 000 MWd/t U, cooling time 2 years, binning 1 x 1, exposure time 10 s, 250-mm lens, (a) grey-scale and (b) false-colour image ... 15
Figure 16: PWR skeleton non- fuel assembly: (a) camera image exposure time 1/5 s, (b) Mark IVe CVD image, exposure time 1 s, (c) DCVD grey-scale image, binning 1 x 1, exposure time 10 s, 250-mm lens, (d) DCVD false-colour image ... 16
Figure 17: PWR helium non- fuel assembly: (a) camera image, exposure time 1/3 s, (b) Mark IVe CVD image, exposure time 1 s, (c) DCVD grey-scale image, binning 1 x 1, exposure time 10 s, (d) false-colour image. A 250-mm lens was used to acquire CVD and DCVD images... 17
Figure 18: PWR fuel assembly 0C2: burnup 34 000 MWd/t U, cooling time 14 years, exposure time 10 s, 250-mm lens, (a) aligned and (b) off-alignment 10 cm left and (c) PWR helium non-fuel assembly aligned, and (d) off-alignment 10 cm left ... 19
Figure 19: PWR high-density, non- fuel assembly: (a) camera image, (b) Mark IVe CVD image, exposure time 1 s, (c) DCVD grey-scale image, binning 1 x 1, exposure time 10 s, (d) false-colour image. CVD and DCVD images taken with the 250-mm lens. ... 20
Figure 20: Measured pixel intensities for 4 PWR fuel assemblies plotted against cooling time... 22
Figure 21: BWR fuel assembly 1059: burnup 16 000 MWd/t U, 21-year cooled, 250-mm lens, (a) CVD image, (b) DCVD image, binning 1 × 1, exposure time 10 s, (c) false-colour image... 23
Figure 22: Plots of photon flux as a function of cooling time for a range of burnups. The open square indicates the IAEA target. Other points indicate photon flux intensities of BWR and Ågesta fuel assemblies measured with the DCVD... 24
vii
Figure 23: BWR fuel assembly P80: burnup 5400 MW/t U, cooling time 24 years, (a) camera image, exposure time 1/2 s, (b) Mark IVe CVD image, exposure time 1.9 s, (c) DCVD grey-scale image, exposure time 10 s, binning 1 x 1, (d) false-colour image. The 250-mm lens was used to acquire Cerenkov images.25 Figure 24: Ågesta fuel assembly 03052: burnup 1200 MWd/t U, 29-year cooled, (a) camera image of basket (31 assemblies), (b) camera image of assembly, (c) Mark IVe CVD image, (d) DCVD image, binning 1 x 1, exposure time 10 s, (e) DCVD image, binning 4 x 4, exposure time 5 s. The 250-mm lens was used to acquire Cerenkov images. ... 26 Figure 25: (a) Ågesta fuel assembly 03129: burnup 1130 MW/t U, cooling time 29 years, binning 4 x 4, exposure time 5 s, (b) Ågesta fresh-fuel assembly F3, binning 4 x 4, exposure time 5 s. The 250-mm lens was used to acquire both images... 27 Figure 26: Ågesta fuel assembly 03129: burnup 1130 MWd/t U, cooling time 29 years, binning 2 x 2, exposure time 20 s, (a) 105-mm lens image, (b) 2½-time digital zoom ... 28
Page 1 of 32
1 INTRODUCTION
In 1993 the Swedish and Canadian Safeguards Support Programs began a joint program to develop a high sensitivity Cerenkov viewing device. A commercial instrument was purchased from AstroCam (Cambridge, UK) and subsequently tested at Swedish nuclear facilities. The solid-state sensor was a scientific charge-coupled device (SCCD) and the instrument was called the Concept SCCD Cerenkov viewing device (CVD). The results of these tests were documented in three reports1, 2, 3. The concept system used a front-illuminated 512 × 512 pixel frame-transfer charge-coupled device (CCD) coated with a lumogen to permit the measurement of weak ultraviolet (UV) light generated by gamma radiation from spent nuclear fuel. This CCD had a UV light quantum efficiency of 8%. The results of the concept SCCD CVD studies demonstrated a number of advantages over the Mark IVe CVD. New Cerenkov characteristics were observed because of the low noise and the higher resolving power of the instrument. It had the ability to verify longer-cooled fuel, to store Cerenkov images in a digital format, to quantify Cerenkov light intensity from the spent fuel, and the potential to perform image processing to assist the operator in fuel verification. The Concept SCCD CVD Summary Report3 indicated that a detector with a quantum efficiency of 40% was required to meet the International Atomic Energy Agency’s (IAEA) criteria to verify 40-year-cooled spent fuel with a burnup of 10 000 MWd/t U. The report indicated that the high quantum efficiencies in the UV could be achieved using CCDs that were back thinned and specially coated (anti-reflective). Back-thinned CCDs with UV quantum efficiencies of >50% have been manufactured in limited quantities for astronomers but are not in routine production for commercial use. A camera system was purchased from PixelVision who promised high frame rates with a four-quadrant back-thinned frame transfer chip and a UV quantum efficiency of greater than 40%. However, they failed to produce a chip with the necessary specifications and the order was cancelled.
This report discusses tests using a slow scan camera produced by Andor Technology. It incorporated a Marconi back-thinned, UV-enhanced, 1024 × 1024 frame-transfer CCD with a UV quantum efficiency of 52%. A new portable computer system based upon the PC/104-plus format, a backpack to hold the computer, a hardware user interface (HUI), liquid crystal display (LCD), head-mounted display (HMD), and a railing bracket were developed and fabricated.
The prototype digital Cerenkov viewing device (DCVD) was field tested at the Swedish Central Interim Storage for Spent Fuel (CLAB) on pressurized-water reactor (PWR) fuel and non-fuel, long-cooled boiling-water reactor (BWR) fuel, and Ågesta test reactor fuel assemblies. Cerenkov images taken with the DCVD system are shown in this report. In addition, the assessment of the ergonomics of the handheld operation of the camera, HUI, and the battery-operated computer in the backpack are discussed.
2 INSTRUMENTATION
2.1 General
The prototype DCVD system consisted of a CCD camera system purchased from Andor Technology (Belfast, Northern Ireland) along with the camera’s PCI controller card,
CSSP Report 123 SKI Report 02:25
Page 2 of 32
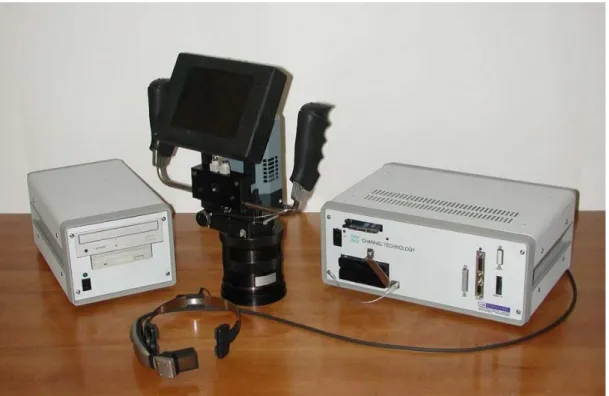
which was used in a custom-built computer. The operating system for the computer is Windows 95, and a software program was written to operate the camera and present the Cerenkov images on a LCD. The schematic of the overall equipment is shown in Figure 1. Cerenkov light passes through the objective lens and a UV-pass filter, producing an image on the CCD located in the detector vacuum housing. The camera head contains a three-stage thermal electric cooler (Peltier cooler), the pre-amplifier, and control electronics for the detector. The custom-designed computer system contains the Andor controller card, solid-state hard drive, a removable memory storage card, and a number of interface boards. Attached to the computer are the LCD and HMD systems.
Camera Computer
Removable Flash Card
Displays Head-Mounted Display LC Display Controller UV Pass Filter CCD/Peltier Cooler Lens
Figure 1: Data acquisition system used to obtain Cerenkov images
Figure 2 shows the DCVD system used in the fieldwork. A 250-mm UV-transmitting lens is shown on the camera; however, the shorter 105-mm UV lens was also used. Andor software was used to acquire the field data, which required the use of a keyboard and mouse.
2.1.1 Railing Bracket
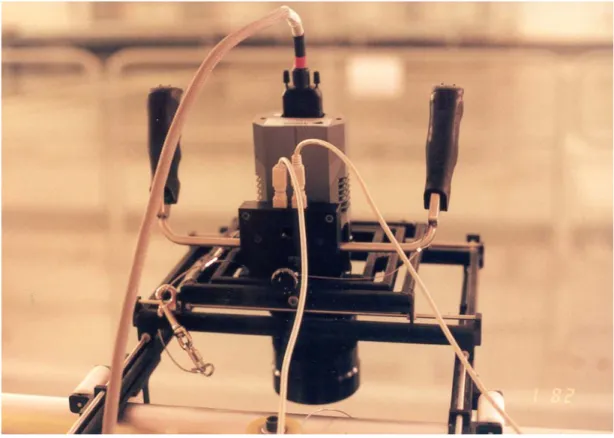
For time exposures, the camera system was mounted on a railing bracket (Figure 3). The bracket was positioned on the bridge railing and weighted to counter-balance the camera head. The railing bracket could be moved along the entire length of the bridge while the camera head could be moved small distances in both x and y directions for positioning directly above the fuel. A gimbals mount for the camera head permitted tilting of the camera head to obtain precise alignment with the fuel assembly.
Page 3 of 32
Figure 2: DCVD Components
2.1.2 Hardware User Interface and User Software
The left handle of the HUI (Figure 4) has 2 buttons used to select menu items up or down the left side of the display screen (Figure 5). The right side of the screen displays the sub-menus. Two buttons on the right handle permit selection of the sub-menu item. A third button on the right handle executes the sub-menu item. In Figure 5, “Display” is highlighted and the sub-menu shows the display choices. If grey-scale is desired, the third button on the right handle makes the selection. The active settings are shown in the status window. The screen also shows the relative light intensity of the measured fuel assembly as a vertical bar on the left side of the image area.
2.2 Computer and Display Systems
The computer was based on PC/104-plus modules. It consisted of a core module (Ampro) 266 MHz Pentium processor (Tillamook) with MMX technology, 64 MB of memory, and a Scandisk 440 MB solid-state hard drive. Additional PC/104 modules included an Ethernet card, video card, PC card interface module, and a PCI adapter board for the Andor controller card. The low power consumption of the computer permitted portable operation for up to 2 h using 2 re-chargeable Li-ion batteries. A 12 V to 5 V DC-DC power converter is included in the computer instrument case. Power for the camera head, also at 5 V, is obtained from the same power supply board. A
115/220 VAC to 12 VDC power supply is housed in a separate instrument box to conform to CE-marking requirements. A floppy disk and CD-ROM drive are also included in this case for use in the field tests. Two display systems were assessed: a 15 cm Phillips LCD screen (640 × 480 pixel) and an Olympus (800 × 600 pixel) HMD.
CSSP Report 123 SKI Report 02:25
Page 4 of 32
Figure 3: Railing Bracket Mounted on Bridge
2.3 CCD Detector
2.3.1 Detector Characteristics
The detector used in the Andor camera is a Marconi CCD47-20 frame-transfer chip. The chip consists of an array of 1024 × 1024 light-sensitive pixels (each 13 µm × 13 µm square, for a total area of 169 mm2) and an equal-sized array of masked pixels
(insensitive to light). Each pixel is a semiconductor detector element. Incident photons create ion-pairs within the pixels (only the electron within the pair is generally
referenced). The electrons are accumulated for a pre-selected integration time at which time the electrons are shifted line by line to the masked area in the chip (Figure 6). The charge in each pixel of each row is shifted to a readout register, and the charge is
converted through an amplifier and an analogue to a digital converter to a digital number. The data are then stored in memory, and the resulting image is displayed on the computer screen (HMD or LCD).
Electrons from several pixels can be added together during the shift procedure. This function is called binning and results in a larger number of electrons per binned pixel for the same incident light flux. The sensitivity is therefore higher but at the expense of image resolution (fewer data points). During the field test, the camera was normally
Page 5 of 32
operated at 1 x 1 binning, although tests for resolution and sensitivity used a series of binning steps.
Figure 4: Hardware User Interface on the Railing Bracket
CSSP Report 123 SKI Report 02:25 Page 6 of 32 Image Area (light sensitive) Store Area (masked) Frame Transfer Readout Register Output Amplifier Figure 6: Marconi CCD47 frame transfer chip
2.3.2 Quantum Efficiency and Cooling
The Marconi chip was back thinned and processed with the BU2 treatment, both of which increase the UV sensitivity. The BU2 process is a complex procedure that involves the removal of the silicon oxide layer from the back-thinned surface. The quantum
efficiency (QE) of the chip at 300 nm, as measured by Marconi, was 52%. This value (confirmed by laboratory measurements) is over 6 times higher than the chip used in the Concept SCCD CVD1.
The camera head contains a three-stage thermal electric cooler (Peltier). The Marconi chip is mounted on the last stage. The cooler is capable of a ∆60°C drop from ambient temperatures. During the field tests, the chip was usually cooled to –20°C.
2.3.3 Dark Current and Readout Noise
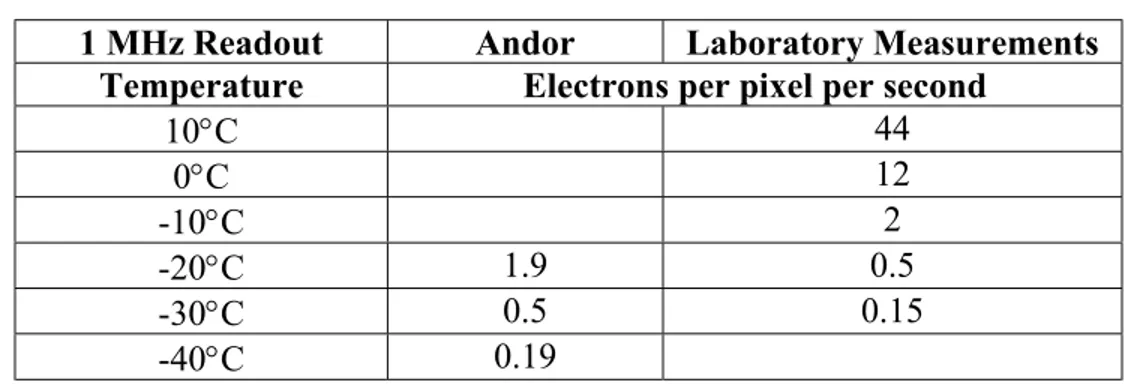
The Andor camera system has a very low dark current. At -30°C, it is only 0.15 e
-•p-1•s-1 (electrons per pixel per second). It rises to only 12 e-•p-1•s-1 at 0°C. Our laboratory values (measured at -20°C and -30°C) were generally 3 times lower than Andor’s values (Table 1).
The readout noise measured, 17 electrons at a readout rate of 1 MHz, was similar to the value obtained by Andor.
The dark current and readout noise at -20°C are sufficiently low that they should not be a factor for imaging very long-cooled fuel.
Page 7 of 32
Table 1: Dark Current Measurements
1 MHz Readout Andor Laboratory Measurements
Temperature Electrons per pixel per second
10°C 44 0°C 12 -10°C 2 -20°C 1.9 0.5 -30°C 0.5 0.15 -40°C 0.19
3 EXPERIMENTAL RESULTS
The DCVD equipment was tested at the CLAB fuel storage site in Oskarshamn, Sweden, from 2001 November 28 to December 2. The ability to handhold the camera and carry the computer system with the LCD screen and HMD was evaluated. Pressurized-water reactor fuel and non-fuel assemblies, BWR fuel and long-cooled BWR fuel, long-cooled Ågesta test reactor spent fuel, and fresh fuel were examined.
The report normally shows camera pictures of the fuel or non-fuel assembly, the
Mark IVe CVD image, and then the DCVD image. The camera pictures were taken with a Nikon COOLPIX 990 digital camera with a 3x tele-extender. For the CVD images, this camera was attached to the Mark IVe CVD. For long-cooled fuel assemblies, it was difficult or impossible to see the Cerenkov image with the Mark IVe although images could still be obtained with time exposure photography.
Because of the digital nature of the data, the brightness and contrast of images reproduced in this report have been scaled to produce good images. It is difficult to directly compare image intensities in this report without examining the unscaled, original data. For example, a long-cooled fuel assembly, which has only a few counts in each pixel to represent its image, can be scaled to look as bright as one from a short-cooled fuel assembly, which has many counts.
3.1 Ergonomic Tests
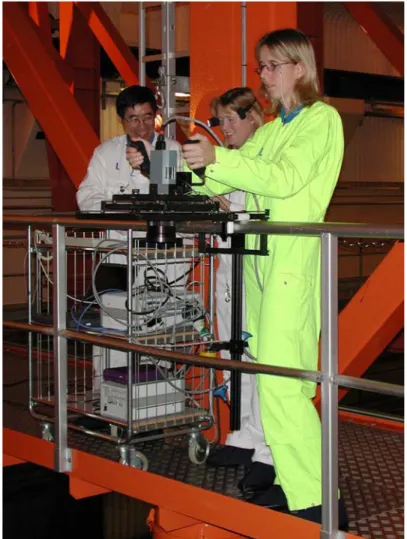
The Mark IVe CVD is normally used in the scanning mode for fuel verification. For the DCVD, handheld operation using the LCD display (Figure 7) was hampered by low frame rates. With frame rates of less than one frame per second, scanning a row of assemblies to dynamically observe the Cerenkov characteristics of the individual fuel assemblies was difficult. Scanning with the railing bracket, while slow, did result in good observation of the expected Cerenkov characteristics. When the camera was mounted on the railing bracket, the LCD screen produced excellent images.
An operator carrying the computer in a backpack, handholding the camera system and wearing the HMD is shown in Figure 8. Both the HUI and backpack were designed for a previous camera system and were not optimized for the current system. The HMD set-up was lighter but handholding for long periods was still difficult. The image quality from
CSSP Report 123 SKI Report 02:25
Page 8 of 32
the HMD was excellent. From a software perspective, it was easy to navigate the menu system and operate the camera while viewing the menu items in the HMD.
Figure 7: Handheld operation using the LCD screen
The computer, while not too heavy, was somewhat bulky. It was primarily designed for the current fieldwork and used a number of components that would not be necessary for a truly portable system. The component layout was not optimized to occupy a smaller volume.
3.2 Performance Characteristics of the DCVD Instrument
Several variables that affect the quality of the Cerenkov image can be used on the DCVD. The three parameters investigated were binning, cooling, and choice of 105- or 250-mm lens.
3.2.1 Influence of Binning of DCVD Image on Image Quality
In the DCVD camera, an array of pixels can be grouped together as a single super pixel in a process called binning. This results, effectively, in an instrument with the same
detector area but fewer detector elements. This increases the photon flux recorded per pixel, while reducing the image resolution. For example, when a binning of 2 × 2 is selected, the number of image points (pixels) is reduced by a factor of 4 and the signal-to-noise ratio increases by a similar factor. Noise was insignificant in the binning
experiment because of the relatively short exposure times and the extremely low noise of the camera system.
Page 9 of 32
Figure 8: Handheld operation using the HMD 3.2.1.1 Binning, PWR Fuel
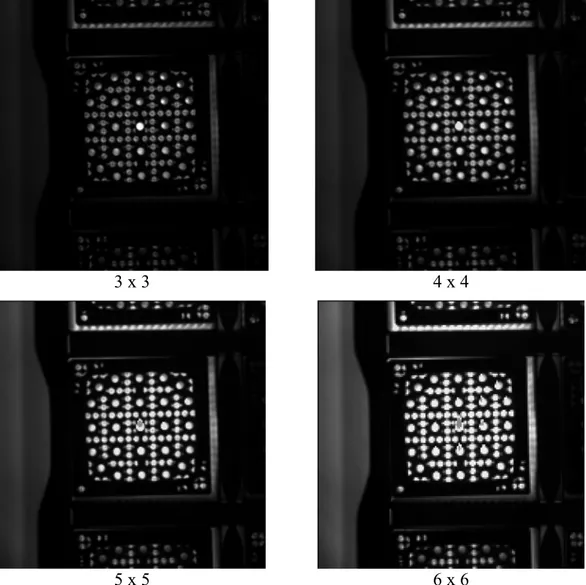
The binned images shown in Figure 9 indicate that 4 × 4 binning still shows excellent resolution. At 5 × 5 binning the decrease in resolution is just detectable; it is quite pronounced at 6 × 6 binning. There is no evidence of increased noise with binning.
CSSP Report 123 SKI Report 02:25
Page 10 of 32
3 x 3 4 x 4
5 x 5 6 x 6
Figure 9: Image quality as a function of binning: PWR fuel assembly 33M, burnup 44 000 MWd/t U, cooling time 2 years, 250-mm lens
3.2.1.2 Binning, BWR Fuel
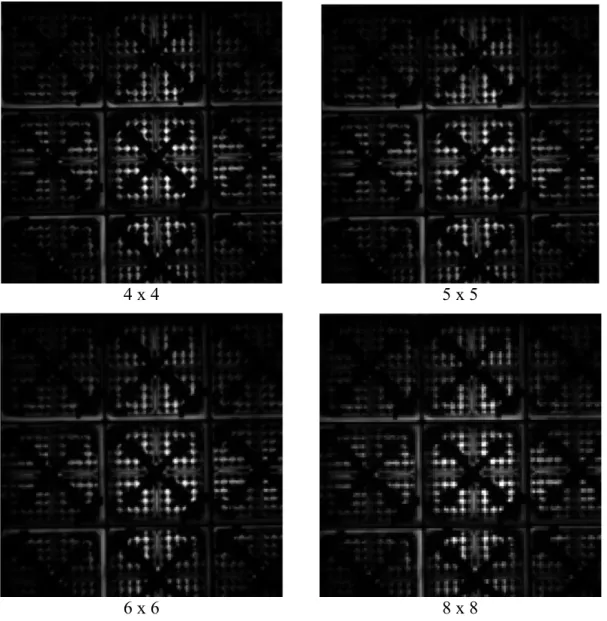
From the images shown in Figure 10, we still see well-resolved images at 5 x 5 binning. At 6 × 6 binning, there is a noticeable decrease in resolution and at 8 × 8 binning, the dark round fuel rods take on a very square-shaped appearance.
3.2.2 Effect of Thermal Electric Cooling of the CCD Chip on Image Quality
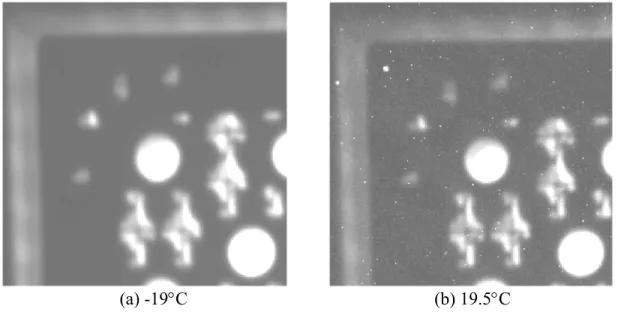
Images of a fuel assembly with a burnup of 50 000 MWd/t U and a 2-year cooling time were taken at various chip temperatures. Two images taken at –19°C and 19.5°C are shown in Figure 11. The integration time was 10 s, and the images were obtained using the 250-mm lens. It is obvious that the dark current and read noise from the chip are very low because at 19°C the image is still excellent. An increase in noise as the temperature increases is observable (Figure 11b) as small bright light spots, but it is not objectionable.
Page 11 of 32
4 x 4 5 x 5
6 x 6 8 x 8
Figure 10: Image quality and binning: BWR fuel assembly 19078, SVEA-100 design, burnup 43 000 MWd/t U, 2-year cooled, 250-mm lens
3.2.3 Effect of Choice of Lens on Image Quality
Cerenkov images of a PWR fuel assembly obtained by the DCVD system using the UV-Nikkor 105-mm lens and the APS UV 250-mm lens were compared.
The image obtained with the 105-mm lens (Figure 12a) shows an array of 9 (3 × 3) fuel assemblies with the DCVD aligned over the centre fuel assembly. The dark round fuel rods are difficult to discern. There are a number of spacer grids located along the length of the fuel assembly that keep the fuel rods and guide tubes separated. These spacer grids cannot be seen. The 250-mm image shows basically one assembly, at very high
resolution. All the details of the Cerenkov image such as fuel rods and the spacer grids (cross-shaped structure between the dark fuel rods) are clearly seen. The digitally enlarged 105-mm lens image (Figure 12c) is almost identical to the 250-mm lens image. The contrast appears to be slightly lower and there is lower resolution, but all the
CSSP Report 123 SKI Report 02:25
Page 12 of 32
Cerenkov characteristics can be clearly identified. For this PWR fuel assembly, the 105-mm lens image, digitally enlarged, produces an adequate image for fuel verification.
(a) -19°C (b) 19.5°C
Figure 11: Effect of temperature on image quality: PWR fuel assembly W18, burnup 50 000 MWd/t U, cooling time 2 years, binning 1 × 1, integration time 10 s,
250-mm lens. Contrast has been altered to highlight noisy pixels.
3.3 Cerenkov Characteristics of Fuel Assemblies
The PWR spent fuel assemblies examined consisted of 17 × 17 and 15 × 15 arrays of fuel rods. A DCVD image of the SVEA-100 BWR fuel assembly is also shown. The pixel intensities can be mapped to different colours, which highlights the intensity differences in the spent fuel. This colour mapping of the image is termed “false colour”. To
illustrate the Cerenkov characteristics of the different fuel assemblies, false-colour images are provided in addition to the normal grey-scale images.
3.3.1 Cerenkov Characteristics of PWR Spent Fuel Assemblies
A DCVD image of a 17 × 17 PWR spent fuel assembly is shown in Figure 13a and the false-colour image in Figure 13b. The fuel has a burnup of 44 000 MWd/t U and a cooling time of 2 years. The image was acquired in a 10-s exposure. The main features are the guide-tube holes (seen as bright round circles), dark round fuel rods, light from between the fuel rods, and the spacer grids (dark thin cross between fuel rods). The prominent feature is the bright centre guide-tube hole.
The false-colour image shown in Figure 13b highlights the very bright centre guide-tube hole and, shown more prominently, is the inner square of central guide tubes, which are brighter than the outer ring tubes. This is a characteristic of a spent fuel assembly. A DCVD image of a 15 × 15 PWR fuel assembly is shown in Figure 14a. The fuel has a burnup of 50 000 MWd/t U and cooling time of 2 years. The exposure time was 10 s. The Cerenkov image looks quite different compared with the 17 × 17 assembly. The centre guide tubes are arranged in a circular pattern rather than a square pattern as in the 17 × 17 array (Figure 13). The dark fuel rods, light between the rods, the spacer grids,
Page 13 of 32
and the small instrument hole in the centre of the assembly can be clearly seen. It is obvious from this image that the inner guide tubes are brighter than the outer guide tubes. The false-colour image (Figure 14b) emphasizes the fact that the inner guide-tube holes are brighter than the outer ones. Additionally, the Cerenkov light from between the fuel rods in the centre of the assembly is brighter than the outer part of the fuel assembly. This is a key Cerenkov characteristic of spent fuel that is more difficult to observe in the grey-scale image.
(a) 105-mm lens (b) 250-mm lens
(c) 105-mm lens, enlarged
Figure 12: PWR fuel assembly 0C2: 34 000 MWd/t U, 14-year cooled, exposure time 10 s, binning 1 x 1, (a) 105-mm lens, (b) 250-mm lens, (c) enlargement of the 105-mm lens image
CSSP Report 123 SKI Report 02:25
Page 14 of 32
(a) (b)
Figure 13: PWR fuel assembly 33M: burnup 44 000 MWd/t U, cooling time 2 years, binning 1 x 1, exposure time 10 s, 250-mm lens, (a) grey-scale and (b) false-colour image
(a) (b)
Figure 14: PWR fuel assembly W18: burnup 50 000 MWd/t U, cooling time 2 years, binning 1 x 1, exposure time 10 s, 250-mm lens, (a) grey-scale and (b) false-colour image
3.3.2 Cerenkov Characteristics of SVEA-100 BWR Fuel Assembly
The DCVD image of the SVEA-100 spent fuel assembly is shown in Figure 15. The fuel assembly has the distinctive water cross that separates the fuel rods into four 25-rod bundles. These bundles are attached at the top and bottom of the assembly. The
Page 15 of 32
mounting mechanism appears as a cross arrangement. The Cerenkov image shows the dark fuel rods, the bright glow from between the fuel rods, and the lower light intensity in the water cross relative to the light from between the fuel rods. The false-colour image shows the same characteristics as the grey-scale image but highlights the fact that the centre of the assembly is brighter than the edges.
3.4 Cerenkov Characteristics of PWR Non-Fuel Assemblies
Three types of PWR non-fuel assemblies were available at the CLAB facility: a skeleton assembly (no rods), a helium-filled-rod assembly, and a high-density assembly (steel rods). These non-fuel assemblies were surrounded by relatively short-cooled fuel (1 to 5 years) to produce a near-neighbour effect. This effect is observed when gamma rays from surrounding assemblies (near neighbours) pass through the non-fuel storage volume generating Cerenkov light. These non-fuel assemblies were imaged using the Nikon digital camera, the Mark IVe CVD, and the DCVD.
3.4.1 Skeleton PWR Non-Fuel Assembly
The skeleton non-fuel assembly (Figure 16) contains no fuel rods, and consists only of the top and bottom nozzles, 8 spacer grids, and 24 guide tubes. The assembly has a shiny metallic surface, an indication that the assembly is not irradiated. A normal spent fuel assembly is very dark because of oxidation of the metal surfaces during irradiation. The spacer grids below the top nozzle can be seen. The CVD image, Figure 15b, has low contrast, and the glow appears diffuse and not well collimated, compared with a normal spent fuel assembly. This non-fuel assembly is detected by the Mark IVe by scanning the assembly to detect the lack of light collimation, which is characteristic of non-fuel
assemblies. No fuel rods can be detected. The main Cerenkov characteristic is the relatively bright guide-tube holes, all with similar light intensities.
(a) (b)
Figure 15: SVEA-100 fuel assembly 19078: burnup 43 000 MWd/t U, cooling time 2 years, binning 1 x 1, exposure time 10 s, 250-mm lens, (a) grey-scale and (b) false-colour image
CSSP Report 123 SKI Report 02:25
Page 16 of 32
The high-resolution DCVD image, Figure 16c, clearly shows the absence of fuel rods in the assembly. The glow from the assembly is uniform, and the light from all the guide-tube holes appears to have the same light intensity. These different characteristics definitely identify this as a non-fuel assembly.
In the false-colour image, the uniformity of the light from all the guide-tube holes is readily apparent.
(a) (b)
(c) (d)
Figure 16: PWR skeleton non- fuel assembly: (a) camera image exposure time 1/5 s, (b) Mark IVe CVD image, exposure time 1 s, (c) DCVD grey-scale image, binning 1 x 1, exposure time 10 s, 250-mm lens, (d) DCVD false-colour image
Page 17 of 32
(a) (b)
(c) (d)
Figure 17: PWR helium non- fuel assembly: (a) camera image, exposure time 1/3 s, (b) Mark IVe CVD image, exposure time 1 s, (c) DCVD grey-scale image, binning 1 x 1, exposure time 10 s, (d) false-colour image. A 250-mm lens was used to acquire CVD and DCVD images.
3.4.2 Helium PWR Non-Fuel Assembly
The helium non-fuel assembly (Figure 17) is a 17 × 17 array constructed like a spent fuel assembly, except that the fuel rods contain only helium. The shiny surfaces seen with the unaided eye and to some degree in the visible light pictures indicate that the assembly has not been irradiated. The design of this top nozzle is slightly different than the skeleton assembly shown in Figure 16. The top nozzle and the helium-filled rods can be seen under the top nozzle (Figure 17a). The Mark IVe CVD image (Figure 17b) shows a diffuse, low-contrast image. The guide-tube holes though are still relatively bright. All the guide-tube holes appear to have the same light intensity, which is not characteristic of spent fuel. In spent fuel, the central tube holes are brighter than the outer guide-tube holes. The DCVD image shows Cerenkov characteristics that are similar to the
CSSP Report 123 SKI Report 02:25
Page 18 of 32
CVD image except that the characteristics are easier to detect because the image has higher contrast and resolution. With the CVD, this non-fuel assembly is very difficult to verify.
The alignment in Figure 17c and d is not exact; the false-colour image clearly shows that the camera is aligned towards the top left of the assembly. No additional information can be obtained from the false-colour image.
3.4.2.1 Use of Light Collimation to Detect the Helium Non-Fuel Assembly
Figure 18a shows a DCVD image of a PWR spent fuel assembly with the DCVD instrument well aligned. Figure 18b shows the result when the DCVD instrument is moved 10 cm to the left. The same procedure was used for the helium non-fuel assembly shown in c and d. The spent fuel assembly shows that in the off-alignment image (10 cm to the left) the light from the guide tubes on the right is relatively dark, compared with the light in a similar image of the helium non-fuel assembly. This is an indication of the high light collimation from the guide tubes in normal spent fuel. In the helium non-fuel
assembly, the light from the guide-tube holes is less collimated. This may be due to the guide tubes’ bright, shiny inner surfaces reflecting much of the light to the top of the assembly. In normal spent fuel, the inner surfaces are oxidized, and only the vertical component of the Cerenkov light exits the top of the guide tube. This is a subtle but distinct difference in Cerenkov characteristics between fuel and unirradiated non-fuel assemblies.
3.4.2.2 Digital Analyses of Spent Fuel and Helium Non-Fuel Assemblies
Digital data in the form of pixel intensity values can be easily obtained from the DCVD images. Images from the PWR He non-fuel and a spent fuel were examined for
quantitative information. Pixel intensities were obtained for several inner and outer guide tubes in each assembly. The averages for each assembly are shown in Table 2. As expected for the spent fuel where the Cerenkov light is being generated from within the assembly, the inner guide tubes are substantially brighter than the outer tubes. For the He non-fuel assembly, the intensities are not statistically different, as expected in the
situation where the gamma rays originate from outside the assembly. Table 2: Pixel Intensities from Selected Regions
Inner Guide Tubes Outer Guide Tubes
PWR (0C2) 1512 1220
He dummy 1247 1187
Additional measurements were made on the light intensity in the water spaces between the fuel rods. The ratios of the inner guide-tube intensity to the intensity in these water spaces were calculated to be 3.50 and 2.71 for the He non-fuel and spent-fuel assemblies respectively. These values are consistent with the observed CVD characteristic of very bright guide tubes in the He non-fuel assembly that are due to multiple reflections of the light along the length of the very shiny (unirradiated) guide-tube surfaces.
Page 19 of 32
These quantitative measurements show conclusively that spent fuel has different Cerenkov characteristics than non-fuel assemblies. This type of analysis illustrates the potential for using some form of artificial intelligence to detect spent fuel and non-fuel assemblies.
(a) (b)
(c) (d)
Figure 18: PWR fuel assembly 0C2: burnup 34 000 MWd/t U, cooling time 14 years, exposure time 10 s, 250-mm lens, (a) aligned and (b) off-alignment 10 cm left and (c) PWR helium non-fuel assembly aligned, and (d) off-alignment 10 cm left
3.4.3 High-density PWR Non-Fuel Assembly
The high-density non-fuel assembly is similar to a normal assembly, except that the fuel rods are solid steel. Because the assembly has not been irradiated, the metal surfaces are shiny. The high-density assemblies, common in fuel bays, are used as test and training assemblies.
CSSP Report 123 SKI Report 02:25
Page 20 of 32
(a) (b)
(c) (d)
Figure 19: PWR high-density, non- fuel assembly: (a) camera image, (b) Mark IVe CVD image, exposure time 1 s, (c) DCVD grey-scale image, binning 1 x 1, exposure time 10 s, (d) false-colour image. CVD and DCVD images taken with the 250-mm lens.
The normal camera image, Figure 19a, shows the shiny metallic top nozzle, the fuel rods under the top nozzle, and a dark area in the centre of the assembly where several steel rods have been removed. The CVD image of this assembly, Figure 19b, shows that it is the darkest of the non-fuel assemblies. It is difficult to detect the dark fuel rods and the centre of the assembly shows a much lighter area corresponding to the missing fuel rods. The Cerenkov glow from the fuel assembly is faint, lacks contrast, is diffuse, and the Cerenkov glow from between the fuel rods is not highly collimated (characteristic observed in the scanning mode). These characteristics are not normal for spent fuel assemblies. The outer ring of guide-tube holes appears to be brighter than the centre guide-tube holes. The DCVD image, Figure 19c, shows a much sharper and higher-contrast image. However, the Cerenkov glow from between the fuel rods is diffuse and not collimated like the normal fuel assembly. The DCVD image shows that there are 15 missing fuel rods from the centre area of the assembly. From the DCVD and false-colour image of this non-fuel assembly, it is obvious that the outer ring of guide-tube holes is
Page 21 of 32
brighter than the centre holes. This is due to gamma rays, generated by the near-neighbours, being attenuated by the steel rods as they travel through the assembly resulting in a lower gamma ray flux in the inner region.
3.5 Different Cerenkov Characteristics Between Spent PWR Fuel and Non-Fuel Assemblies
Cerenkov images of spent fuel assemblies have high light collimation from the guide-tube holes and from between the fuel rods, which results in high contrast and sharp images. The Cerenkov images from non-fuel assemblies show lower collimation and contrast. These non-fuel Cerenkov characteristics were previously examined in Section 3.4.
Another specific Cerenkov characteristic can be seen in PWR spent fuel as a result of the high resolution provided by the DCVD instrument. Figure 12 and Figure 13 show that the outer guide-tube holes have an area of low light intensity within the individual guide tubes. There appears to be a shadow, which indicates a local collimation effect. This characteristic is not seen in the three non-fuel assemblies. The Cerenkov light from the guide-tube holes of spent fuel assemblies is highly collimated. Only the vertical
component is seen because the off-vertical component is mainly absorbed by the dark, oxidized inner surface of the guide tubes. The shadow effect in the outer guide tubes in spent fuel is probably due to the alignment of the DCVD instrument over the centre of the assembly. The light from the outer guide tubes that are progressively less aligned shows this shadow effect.
3.6 Photon Flux Intensities from DCVD Measurements
Relative Cerenkov light intensities can be obtained from the measurement of spent fuel using the DCVD instrument. The CCD gives the total counts per pixel accumulated during an exposure period. In theory, the absolute Cerenkov photon flux can be measured if the efficiency for counting these photons is known. Four PWR fuel
assemblies with similar burnups were analyzed to obtain their average pixel intensities. These data are summarized in Table 3 and are plotted as a function of cooling time in Figure 20. The data are similar to the 40 000 MWd/t U burnup cooling time curve. These results offer the potential to determine cooling time from the DCVD measurement of spent fuel assemblies with similar burnups.
Table 3: PWR Fuel Assemblies Fuel
Assembly (MWd/t U)Burnup Cooling Time(years) Average pixelIntensity
11K 41 000 5 53
4C0 40 000 13 36
3G2 40 000 8 41
CSSP Report 123 SKI Report 02:25 Page 22 of 32 0 20 40 60 80 100 120 0 2 4 6 8 10 12 14 16
Cooling Time (years)
Pixel Intensity (counts)
Figure 20: Measured pixel intensities for 4 PWR fuel assemblies plotted against cooling time
3.7 Fuel Assemblies with Missing Fuel Rods
A CVD image of a BWR fuel assembly (16 000 MWd/t U, 21-year cooled) with missing fuel rods is shown in Figure 21a. The CVD image is low in intensity and contrast, features normally expected in long-cooled spent-fuel assemblies. The missing fuel rods can be detected because the regular pattern of the fuel rods (8 × 8) changes. There are five missing fuel rods: one from the top right-hand corner, one on the left side and three in the bottom row. The higher resolution and higher contrast of the DCVD image (Figure 21b) clearly shows missing fuel rods. The false-colour image, Figure 21c, more clearly shows missing fuel rods even though the four missing pins on the outer edges do not show significantly higher intensities. The empty fuel rod position on the left side of the assembly surrounded by adjacent fuel rods is very bright compared to the other vacant fuel rod sites in the assembly.
3.8 DCVD Measurements of Long-cooled Fuel Assemblies
A primary objective of the field test was to test the sensitivity of the DCVD instrument. The measurement goal was to assess the ability of the DCVD to verify fuel with a burnup of 10 000 MWd/t U with a cooling time of 40 years. The low-burnup criterion was selected because first charges of fuel in reactors are not normally taken to the design burnup. The cooling time criterion was set by the lifetime of operating reactors, which is approximately 40 years. There are currently no known power reactor fuel assemblies with cooling times greater than 40 years. There are, however, fuel assemblies with burnups less than the specified 10 000 MWd/t U with long cooling times. To obtain fuel that could be tested to meet the measurement criteria, we needed to have fuel with low burnups and the longest cooling times available. Figure 22 shows a plot of photon flux as a function of cooling time for a range of burnups. These theoretical curves4 have been confirmed by field measurements at the CLAB facility.
Page 23 of 32
(a)
(b) (c)
Figure 21: BWR fuel assembly 1059: burnup 16 000 MWd/t U, 21-year cooled, 250-mm lens, (a) CVD image, (b) DCVD image, binning 1 × 1, exposure time
10 s, (c) false-colour image
3.8.1 Long-cooled BWR Fuel Assembly
The longest-cooled BWR fuel assembly stored at the CLAB facility has a burnup of 5400 MWd/t U and a cooling time of 24 years. Images obtained are shown in Figure 23. The CVD image (b) shows a medium-to-low contrast image with well-resolved fuel rods. The small bright spots seen in the centre of the inter-rod gap of the DCVD image (c) are difficult to detect with the CVD. These bright spots are highly collimated light that is generated along the whole length of the fuel assembly. This fuel assembly appears to be at the detection limit of the CVD. In fuel bays with lower water quality, it may not be possible to detect this assembly using the CVD. The DCVD image (c) shows a high contrast image with much higher resolution than the CVD image. The Cerenkov characteristic of small light spots between the fuel rods and the dark fuel rods are obvious. The false-colour image does not seem to reveal additional information. This long-cooled fuel assembly was easily verified using the DCVD instrument.
CSSP Report 123 SKI Report 02:25 Page 24 of 32 1E+3 1E+4 1E+5 1E+6 1E+7 0 10 20 30 40 50
Cooling Time (years)
P hot on Fl ux (phot ons· cm -2 s -1 ) Burnup (MWd/kg U) 50 40 30 20 10 5 2.5 BWR (5,400 MWd/t U, 24 y) Ågesta (1200 MWd/t U, 29 y) Target fuel
Figure 22: Plots of photon flux as a function of cooling time for a range of burnups. The open square indicates the IAEA target. Other points indicate photon flux intensities of BWR and Ågesta fuel assemblies measured with the DCVD.
3.8.2 Long-cooled Ågesta Fuel Assemblies
The longest-cooled fuel stored in the CLAB facility is from the Ågesta test reactor. A number of fuel assemblies have cooling times of 29 years and burnups as low as 1130 MWd/t U. Figure 24a shows a basket containing 31 Ågesta fuel assemblies. A normal camera image of fuel assembly 03052 (1200 MWd/t U, 29-year cooled) is shown in Figure 24b. This fuel assembly could not be verified using the Mark IVe CVD; Cerenkov light could be detected from between the fuel assemblies but Cerenkov characteristics from the fuel assembly could not be detected (Figure 24c). The DCVD image, Figure 24d, shows a relatively high contrast image of the fuel assembly. Uniform glow intensity was obtained from the assembly. This observation is an indication that the Cerenkov light generated from between the fuel rods is highly collimated, a characteristic of spent fuel. The exposure time for this image was 10 s. Figure 24e shows a 4 × 4 binned image with an exposure time of 5 s. This image is almost identical to the non-binned image (Figure 24d), and it appears that 4 × 4 binning does not significantly degrade the DCVD image. We estimate from the total counts in the pixels that at 4 x 4 binning, this long-cooled fuel assembly could be verified with an exposure time of less than 1 s.
Page 25 of 32
(a) (b)
(c) (d)
Figure 23: BWR fuel assembly P80: burnup 5400 MW/t U, cooling time 24 years, (a) camera image, exposure time 1/2 s, (b) Mark IVe CVD image, exposure time 1.9 s, (c) DCVD grey-scale image, exposure time 10 s, binning 1 x 1, (d) false-colour image. The 250-mm lens was used to acquire Cerenkov images.
3.9 DCVD Measurements of Ågesta Fresh-Fuel Assembly
Figure 25a and b show a DCVD image of 2 Ågesta assemblies. The DCVD is aligned with the assembly on the left that has a burnup of 1130 MWd/t U and a cooling time of 29 years. The assembly on the right is a fresh-fuel assembly. The Cerenkov glow from the fuel assembly on the left has the uniform light distribution characteristic of spent fuel. The DCVD instrument was then aligned over the fresh-fuel assembly (Figure 25b). The glow from the spent fuel assembly decreases (a key characteristic of spent fuel) and the glow intensity increases in the fresh-fuel assembly. However, the light distribution in this assembly is not uniform. This is evidence that the fresh-fuel assembly is not
CSSP Report 123 SKI Report 02:25
Page 26 of 32
(a) (b) (c)
(d) (e)
Figure 24: Ågesta fuel assembly 03052: burnup 1200 MWd/t U, 29-year cooled, (a) camera image of basket (31 assemblies), (b) camera image of assembly, (c) Mark IVe CVD image, (d) DCVD image, binning 1 x 1, exposure time 10 s, (e) DCVD image, binning 4 x 4, exposure time 5 s. The 250-mm lens was used to acquire Cerenkov images.
3.10 DCVD Measurements of Long-cooled Ågesta Fuel Using the 105-mm Lens The 250-mm UV lens manufactured by Applied Physics Specialties was developed by the Swedish and Canadian Safeguards program in response to the IAEA’s request for a lens that would provide a larger image of small cross-sectional fuel assemblies from BWR and WWER power reactors5, 6. A key specification for the development of the lens was to have a high UV light throughput. This lens has an aperture of f/2.8, compared with the Nikkor 105-mm UV lens’ f/4.5. The larger lens opening of the 250-mm lens creates twice the light throughput of the Nikkor lens; this property was confirmed in field tests7, 8 in fuel bays in Sweden and Finland.
Page 27 of 32
(a) (b)
Figure 25: (a) Ågesta fuel assembly 03129: burnup 1130 MW/t U, cooling time 29 years, binning 4 x 4, exposure time 5 s, (b) Ågesta fresh-fuel assembly F3, binning 4 x 4, exposure time 5 s. The 250-mm lens was used to acquire both images.
To assess the sensitivity of the DCVD instrument with the 105-mm Nikkor lens, the low-burnup, long-cooled Ågesta fuel assembly was measured. The image in Figure 26 shows the whole fuel basket containing 4 large corner canisters (each containing reactor debris) and 8 Ågesta assemblies surrounding the centre canister. The image of the Ågesta fuel assembly is smaller than that obtained with the 250-mm lens (Figure 25). Despite the smaller size of the image, the Cerenkov characteristics (light collimation and detection of the fuel rods) are easily observed, thereby conclusively verifying this assembly.
Figure 26b shows the 105-mm image digitally zoomed. The image has lower resolution and shows more noise, but the fuel can still be conclusively verified from this zoomed image.
4 DISCUSSION
4.1 Ergonomics of DCVD Instrument 4.1.1 Liquid Crystal Display
The 640 × 480-pixel liquid crystal display was very bright and had excellent resolution. The angle of view was very good permitting two or more viewers to see the screen at the same time. The camera head, display and HUI interface weighed 5 kg. This weight was too heavy for handheld use, even for a short period of time. The screen size, 15-cm diagonal, was considered to be a bit large. A smaller screen (10 to 12 cm) could be lighter and could contribute to an easier-to-use handheld camera.
CSSP Report 123 SKI Report 02:25
Page 28 of 32
(a) (b)
Figure 26: Ågesta fuel assembly 03129: burnup 1130 MWd/t U, cooling time 29 years, binning 2 x 2, exposure time 20 s, (a) 105-mm lens image, (b) 2½-time digital zoom
4.1.2 Head-Mounted Display
The 800 × 600 pixel HMD was surprisingly bright, had high contrast, and excellent resolution. The software menu items were easily seen. Just one observer had problems with the transparency of the screen and the strain of using one eye to view the screen. The main problem with the HMD was the stability of the support arm: the signal cable could pull on the arm, twisting the display out of the comfortable viewing position. A simple cable clamp on the headband could solve the problem. A user-specific problem with this display is that it is a monocular viewer and problems can occur if the user cannot discriminate between the differing images seen by each eye (i.e., cannot identify a dominate eye).
4.1.3 Hardware User Interface
The HUI could be improved by decreasing its weight. The buttons on the HUI were too small, and one had to press too hard, tilting the camera and image, to change operating parameters. The number of buttons should be reduced. To improve the ability to
handhold the camera head, the handles must be positioned closer to the centre of mass of the camera. The handle grips were satisfactory.
4.1.4 Computer
The computer, designed to test several options, could be made significantly smaller for the final system. The case was not optimized for the room required by the components, and the components were selected to provide flexibility for data storage and
communication. For example, a PC card interface and a PC/104-plus Ethernet card were installed. Since the PC card interface could provide network capability, having both cards was redundant.
Page 29 of 32
4.1.5 Railing Bracket
The lightweight railing bracket performed well in the tests. The heavy camera and HUI, and its non-centred mount made alignment adjustments using the gimbals mount erratic. The camera and HUI should be mounted on the railing bracket so that its centre of mass is balanced in the gimbals mount. Changes could also be made to decrease the size of various components to permit a smaller shipping container.
4.1.6 Backpack and Cables
The backpack functioned adequately. It supported the computer and did not hinder the handheld operation of the camera. The backpack had been designed for a previous computer and was somewhat larger than it needed to be. Signal and control cables were also not of the correct length (too long) and created problems when routed to the
backpack. No user complained about the weight of the computer and backpack although there were comments about the bulkiness of the system.
4.1.7 Sensitivity
Laboratory measurements indicated that the DCVD instrument was over 100 times more sensitive than the Mark IVe CVD. Although the quantum efficiency of the CCD is not 100 times higher than that of the Mark IVe CVD, its very low noise and high resolution permit the detection of extremely dim images.
The DCVD instrument was able to verify the Ågesta fuel assembly with 1200 MWd/t U and a cooling time of 29 years. This long-cooled Ågesta fuel assembly has a photon flux about 6 times lower in intensity than the target fuel (Figure 22).
These measurements were all achieved at the CLAB facility, where the water quality is extremely high and not representative of some power-reactor storage bays. In operating power-reactor fuel bays, particulates may be produced from pump systems or normal fuel movements. Chemicals can be added to the water to absorb neutrons. Organic
compounds (e.g. lubricants) leak from overhead cranes, motors or pumps. Scattering and absorption by the particulates and organic compounds in the water can reduce the
Cerenkov light intensity. These effects remain to be assessed at other spent fuel storage facilities. It is expected that most spent fuel storage facilities have good water quality and that the measurement targets can be met.
There are no spent fuel assemblies with the target specifications of 40-year-cooled, 10 000 MWd/t U burnup stored in reactor fuel bays. From our current detection limit measurements using the CVD, we can determine the Cerenkov light absorption factor in a typical fuel bay relative to the water in CLAB. From this data together with the DCVD measurements of the longest cooled spent fuel in the CLAB storage bay, we can
determine whether the DCVD can meet the target measurement of 10 000 MWd/t U in a typical fuel bay.
IAEA PIV procedures state that the CVD detection limit in typical fuel bays is
10 000 MWd/t U with 10 years cooling time. At CLAB using the CVD we were just able to detect fuel with a burnup of 5400 MWd/t U and a cooling time of 24 years. The
CSSP Report 123 SKI Report 02:25
Page 30 of 32
Table 4: Cerenkov Photon Flux from Spent Fuel
Fuel Type Photon flux
(photons•cm-2•s-1) 10 000 MWd/t U, 10-year-cooled, IAEA CVD
detection limit in typical fuel bay 90 000
5400 MWd/t U, 24-year-cooled, CVD
detection limit at CLAB 26 000
10 0000 MWd/t U, 40-year-cooled, target fuel 34 000 1300 MWd/t U, 29-year-cooled, DCVD
measurement of Ågesta fuel in CLAB 6000
An absorption factor can be obtained from the ratio of the photon flux intensities of the 10 000 MWd/t U, 10-year-cooled CVD limit to the measured CVD limit at CLAB (5400 MWd/t U, 24-year-cooled).
Absorption factor = 3.5 26000 90000 =
Thus the water in a typical fuel bay appears to attenuate the Cerenkov flux by a factor of 3.5.
The target fuel in a typical fuel bay would then have an apparent flux of:
Apparent flux = 9800
5 . 3
34000 = photons•cm-2•s-1
Table 4 shows that the longest cooled spent fuel verified by the DCVD camera has a Cerenkov photon flux of 6000 photons•cm-2•s-1 (shortest exposure time 1 second). This is about 40% lower than the apparent photon flux of the target fuel in a typical fuel bay. Therefore the present camera would be able to verify the target fuel in a typical fuel bay. 4.2 Quantization
The DCVD instrument, because of its digital capability, allows for numeric comparison of Cerenkov light intensities. It was particularly valuable for the detection of non-fuel from spent fuel. This was presented in this report in a semi-quantitative manner but should be done more rigorously using computer analysis that makes use of image pattern recognition. The quantitative work at the CLAB facility showed a strong correlation with cooling time (at constant burnup). Future studies will examine methods to take
advantage of the digital data from the Cerenkov images to assist the IAEA inspectors in fuel verification.
4.3 Scanning Fuel Assemblies
To scan a row of fuel assemblies, the DCVD instrument was handheld, the computer was carried in a backpack, and the HMD was used. The operation was hampered because the manufacturer supplied software drivers did not function at the expected frame rates. At the fastest frame rate available, approximately 1 frame per second, it was difficult to obtain clear images. However, when the camera was mounted on the railing bracket, it
Page 31 of 32
was possible to scan a row of fuel despite the low frame rate. Scanning was
demonstrated using the railing bracket by pausing on an assembly to obtain a sharp high contrast image before moving on to the next assembly. Some frames were blurred, but the next fuel assembly could still be seen, and there was no loss of orientation. Faster frame rates, already demonstrated in the laboratory, indicate that future tests would result in improved scanning capability.
4.4 False-colour Imaging
The digital nature of the image permits representation of the image in colours mapped to the pixel intensity. Compared with grey-scale images, the false-colour images highlight the intensity differences in the spent fuel images. These false-colour images clearly show differences between fuel and non-fuel assemblies. Moreover, false colour can ease the detection of fuel assemblies with missing fuel rods.
4.5 Training
The DCVD instrument has significantly more capability than the Mark IVe CVD. For example, the DCVD images can be stored, unique Cerenkov characteristics can be detected, a graphical user interface is used, etc. All these new DCVD features require an inspector to be trained on the use of the instrument. Plans are in place to introduce the instrument to IAEA inspectors at the next CVD training course in Sweden.
4.6 Future Work
The capabilities of the DCVD instrument have been described in this report. Both PWR spent- and non-fuel assemblies were studied. Only a few images of BWR fuel were obtained, and further studies of this type of fuel are required. The scanning of fuel assemblies was only partially successful and needs to be re-assessed when the problem with the fast display software is corrected. The hardware will be improved to make the HUI easier to use; the railing bracket will be modified to fit into a small carrying case; the computer will be made more compact; the hardware and software interface will be modified to simplify the man-machine interface.
Several improvements that can be made to the camera system, but we are dependent on manufacturers for these improvements. Andor Technology plans in the near future to have a 10 MHz analogue to digital converter system incorporated into a digital camera head. They expect frame rates of greater than 16 frames per second at 4 × 4 binning with our current CCD chip. This speed should be adequate but needs to be tested in the field. The CCD manufacturer, Marconi, has produced high-gain video chips that are just being incorporated into functional camera systems. This video chip has a gain of 100 applied to the pixel signal after the readout register and before the output amplifier. A significant increase in sensitivity is obtained because this amplified signal has the normal dark current and the readout noise of a non-amplified signal. The schedule to produce the high-gain video chips with high UV quantum efficiency and low noise is still uncertain.
5 CONCLUSIONS
The prototype DCVD instrument was successfully developed and tested for verifying spent-fuel and non-fuel assemblies. The portability of the instrument was adequate, and
CSSP Report 123 SKI Report 02:25
Page 32 of 32
future development and improvements look promising. The digital images provided by this technology permitted better discrimination of spent fuel and non-fuel assemblies, along with an improved ability to detect missing fuel rods. The high quantum efficiency, low noise, and high resolution permitted the verification of Ågesta fuel with a burnup of 1200 MW/t U and a cooling time of 29 years, well below the target criteria of
10 000 MWd/t U burnup and 40-year-cooled fuel.
6 ACKNOWLEDGEMENTS
The authors would like to express their gratitude to the Swedish Nuclear Fuel and Waste Management Company (SKB), owners of the Swedish Central Interim Storage for Spent Fuel (CLAB), for making this study possible. We would like to thank the staff members for assistance in planning the tests. The Swedish Support Program and the Canadian Safeguards Support Program funded these tests for the International Atomic Energy Agency.
7 REFERENCES
1. J.D. Chen, L. Hildingsson, O. Trepte, E.M. Attas, G.R. Burton and G.J. Young, “Development of a high sensitivity Cerenkov viewing device: Concept SCCD field tests in Sweden”, CSSP Report 88, May 1996.
2. O. Trepte, L. Hildingsson, J.D. Chen, G.R. Burton, G.J. Young and E.M. Attas “Development of a high sensitivity Cerenkov viewing device: Field test at Ringhals 2 PWR facility, Sweden”, SKI Report 94:45, October 1996.
3. J.D. Chen, E.M. Attas, G.R. Burton, G.J. Young, L. Hildingsson and O. Trepte, “Development of a high sensitivity Cerenkov viewing device: Concept SCCD CVD summary report”, CSSP Report 91, October 1996.
4. S. Rolandson, “Determination of Cerenkov light intensities from irradiated BWR fuel”, Report SE 1-94, January 1994.
5. J.D. Chen, E.M. Attas and G.J. Young, “Development of an ultraviolet telephoto lens for the Mark IV CVD – Task Statement”, Re 1, IAEA Task ID JNT A00703, CSSP report 46, November 1993.
6. E.M. Attas, J.D. Chen, G.J. Young and L. Hildingsson, “Development of an ultraviolet telephoto lens for the Mark IV CVD. Design and test documentation”, IAEA Task ID JNT A00703, CSSP Report 82, October 1995.
7. Lars Hildingsson, Dennis Chen, Michael Attas, Gary Young and John Brauneisen, “Field test of a 250-mm lens for the Mark IV CVD”, ISSN 1104-1374, ISRN SKI-R-95/68--SE November 1995.
8. Dennis Chen, Michael Attas, Gary Young, Lars Hildingsson and John Brauneisen, “Cerenkov viewing device: Recent developments and the implication for spent fuel verification”, 17th Annual Symposium on Safeguards and Nuclear Material