Sayaka Osanami Törngren, Emi Moriuchi, Caroline Adolfsson,
Marcus Nyström and Sofia Ulver
Comparing attitudes and preferences towards
multiracial advertisement in Sweden and the US
-Exploration through eye-tracking
MIM Working Paper Series No 20: 2
Published
2020
Editor
Anders Hellström, anders.hellstrom@mau.se
Published by
Malmö Institute for Studies of Migration, Diversity and Welfare (MIM) Malmö University 205 06 Malmö Sweden ISBN 978-91-7877-070-0 DOI 10.24834/isbn.9789178770700 Online publication
Sayaka Osanami Törngren, Emi Moriuchi, Caroline Adolfsson, Marcus Nyström and Sofia Ulver
Comparing attitudes and preferences towards multiracial advertisement in
Sweden and the US - Exploration through eye-tracking
Abstract
This article is based on the results of a pilot study which examines and compares how multiracial and multiethnic advertisement is looked at and perceived in Sweden and the US. Research involving eye-tracking is growing in several disciplines but still underexplored in the Social Sciences. Eye trackers enable recording of eye movements both in a natural and isolated/experimental context. Combining eye-tracking data and other types of traditional data such as interviews or surveys has a great potential to analyze and challenge the data bias, such as social desirability needs and race of interviewer effect. Even though we did not find any statistically significant results due to the limited sample size, the results points to interesting trends and tendencies which need to be addressed in further studies. We did not find any statistically significant differences in the preference in monocultural advertisements among Swedish and American students. However higher prior interracial exposure had some significance in a higher preference in multicultural advertisement.
Key Words
Eye-tracking, racial preference, multiracial advertisement, Sweden, US
Bio Notes
Sayaka Osanami Törngren is a PhD in Ethnic and Migration Studies. She currently holds a position as a senior researcher at the Malmö Institute for Studies of Migration, Diversity and Welfare (MIM), Malmö University. She is engaged in research in the field of International Migration and Ethnic Relations, especially on integration, race and ethnicity, intermarriage, and multiracial and multiethnic identities.
Emi Moriuchi is currently an Assistant Professor of Marketing at Rochester Institute of Technology (RIT). Her research interests include eye-tracking methods,
human-computer interactions, technology adoption and integration in digital marketing and online retailing.
Caroline Adolfssonis a Ph.D. Candidate (Starting Fall 2018) in International Migration and Ethnic Relations, Malmö University. She has a MA degree in International Migration and Ethnic Relations and in Psychology. Her Ph.D. project on interracial and interethnic attitudes and perception of group position, distance and attraction.
Marcus Nyströmis Associate Professor of Ergonomics, Lund University (2015) and have a PhD in Information Theory (2008). His research interests include visual perception and cognition, learning, eyemovements, and eye tracking - all with an interdisciplinary focus.
Sofia Ulver is an Associate Professor of Marketing, at Lund University. She is an expert in Consumption Culture Theory (CCT), involved in research identifying major changes and social trends in society by looking at how people live, consume, produce and innovate in the global and local market.
Contact
INTRODUCTION
Globalization creates an increasingly economically, socially and culturally independent world (Sobol, Cleveland, & Laroche, 2018). Migration is accelerating globalization and transnationalism, even in Sweden. Today, 19% of approximately 10 million residents in Sweden are first-generation immigrants born outside of Sweden, and 9% are non-Swedish citizens. Sweden’s racial and ethnic composition has changed in a relatively short time as a result of immigration. Among the 19% first generation immigrants, around 35% are of Asian and the Middle Eastern origin, which is the largest non-white/European group in Sweden. People of African origin consist of about 10% and of Latin American origin 6% (Statistics Sweden, 2018).
Advertising should ideally mirror the sociocultural composition of a nation. With the presence of the internet, the marketing field is globalized and consumers around the world are inevitably exposed to different cultures, racial and ethnic groups (Sobol et al., 2018). However, sensitivity to culture, race, and ethnicity, together with other social categories, such as religion or gender, differ greatly according to the national context. As consumers and markets grow internationally, it is becoming increasingly challenging to embrace racial and ethnic diversity that fits all contexts and consumers. This article will present the result from our pilot study which examined how monoracial-monoethnic and multiracial-multiethnic advertisements are perceived in the US and Sweden. While research on ethnic marketing is gaining attention in the US, research in the Swedish context is scarce. Swedish researchers have started to problematize advertisement industry for the lack of racial and ethnic representation (Ulver, Åkestam, & Rosengren, Sara, Laurell, Christofer, 2019).
Portrayals in advertisements are seen to reflect reigning socio-cultural norms and values which allow consumers to identify with the message and inherently also with the brand. In the US, and other countries with a history of racial diversity (such as South Africa), attention has been paid to the media’s role within issues of race and ethnicity, and a significant amount of research is conducted on ethnic and racial representation in advertisements (Dixon, Weeks, & Smith, 2019). Analysis on representation, whiteness and non-whiteness in Swedish films, literature and news are fairly well documented (e.g. Brune, 2002; Gokieli, 2017; Karlsson, 2014; Khosravi, 2009). However, analyses looking at how non-white minorities are perceived in Swedish advertisements are lacking. Swedish academia has not paid much attention to racial and ethnic representations in advertisements even in marketing and business fields (Åkestam, 2017)). More research is needed to capture how Swedish audiences perceive racial and ethnic advertisements.
This article will fill in the gap that exists in research on international migration and ethnic relations by looking at how multiracial and multiethnic advertisement is looked at and perceived in Sweden. Moreover, a comparison is made between Swedish and American viewers to explore whether there is a difference in the way people in two
different multiracial contexts see the same advertisement. What is also unique about this study is that it utilizes eye-tracking as a method.
Based on a small-scale eye-tracking pilot experiment (N=47) conducted in Rochester, New York and Malmö, Sweden, we explore the following:
• Do US and Swedish students view the presented advertisements differently or similarly? • How does the previous amount of interracial experiences and attitudes towards racial
diversity might affect the way students see the advertisements?
Moreover, we compare whether US and Swedish students show any differences in advertisement preference.
WHY LOOK AT ADVERTISMENTS?
The mass media represents images that conform to dominant cultural norms and promotes particular categories of people, voices, values and bodies (Edström, 2018). Consuming images and messages associated with racial/ethnic groups in the media contributes to formation activation and application of racial/ethnic cognitions (D. Mastro, 2017). Media has the potential to promote or to call into question stereotypical view of social groups based on race, ethnicity and gender, therefore efforts have been made for education addressing the media’s role in stereotyping (Scharrer & Ramasubramanian, 2015). Penaloza calls for a redefinition of “ethnic marketing” which traditionally focused on non-white ethnic consumers (2018). She brings attention to the need for plural connotations for the term ethnicity and ethnic marketing which benefit both minority and majority ethnic consumers and their and society at large (Peñaloza, 2018). This flexibility in understanding ethnicity and ethnic marketing is important because multiple generations of ethnic minorities and majorities engage with their cultural heritage symbolically and optionally (Gans, 1979; Song, 2003; Waters, 1990).
Media representations of racial/ethnic groups are important to consider because they affect and form public attitudes and maintenance of groups, especially when direct contact with diverse racial and ethnic groups are lacking (D. Mastro, 2015; D. E. Mastro & Kopacz, 2006; Tukachinsky, Mastro, & Yarchi, 2015). Scholars also have shown how exposure to a mediated out-group member can increase in-group favoritism. Empirical evidence from the US indicates that viewing stereotypical characterizations of racial/ethnic minority groups among white audiences promotes harmful perceptions about blacks in society and unfavorable views on diversity-related policy issues such as affirmative action and policing. Conversely, viewing positive depictions can produce more constructive and sympathetic views about diverse groups as well as more favorable policies (Fujioka, 1999; Maree & Jordaan, 2016; D. E. Mastro & Kopacz, 2006; Punyanunt-Carter, 2008).
Moreover, it is important to consider how racial and ethnic groups are portrayed; frequent depictions do not equate to favorable representation. For example in the US context, although well represented, black depictions continue to embody many
stereotypes such as unintelligent, athletic, criminal, aggressive and sexual (Dixon et al., 2019). Positive media representations of ethnic minorities can have pro-social effects, fostering positive intergroup attitudes (D. Mastro, 2015; Tukachinsky et al., 2015).
EYE-TRACKING AS A METHOD PROBING RACIAL BIAS
While eye tracking already is a commonly used technique in many fields such as psychology and marketing, it is uncommon in research on ethnic relations, discrimination, racial attitudes and intergroup relations in Sweden.
Eye trackers enable recording of eye movements both in a natural and isolated/experimental context. Where people look and how they move their eyes is measured and the data on eye movements are typically analyzed through a quantification of duration and fixation.
Traditionally, eye tracking is an established method in psychology, linguistics, and neuroscience, but has more recently also found its way into more applied fields such as human factors and marketing (Holmqvist et al., 2011). The success of eye tracking lies heavily on the fact that eye movements provide an online link to perceptual and cognitive processes, which broadly means that “there is no appreciable lag between what is fixated and what is processed” (Just & Carpenter, 1980:331). Thus, eye movement provide a millisecond record of the processes leading up to the final behavioral outcome, for instance a solution to a problem or a decision. Importantly, eye movements in themselves can be observable, but their meanings are unobservable. The meaning of eye movements therefore rests on the theoretical framework of the inquiry as well as the operationalization of experimental design.
Within the field of international migration and ethnic relations in Sweden, there is plenty of research on racial bias, discrimination, attitudes and intergroup relations (e.g. Author A, 2016; 2019). However, these studies normally utilize solely quantitative survey method or mixed methods using surveys and interviews. Studies that incorporate eye-tracking is non-existent.
In measuring racial bias, intergroup relations and attitudes through surveys and interviews, there are fundamental methodological concerns embedded in the social desirability needs among the respondents. This may create a possible gap between how the respondents answer the questions and how they act. There are ways to minimize the social desirability pressures, for example through anonymizing the survey or using different types of scales (e.g. Krosnick, 2002). However, there is a limited way in determining the accuracy of using a survey and interviews to measure the actual behavior of the respondents.
To tap into peoples’ natural behavior and cognitive processes during such tasks, eye-tracking can be used. Combining eye-tracking data and other types of traditional data such as interviews or surveys has a great potential to analyze and challenge the data bias, such as social desirability needs and race of interviewer effect. Eye-tracking can
pave a new way of understanding and measuring implicit attitudes and prejudice in real time, with certain racial and ethnic cues. A successful integration of eye-tracking technology will broaden the understanding of implicit attitudes and prejudice and enable an analysis of ethnic congruency and the process of ingroup/outgroup boundaries which may undermine social relations.
WHY COMPARE US AND SWEDEN?
Studies have shown that ethnicity is more salient in an ethnically mixed than uniform society (e.g. Hesapci, Merdin, & Gorgulu, 2016). United States offers an appropriate context to study racial and ethnic effects in advertising due to its long history of diversity in the population as well as awareness towards the diversity. The U.S. is a country established through immigration (National Academies, 2015). Sweden, on the other hand, has historically been a country of emigration which became a country of immigration after the World War. Sweden also provides a unique context where society is ethnically mixed (Swedish Migration Agency). The country has experienced changes in the racial and ethnic landscape of the population the past 50 years. Swedish is still predominantly a white European country, however the growth of non-European population since the 1980s, especially middle easterners, is evident (Migrationsverket). While the U.S. has an integrated assimilation policy and the melting pot as an ideal, Sweden has incorporated multicultural policy respecting cultural differences. Sociological research points to how race matters in Sweden and how attitudinal patterns are very similar to the US population (e.g. Osanami Törngren 2016; 2018).
Studies in the U.S. and Sweden show how prior interracial contact affect biased processing of racial ingroup and outgroups. Exposure to racial out-group members can decrease both explicit and implicit bias (e.g. Pettigrew, Tropp, Wagner, & Christ, 2011). The so-called Contact Hypothesis has been tested within the field of sociology, psychology, and intercultural communication (Allport, 1979). However, how interracial exposure affects the perception and prediction of multiracial and multiethnic faces has not been tested and investigated enough (e.g. Freeman, Pauker, & Sanchez, 2016). For the Swedish participants, we can assume that exposure to racial and ethnic diversity came at a later age, especially for those who did not grow up in urban areas.
Through the contextual differences between the US and Sweden, we draw two hypotheses:
• Hypothesis 1: Swedish students will exhibit a higher preference in monocultural advertisements more than American consumers.
• Hypothesis 2: Swedish and American students with higher prior interracial exposure will exhibit a higher preference in multicultural advertisement.
Previous studies utilizing eye-trackers already have established that people tend to look at the faces in the picture presented, rather than anything else. Research has shown that eye movements tend to utilize patterns of looking for faces, rather than equally distributing fixations all over the face (Chuk, Crookes, Hayward, Chan, & Hsiao, 2017). Eye tracking research has long established that the eyes tend to garner the most fixations as well as the nose and mouth (Luria & Strauss, 2013; Walker-Smith, Gale, & Findlay, 1977; Yarbus, 1967). However, some evidence of culturally biased looking has been found before (Blais, Jack, Scheepers, Fiset, & Caldara, 2008; Hayward et al., 2013; Kelly et al., 2011; Rodger, Kelly, Blais, & Caldara, 2010). Therefore, with this pilot experiment, we hope to see different patterns of fixations among Swedish and American students.
DATA COLLECTION PROCEDURE
The pilot experiments were conducted in Rochester, U.S. and Malmö, Sweden. Rochester and Malmö are comparable as these are two cities that have become a major center for immigration. Rochester’s about 210,000 residents consists of around 40% white, 40% black, 17% Latinos and 3% Asians. Malmö has a population of around 300,000 where one third of the population are born outside of Sweden. Both cities have a young population, the average age being 31 and 38 respectively. Both cities have transformed from being an industrial city to a service and knowledge centered city.
The data analyzed in this article consists of 47 (23 from the US and 24 from Sweden) responses from participants1. In the US, we used a 60 Hz Tobii Pro Nano eye
tracker (Tobii Technology, Falls Church, VA, USA) with a 24-inch widescreen monitor with a resolution of 800 x 600 pixels. The screen size was 34.5cm x 19.5cm. In Sweden, data were collected with the Tobii 4C at 90 Hz on a 22-inch (53 x 50 cm, 1680 x 1050 pixels) monitor. Data was collected in windowless rooms in order to standardize the lighting for all participants. The participants viewed the stimuli from a distance of 65 cm. Stimuli were presented with PsychoPy (v. 3.0.3) and data recorded with the Titta toolbox (Niehorster et al, submitted).
The four fashion advertisements were chosen for the experiment and pretested through a panel. The four chosen advertisements were taken from an existing clothing company’s campaign from 2014. Each ad shows 4 models and in 2 of the ads all 4 models are objectively defined as Caucasian/white (hereafter referred to as monoracial ad), while the other two advertisements included one ethnically ambiguous model, one Asian model and two Caucasian/white model (hereafter referred to as multiracial ad).
1 The total number of participants were 54, however we eliminated participants not born in the US/Sweden
Students were placed in the eye-tracker room after they signed the consent form. On the computer screen the following instruction was shown:
In the next few slides, you will see 4 different ads for a retail store’s Spring collection. Please look at each image carefully.
The experiment advanced via mouse clicks. Each picture was shown for 5 seconds. After seeing the four pictures, three forced choice questions followed: Two monoracial ads appeared on one screen and respondents were asked to choose the one they prefer the most. Then, two multiracial ads were shown, and respondents were asked to choose the one they preferred. These two tasks were randomized. As the last forced choice task, the monoracial and multiracial ads that the students chose previously appeared on the screen again and respondents were asked to make a choice which one they prefer. After the final choice between the monoracial and multiracial ads were made, series of marketing related questions were asked. These included attitudes towards the ads, emotional messages that students receive from the ads and attitudes effectiveness. In total 21 marketing related questions were asked. After answering these questions students left the room and received a survey in a paper form. The survey contained different questions based on social influence, social identity and social distance theories (see appendix for the complete list of survey questions). Below figure summarize the whole process of experiment.
Figure 1. Data collection procedure
Instruction
Show 4 pictures (2 white and 2 mixed ads, 5 second each, order of
appearance randomaized) On each picture responding to the
question: How appealing is the
advertisement?
Forced choice
1. Choose between the two white ads
2. Choose between the two mixed ads
3. Choose between the previously chosen white and mixed ads
(1 and 2 randomaized)
10 questions addressed towards the ad chosen
6 questions addressed towards the ad related to ethnic identity
5 questions on marketing effectiveness
Paper survey Face to face debreifing through open answer questions
ANALYSIS
General descriptive results
The following section will analyze the results generated from the pilot experiment. We excluded non-US born and non-Sweden born students from the analysis. The total number of responses that are analyzed are 47 (23 students from RIT and 24 students from Malmö). More females participated in the study than males (RIT, N= 15 and MAU, N=13).
Table 1. Respondents’ gender and age divided by the country of birth
Which country are you born in?
Age 18-20 21-23 24-26 27-29 30+ Total US Gender Female 5 9 1 0 0 15 Male 4 4 0 0 0 8 Sweden Gender Female 0 4 2 3 4 13 Male 1 4 4 0 2 11 Total 10 21 7 3 6 47
Swedish respondents were older on average compared to the US respondents2, and there
is a greater gender balance in the Swedish respondents.
Descriptive statistics show that in response to the item ‘how appealing is the following advertisement’ (1-7 scale, 4 being neutral), the US and Swedish students do not differ in opinion when it comes to the two advertisements with only white models. However, when it comes to the multiracial advertisement there was a clear difference in responses between the US and Swedish students. A larger number of Swedish students reported that multiracial advertisements were not appealing (12 for multiracial 1 and 14 for multiracial 2). Although not statistically conclusive, these descriptive statistics infer a tendency among Swedish students exhibiting higher preference in monocultural advertisements than the American students. This indicates a further necessity to prove Hypothesis 1.
2 Swedish college students represent older cohorts in general than the US students due to the differences in
educational system in the two countries. The average enrollment age at college in Sweden is 24, and the average age of receiving a Bachelor’s degree is 28, which is among one of the highest in the OECD countries (OECD Education at a glance 2019)
Table 2. Preference of advertisements
Advertisement Country Not appealing Neutral Appealing Total
Monoracial 1 US 6 5 12 23 Sweden 8 8 8 24 Monoracial 2 US 9 6 8 23 Sweden 6 7 7 24 Multiracial 1 US 7 6 10 23 Sweden 12 9 3 24 Multiracial 2 US 6 4 13 23 Sweden 14 6 4 24
The results of the first two forced choices comparing the two monoracial advertisement and the two multiracial advertisements are similar for the US and Swedish respondents. Larger number of US and Swedish students preferred monoracial 1 ad (14 each for each country) and multiracial 2 ad (14 each in each country). This shows that in general when the two monoracial and multiracial advertisements are compared, the perceptions of the advertisements are very similar. This result is interesting considering the previous table which shows that Swedish students responded to a larger extent than the US respondents that the multiracial advertisements were not appealing.
Table 3 Preferences between the ads
US Sweden US SWE
Monoracial 1 14 14 Multiracial 1 9 10 Monoracial 2 9 10 Multiracial 2 14 14
Total 23 24 Total 23 24
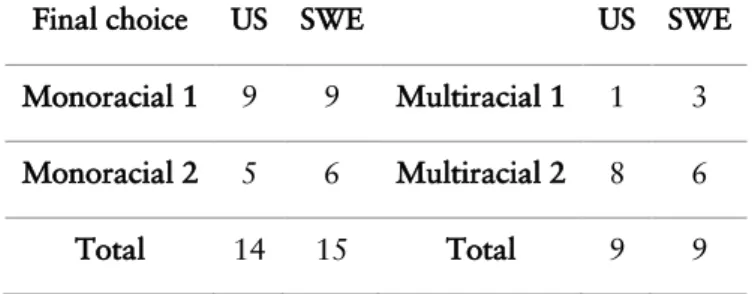
In the final forced choice question where the respondents were asked to make a choice between the monoracial and multiracial advertisements that they chose, monoracial 1 (9 each in Sweden and US) and multiracial 2 ad (8 for US and 6 for Sweden) were chosen as the most preferable ads. In total, 14 US respondents and 15 Swedish respondents chose either monoracial ad 1 or 2 as their final choice. However, we see an inconsistency in this response, especially among Swedish students. Compared to the scores multiracial
advertisement 1 and 2 received on how appealing and not appealing they were, a larger proportion of students choose the multiracial advertisement 2 in the end. This indicates a need to test short-term memory and, moreover, it points to the difference between reporting to what degree the ads are appealing vs which ads are preferable.
Table 4 Final choice between the monoracial and multiracial ads
Final choice US SWE US SWE
Monoracial 1 9 9 Multiracial 1 1 3
Monoracial 2 5 6 Multiracial 2 8 6
Total 14 15 Total 9 9
The reaction times were recorded while answering the three forced choice questions. Swedish respondents took on average a shorter time than the US respondents to choose between the two monoracial ads (5.19 seconds for Sweden and 6.38 seconds for US) and to make a final choice between the monoracial and multiracial ads (3.72 seconds for Sweden and 5.60 seconds for US). The reaction time for multiracial advertisement was about the same (6.14 for Sweden and 6.38 for US). The faster reaction time for monoracial advertisement also may indicate that Swedish students are more used to looking at monocultural advertisements. The reaction time for the final choice was found to be significantly correlated between country of origin; r = -.293, n = 47, p < .05.
Although only 8.58% of the variance was explained, this initial result is promising since it indicates a faster reaction time for Swedes in forced choices between multiracial and monoracial advertisement, the population who theoretically grew up more in a monocultural settings. In future testing, researchers could explore the possibilities of significance between different testing permeations and the relationships between previous interracial contact and the reaction time.
Eye-tracking data
The average accuracy of the recordings was 0.53 degrees (SD = 0.25) for the Swedish participants and 0.51 degrees (SD = 0.25) for the US participants.
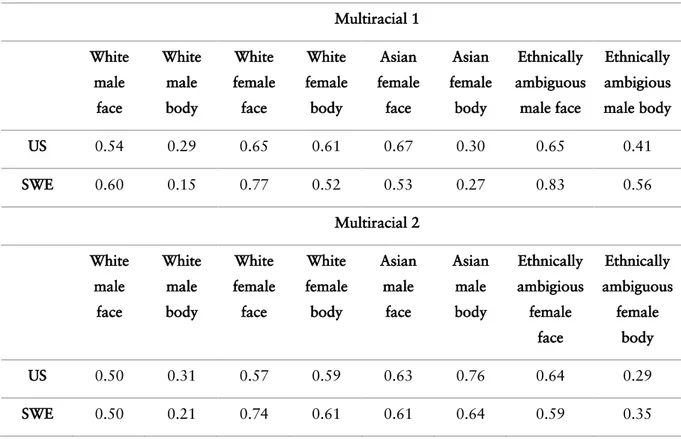
In this experiment we put areas of interests (AOIs) over the facial region and the rest of the body of each person in a stimulus. Table 5 shows the average total dwell time (in seconds) that participants spent looking at faces and body parts of male and female persons of white, Asian, and ethnically ambiguous origin.
Table 5 Average total dwell times (s). Multiracial 1 White male face White male body White female face White female body Asian female face Asian female body Ethnically ambiguous male face Ethnically ambigious male body US 0.54 0.29 0.65 0.61 0.67 0.30 0.65 0.41 SWE 0.60 0.15 0.77 0.52 0.53 0.27 0.83 0.56 Multiracial 2 White male face White male body White female face White female body Asian male face Asian male body Ethnically ambigious female face Ethnically ambiguous female body US 0.50 0.31 0.57 0.59 0.63 0.76 0.64 0.29 SWE 0.50 0.21 0.74 0.61 0.61 0.64 0.59 0.35
Both US and Swedish students’ dwell time was slightly longer for the non-white models’ faces. There is a marked difference between the US and Swedish students in the dwell time for the non-white models’ faces and depending on the gender of the face. Among the Swedish students, we can also see slightly longer dwell time on the non-white male face, compared to the female face. Moreover, non-white male faces recorded longer dwell time compared to non-white female faces (e.g. Ethnically ambiguous male face’s duration mean being 0.83 compared to ethnically ambiguous female face duration mean being 0.59). The opposite results can be observed for the white model’s face that the female face received longer mean dwell time. Among the US students the longer dwell time means for the white female face compared to the white male face is observable however the gender differences in the mean is not evidently observable for the non-white faces. This differences in how long US and Swedish students look at the male and female, white and non-white faces are interesting point to further investigate in the future.
Students’ eye movements showed a tendency that they get fixated for a duration on faces compared to the body, however we found no statistical significance.
Table 6. Total proportion of time spent on looking at the pictures
Face Body Other
Multiracial 1 52.46% 31.16% 16.38% Multiracial 2 47.77% 37.58% 14.64%
Total dwell times were analyzed with linear mixed effects models using R (v. 3.6.1) and the lme4 package (v. 1.1.21) using participants as random effects with random intercepts. The country where data were collected (Sweden/US) was used as independent variable. The following question was addressed: Is there a difference in how much participants look at faces (m0: all faces / m1: only white faces / m2: only Asian faces / m3: only ethnically ambiguous faces) depending on country of origin. Table 7 shows the output of the all linear mixed effect models (m0-m3). As can be seen, the differences are very small and non-significant.
Table 7: Output from the linear mixed effects model from the models m0-m3 (left to right).
Survey results
21 survey items were given to participants. These survey results were correlated with the preference of monoracial and multiracial ads and with the eye-tracking data. Pearson’s R was calculated for all items; the table below only shows the variables which had significant correlations.
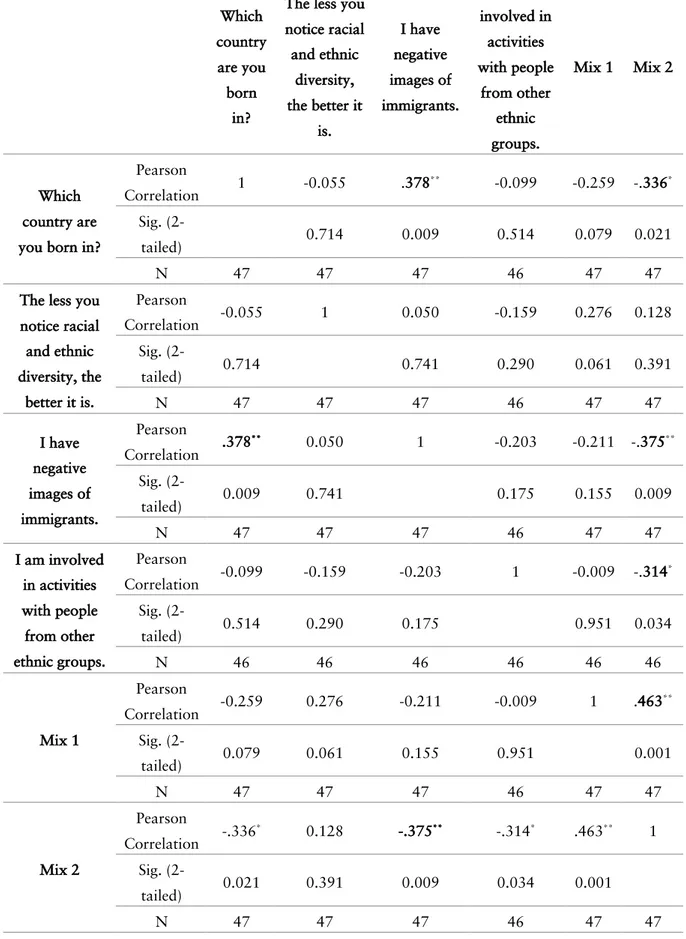
Table 8 Pearson’s R correlation Which country are you born in?
The less you notice racial and ethnic diversity, the better it is. I have negative images of immigrants. I am involved in activities with people from other ethnic groups. Mix 1 Mix 2 Which country are you born in?
Pearson Correlation 1 -0.055 .378 ** -0.099 -0.259 -.336* Sig. (2-tailed) 0.714 0.009 0.514 0.079 0.021 N 47 47 47 46 47 47
The less you notice racial and ethnic diversity, the better it is. Pearson Correlation -0.055 1 0.050 -0.159 0.276 0.128 Sig. (2-tailed) 0.714 0.741 0.290 0.061 0.391 N 47 47 47 46 47 47 I have negative images of immigrants. Pearson Correlation .378 ** 0.050 1 -0.203 -0.211 -.375** Sig. (2-tailed) 0.009 0.741 0.175 0.155 0.009 N 47 47 47 46 47 47 I am involved in activities with people from other ethnic groups. Pearson Correlation -0.099 -0.159 -0.203 1 -0.009 -.314 * Sig. (2-tailed) 0.514 0.290 0.175 0.951 0.034 N 46 46 46 46 46 46 Mix 1 Pearson Correlation -0.259 0.276 -0.211 -0.009 1 .463 ** Sig. (2-tailed) 0.079 0.061 0.155 0.951 0.001 N 47 47 47 46 47 47 Mix 2 Pearson Correlation -.336 * 0.128 -.375** -.314* .463** 1 Sig. (2-tailed) 0.021 0.391 0.009 0.034 0.001 N 47 47 47 46 47 47
Although as previously mentioned, no significant results were found between the duration time on AOI and the survey results, the survey items themselves showed some statistically significant results. For example, the relation between country of origin (US vs Sweden) and negative images of immigrants had a strong positive correlation, r = .378, n = 47, p < .05. Here, 14.29% of the variance is shared between ‘I have negative images of immigrants’ and country of origin. The positive relationship as well indicates this result was found for Swedish participants. Country of Origin was found to be negatively correlated with the preference of the second mix ad, r = -.338, N = 47, p < .05. This means that individuals from Sweden were more likely to rate the Mix 2 ad lower, although a small of amount of the variance was shared 11.29%.
Preferential rating of the second multiracial ad was also found to have three additional significant correlations; with ‘I have negative images of immigrants’, (r = -.375, N = 47, p < .05), ‘I am involved in activities with people from other ethnic groups’ (r = -.314, N = 47, p < .05), and Mix 1 (, r = .463, N = 47, p < .05). Those participants with less negative images of immigrants surprisingly found the second Multiracial ad to be less favorable, with 14.06% of the variance shared. This result was mirrored by the negative correlation found between shared activities with people from other ethnic groups and multiracial 2 ad, however only 9% of the variance was shared. Unsurprisingly, 21.44% of the variance was shared between positive ratings of the first and second Multiracial ad.
Correlation results show an interesting pattern which needs to be explored more in-depth with further studies. For example, the participants with less negative images of immigrants finding the second Multiracial ad to be less favorable can depend on the gender and the type of ethnic and racial diversity presented by the model. Even though we cannot draw a statistically reliable conclusion, we can confirm the hypothesis 2: Swedish and American students with higher prior interracial exposure exhibit higher preference in multicultural advertisement. In future studies, test group size should be expanded to a minimum of 50, as to allow for potential gender effects in addition to country of origin.
Responses to the open questions
The respondents were asked two open questions in a face-to-face interview. The two questions were addressed to the choice the respondents made;
1. Why did you choose this ad and why not the other ad? 2. What did you like about the most in this ad that you chose?
The responses were coded according to the five broad recurring themes: Body type, gender, diversity, ethnicity/culture and race/skin color. The detailed counts of the responses are summarized in the table below.
Table 9. Counts on common expression to the open questions
Topic US Sweden
Body type Noticing body types in the ads shown 2 9
Diversity in body types should be represented in ads 1 3
Gender Noticing gender in ads shown 3 12
Not noticing gender in ads shown 0 4 Diversity in gender representation is positive 1 0
Diversity Noticing diversity in the ads shown 3 4
No diversity in the ads shown 1 2
Promoting diversity 7 18
You should not force diversity in ads 3 9
Don't care about diversity 1 3
Lack of diversity in the ads in general 5 4 Acceptance/openness towards diversity 0 6 What about other types of diversity than ethnic diversity? 0 1 Ethnicity/culture Lack of ethnic differences in ads shown 3 6 Noticing ethnic diversity in the ads shown 2 3 Did not focus on the ethnicity of the models in the ads shown 5 8 Noticing different cultures in the ads shown 0 2
Ethnic quota in the ads 0 1
Race/skin color Not noticing racial differences of the models in the ads shown 5 0 Not noticing racial diversity in the ads shown 4 0 White models were presented in the ads shown 1 3 Different skin color in the ads shown 0 2 Light and dark-skinned models in the ads shown 0 6 Did not look at the race of the models in the ads 1 1
The differences in the pattern of responses between the US and Swedish students are interesting. The striking differences are in Swedish students’ attention on the body types and gender represented in the ads compared to US students. Moreover many Swedish respondents expressed the idea that diversity should be promoted, while at the same time many explicitly said that diversity should not be forced.
Another noticeable difference is the vocabulary used and the different levels of focus that US and Swedish students give when it comes to ethnic and racial diversity in the ads. While US participants mentioned many times that the racial diversity was not noticed, Swedish students gave specific accounts of the white models and skin color of the models. These differences are interesting having in mind that the population in both countries are considered to hold high level of color-blind ideas (e.g. Bonilla-Silva, 2010; Osanami Törngren, 2019). Especially in the Swedish context, there has been a belief that talking about race is a taboo, however these accounts made by the participants of this study shows how Swedes see and categorize people in terms of skin color.
CONCLUDING REMARKS
In this pilot study, we could not find a statistically significant correlation between the eye-tracking data, ad preference and attitudes reported on the survey. We did not find Swedish students exhibiting higher preference in monocultural advertisements more than American consumers. Mixed results were found when analyzing whether Swedish and American students with higher prior interracial exposure exhibit higher preference in multicultural advertisement.
In eye-tracking research it is important to refine the hypothesis and match it carefully with the research design. We started with the two hypothesis which we could measure and analyze through conducting a larger scale survey without eye-tracking. It is necessary to ask the question what eye-tracking data can add to the survey and incorporate hypothesis accordingly.
We assume several reasons lay behind this significant result. First is the non-controlled nature of the advertisement. We chose already existing fashion ads which contributed to the ads being believable, however too heterogeneous and contained many aspects that drew visual attention. For example, it was evident that a pair of blue pants one of the female models was wearing received attention and many respondents mentioned this in the debriefing process. Other aspects of the picture that drew visual attention were related to the postures of the models and hairstyles. Ideally, we should have chosen four identical pictures with only the models differing. The number of pictures shown were too small to be able to control for the effects of the mentioned aspects of the pictures. The sample size was also small since we designed it as a pilot study, and in order to conduct a comparative study we need a larger sample.
Despite the limitation of the study, we still identified some interesting tendencies. These are for example a larger number of Swedish respondents reporting multiracial advertisement to be not appealing, Swedish respondents’ faster reaction time to forced choice questions, and the differences in the mean fixation duration time between the US and Swedish respondents on different faces and gender. Qualitative results also point to different ways of addressing race, ethnicity and diversity among Swedish and US respondents. These are all only based on the descriptive analysis, however interesting to pay further attention to. The statistically significant correlation between the previous interracial contact and the preference of multiracial ads is also interesting, even though we did not find any correlation to this result with eye-tracking data. Moreover, the results also indicate the need to conduct a memory testing tasks as well.
We do believe that eye-tracking method could not be used in its full potential for this pilot study, however the results shows tendencies which needs to be addressed in further studies. We hope that this article serves as a first step and an inspiration for other migration and ethnic studies researchers to explore the potential of utilizing eye-tracking methods in the field.
AVAILABILITY OF DATA AND MATERIALS
The datasets generated and/or analyzed during the current study are not publicly available due to the personal data protection law and the nature of the experiment being a pilot study but are available from the corresponding author on reasonable request.
FUNDING
This pilot study was made possible through funding by RIT Global Education Grant and FORMAS.
AUTHORS’ CONTRIBUTION
SOT and EM are responsible for the pilot study design and the theoretical framework of the study. All the authors contributed equally to the data gathering process. SOT analyzed and interpreted the survey and the eye-tracking data together with CA and MN. All authors read and approved the final manuscript.
REFERENCES
Åkestam, N. (2017). Understanding advertising stereotypes.
Allport, G. W. (1979). The nature of prejudice (Unabridg, 25th anniversary ed.). Reading, Mass.: Perseus books.
Blais, C., Jack, R. E., Scheepers, C., Fiset, D., & Caldara, R. (2008). Culture shapes how we look at faces. PloS One, 3(8), e3022.
Bonilla-Silva, E. (2010). Racism without racists : Color-blind racism and the persistence of racial inequality in the united states (3rd ed.). Lanham: Rowman & Littlefield Publishers.
Brune, Y. (2002). 'Invandrare' i mediearkivets typgalleri. In W. Knocke, P. De los Reyes, I. Molina & D. Mulinari (Eds.), Maktens (o)lika förklädnader : Kön, klass & etnicitet i det postkoloniala sverige : En festskrift till wuokko knocke (pp. 150-181). Stockholm: Atlas.
Chuk, T., Crookes, K., Hayward, W. G., Chan, A. B., & Hsiao, J. H. (2017). Hidden markov model analysis reveals the advantage of analytic eye movement patterns in face recognition across cultures. Cognition, 169, 102-117.
Dixon, T. L., Weeks, K. R., & Smith, M. A. (2019). Media constructions of culture, race, and ethnicity. Oxford research encyclopedia of communication ()
Edström, M. (2018). Visibility patterns of gendered ageism in the media buzz: A study of the representation of gender and age over three decades. Feminist Media Studies, 18(1), 77-93.
Freeman, J. B., Pauker, K., & Sanchez, D. T. (2016). A perceptual pathway to bias: Interracial exposure reduces abrupt shifts in real-time race perception that predict mixed-race bias. Psychological Science, 27(4), 502-517.
Fujioka, Y. (1999). Television portrayals and african-american stereotypes: Examination of television effects when direct contact is lacking. Journalism & Mass Communication Quarterly, 76(1), 52-75.
Gans, H. J. (1979). Symbolic ethnicity: The future of ethnic groups and cultures in america*. Ethnic and Racial Studies, 2(1), 1-20.
Gokieli, N. (2017). I want us to trade our skins and our experiences”: Swedish whiteness and “Immigrant literature. Scandinavian Studies, 89(2), 266-286.
Hayward, W. G., Lao, J., Cheng, Z., Crookes, K., Liu, T. T., & Caldara, R. (2013). Eye movements for scrambled faces. Journal of Vision,
Hesapci, O., Merdin, E., & Gorgulu, V. (2016). Your ethnic model speaks to the culturally connected: Differential effects of model ethnicity in advertisements and the role of cultural self-construal. Journal of Consumer Behaviour, 15(2), 175-185.
Holmqvist, K., Nyström, M., Andersson, R., Dewhurst, R., Jarodzka, H., & Van, d. W. (2011). Eye tracking: A comprehensive guide to methods and measures OUP Oxford.
Just, M. A., & Carpenter, P. A. (1980). A theory of reading: From eye fixations to comprehension. Psychological Review, 87(4), 329.
Karlsson, H. (2014). Ruben östlund’s play (2011): Race and segregation in ‘good’liberal sweden. Journal of Scandinavian Cinema, 4(1), 43-60.
Kelly, D. J., Liu, S., Rodger, H., Miellet, S., Ge, L., & Caldara, R. (2011). Developing cultural differences in face processing. Developmental Science, 14(5), 1176-1184. Khosravi, S. (2009). Displaced masculinity: Gender and ethnicity among iranian men in
sweden. Iranian Studies, 42(4), 591-609.
Krosnick, J. A. (2002). The causes of no-opinion responses to attitudes measures in surveys: They are rarely what they appear to be. In R. M. Groves, D. A. Dillman, J. L. Eltinge & R. J. A. Little (Eds.), Survey nonresponse (pp. 87-100). New York ; Chichester: Wiley.
Luria, S. M., & Strauss, M. S. (2013). Comparison of eye movements over faces in photographic positives and negatives. Perception, 42(11), 1134-1143.
Maree, T., & Jordaan, Y. (2016). Rainbow nation, rainbow advertising? racial diversity of female portrayals in south african television commercials. Gender & Behaviour, 14(1)
Mastro, D. (2015). Why the media's role in issues of race and ethnicity should be in the spotlight. Journal of Social Issues, 71(1), 1-16.
Mastro, D. (2017). Race and ethnicity in US media content and effects. Oxford research encyclopedia of communication ()
Mastro, D. E., & Kopacz, M. A. (2006). Media representations of race, prototypicality, and policy reasoning: An application of self-categorization theory. Journal of Broadcasting & Electronic Media, 50(2), 305-322.
Migrationsverket. Statistik. Retrieved Mar 30, 2019, from
https://www.migrationsverket.se/Om-Migrationsverket/Statistik.html
National Academies, o. S. (2015). In Mary C. Waters, Marisa Gerstein Pineau (Eds.),
The integration of immigrants into american society. Washington, DC: The National Academies Press. doi:10.17226/21746
Niehorster, D.C., Andersson, R., & Nyström, M., (submitted). Titta: A toolbox for creating Psychtoolbox and Psychopy experiments with Tobii eye trackers. Osanami Törngren, S (2016) “Examination of the role of interracial contacts on
attitudestoward interracial marriages – the case of Sweden.” Ethnicities. Vol 16:4. pp. 649-683.
Osanami Törngren, S (2018) “Talking Colorblind – Justifying and Rationalizing Attitudes toward Interracial Marriages in Sweden.” In Peter Hervik ed.
Racialization in the Nordic Countries. New York. Palgrave Macmillan. pp. 137-162.
Peñaloza, L. (2018). Ethnic marketing practice and research at the intersection of market and social development: A macro study of the past and present, with a look to the future. Journal of Business Research, 82, 273-280.
Pettigrew, T. F., Tropp, L. R., Wagner, U., & Christ, O. (2011). Recent advances in intergroup contact theory. International Journal of Intercultural Relations, 35(3), 271-280.
Punyanunt-Carter, N. M. (2008). The perceived realism of african american portrayals on television. The Howard Journal of Communications, 19(3), 241-257.
Rodger, H., Kelly, D. J., Blais, C., & Caldara, R. (2010). Inverting faces does not abolish cultural diversity in eye movements. Perception, 39(11), 1491-1503.
Scharrer, E., & Ramasubramanian, S. (2015). Intervening in the media's influence on stereotypes of race and ethnicity: The role of media literacy education. Journal of Social Issues, 71(1), 171-185.
Sobol, K., Cleveland, M., & Laroche, M. (2018). Globalization, national identity, biculturalism and consumer behavior: A longitudinal study of dutch consumers.
Journal of Business Research, 82, 340-353.
Song, M. (2003). Choosing ethnic identity Polity Press Cambridge.
Statistics Sweden. Antal personer med utländsk eller svensk bakgrund (fin indelning) efter region, ålder och kön. år 2002 - 2018. Retrieved Mar 29, 2019, from http://www.statistikdatabasen.scb.se/pxweb/sv/ssd/START__BE__BE0101__BE0 101Q/UtlSvBakgFin/
Swedish Migration Agency. History. https://www.migrationsverket.se/English/About-the-Migration-Agency/Migration-to-Sweden/History.html
Tukachinsky, R., Mastro, D., & Yarchi, M. (2015). Documenting portrayals of race/ethnicity on primetime television over a 20-year span and their association with national-level racial/ethnic attitudes. Journal of Social Issues, 71(1), 17-38. Ulver, S., Åkestam, N., Rosengren, S., Laurell, C. (2019, Juni 7). DN
Debatt. ”Mångfalden har inte ökat i den svenska reklamen”
https://www.dn.se/debatt/mangfalden-har-inte-okat-i-den-svenska-reklamen/?fbclid=IwAR3fbzcEJMFo9li9TW82malQW2AW2w9evLghXMFdeJ W-OWFN1JxH37GwYuc
Walker-Smith, G. J., Gale, A. G., & Findlay, J. M. (1977). Eye movement strategies involved in face perception. Perception, 6(3), 313-326.
Waters, M. C. (1990). Ethnic options: Choosing identities in america Univ of California Press.
Yarbus, A. L. (1967). Eye movements during perception of complex objects. Eye movements and vision (pp. 171-211) Springer.