Sammanfattning
Användandet av avancerade konstruktionskeramer förutspås öka kraftigt under de närmaste åren. De används nu i ett stort antal applikationer där framförallt slitage, vikt och värmebeständighet är viktiga faktorer. Då produktionsvolymerna ökar, processtekniken förbättras och användare blir mer medvetna om fördelarna, förväntas användandet accelerera än mer.
Vi har i denna rapport tittat på möjligheter för SKF att hitta affärsmöjligheter där produkten är tillverkad av avancerade keramiska material. SKF har inlett ett samarbete med en amerikansk tillverkare, Keramera1, som redan idag förser en del av marknaden med keramiska produkter. Möjligheter att använda sig av Keramera som leverantör har beaktats i rapporten.
Meningen med detta arbete är att hitta lämpliga keramiska komponenter och applikationer för SKF att sälja och för arbetets överblick har förfarandet delats upp i tre delar. Den första delen är en kartläggning av ett stort antal komponenter som är utvärderade och rankade, där en databas innehållande cirka 140 stycken komponenter är skapad. Komponenterna är utvärderade och rankade för att möjliggöra en grov första sållning av komponenter som inte är intressanta att gå vidare med. Det andra arbetssteget består av en analys och utvärdering av affärsmöjligheter för sex stycken utvalda komponenter och applikationer; kulventiler för oljepumpar, kamaxelrullar för dieselmotorer, mekaniska plantätningar för pumpar i livsmedels- och pappersindustrin, avvattningslister för papperstillverkningsmaskiner, bromsskivor för tågvagnar och bränsleinsprutningssystem baserat på piezo-teknik (PZT) för motorer.
Det sista steget slutligen, är en mer djupgående analys av en komponent – kulventiler för oljepumpar. Vi tror att detta är en möjlig väg för SKF att snabbt hitta en ny affär. Emellertid krävs mer kunskap om komponenten och dess marknad innan man ger sig in här på allvar. Detta ska anses som en sidoaffär och man bör även beakta hur väl i linje med sin kärnaffär man vill vara när man utvecklar affärsmöjligheter. I detta fall ligger både keramiska bromsskivor och mekaniska plantätningar väl i linje med SKF:s kärnprodukt och en mer djupgående utvärdering av dessa områden föreslås.
1
Abstract
Engineering ceramics follow a persistent technical evolution with an increasing amount of applications within advanced industrial solutions. As it is a part of the technological progress, it is of importance that SKF maintain an understanding within the area and stay alert with changes in the environment.
There are three main deliveries generated from this report; a market scanning of the most interesting components within the field of advanced ceramics, a business evaluation for six products and an in-depth analysis of the best suited component for an immediate business opportunity. Special consideration when searching for the new business opportunities has been taken throughout the report to the collaboration with a manufacturer of advanced ceramics, Keramera. 2
A market scanning has resulted in a database containing around 140 components with useful information for further research. The database can advantageously be used as a tool for market factors, producer information and customer problem/need. A business evaluation is created for the ceramic components: check valve balls for oil production, cam follower rollers for diesel engines, brake discs for train carriages, mechanical face seals used in pumps in the food and paper machine industries, slotted dewatering foils for paper machines and fuel injection for engines with possibilities for SKF to transfer this technology into automatic lubrication systems for bearings.
Finally, an in-depth analysis considers check valve balls for sucker rod pumps for oil extraction. We have found that there are good possibilities for SKF to explore this market at low cost and risk, but further knowledge about the market and the application need to be gained. The component is widely used and a ceramic solution is, technically, among the most suitable.
Furthermore, we believe that strategic decisions for business development need to be taken. To add more value to today’s core proposition, bearings, both mechanical face seals and brake discs are well in line with SKF’s core business. Further analyses on these applications are recommended.
2
TABLE OF CONTENTS
1 INTRODUCTION ... 4
1.1 PURPOSE AND OBJECTIVES... 5
1.2 THESIS STRUCTURE... 5
1.3 DELIMITATIONS... 6
2 THEORETICAL FRAMEWORK... 7
2.1 THE FIRST STAGE –MARKET SCANNING... 7
2.1.1 Evaluation Method for the Database ... 8
2.1.2 Ansoff’s Matrix ... 8
2.1.3 Technology Adoption Theory... 10
2.1.4 Selection of Components... 11
2.2 THE SECOND STAGE –BUSINESS EVALUATION... 13
2.2.1 Internal Analysis – Resource Mapping... 14
2.2.2 Industry Competitiveness – Five Forces Analysis... 18
2.2.3 SWOT Analysis ... 20
2.3 THE THIRD STAGE –IN-DEPTH ANALYSIS OF A SINGLE BUSINESS OPPORTUNITY... 22
2.3.1 Building a Business ... 22
2.4 SUMMARY OF THE THEORETICAL FRAMEWORK... 25
3 METHODOLOGY ... 26
3.1 DATA COLLECTION... 26
3.1.1 Interviews ... 26
3.1.2 Validity and Reliability ... 27
4 RESULTS AND ANALYSIS ... 28
4.1 THE DATABASE... 28
4.2 PROCESSING AND EVALUATION OF COMPONENTS... 29
4.2.1 Ansoff Matrix ... 31
4.2.2 First Selection – Six Components ... 33
4.3 INTERNAL ANALYSIS –RESOURCE MAPPING... 34
4.3.1 Resources and Capabilities ... 34
4.3.2 Resource Gaps... 39
4.4 INDUSTRY COMPETITIVENESS –FIVE FORCES ANALYSIS... 41
4.5 SWOT ANALYSIS... 47
4.6 SECOND SELECTION –ONE COMPONENT... 52
5 IN-DEPTH ANALYSIS OF A SINGLE BUSINESS OPPORTUNITY ... 54
5.1 BACKGROUND AND PURPOSE... 54
5.2 CUSTOMER PROBLEM... 55
5.3 SOLUTION... 56
5.4 MARKET... 58
5.4.1 The Oil Industry... 58
5.4.2 Potential ... 59
5.4.3 Market Size and Value ... 59
5.5 COMPETITIVE SITUATION... 61 5.6 RISKS... 62 6 CONCLUSIONS... 63 7 DISCUSSION ... 66 8 RECOMMENDATIONS ... 68 9 REFERENCES ... 70 APPENDIX... 74
1 Introduction
Advanced engineering ceramics continuously find new application areas within a wide range of industry sectors. The ceramic solutions generally hold better material advantages such as hardness, wear, chemical resistance, resistance against electrical corrosion, weight reduction, better reliability as well as increased life length.
Figure 1. An overview of the different application areas is shown, where advanced ceramic solutions can be chosen. The parts of most interest for SKF are found in the mechanical group to the right in the figure. (Source: Glynwed, Company Presentation).
Today, there is a considerable amount of components and products that could be replaced by ceramics instead of the more conventional metal alloys and thermally coated solutions. Apart from existing products that could be improved, there are also possibilities to develop new products using ceramic materials within the collaboration frames. SKF, together with other bearing manufacturers have used ceramic balls in bearings for a number of years.
An American manufacturer of advanced engineering ceramics, Keramera provides SKF with ceramic rollers for hybrid bearings today. SKF and Keramera have recently initiated extended collaboration which enables SKF to look at additional customer solutions with ceramics.
With this background, SKF seeks to examine possibilities to broaden its business with additional components made of advanced engineering ceramics. The main materials of interest when discussing ceramics are silicon nitride, silicon carbide and aluminium oxide, to name a few.
Keramera is currently active in different markets with a range of products. For example, the ceramics are used for personnel armour within the defence industry, orthodontic brackets within orthodontics, as well as for components used in motors for heavy trucks.
Initiator of this project is SKF Austria with Rudolf Groiβmayr as principal originator. Most of the work is done in close understanding with Industrial Division Prominent Needs Development, SKF Gothenburg. Discussions regarding choosing the suitable track and important decisions concerning selection of components have been held throughout the process of the project in agreement with the “project team”. The project team is primarily Rudolf Groiβmayr, Göran Lindsten and the authors: Johan Magne and Erik Kvarmo.
1.1 Purpose and Objectives
At present, SKF possesses knowledge and experience of hybrid bearings, together with a few other areas where ceramics are used.
There is a need for SKF to get more comprehension of the market for components with possible use of advanced engineering ceramics, and this project seeks to give a broad picture of the market as well as to identify and evaluate new business opportunities, primarily based on the collaboration between SKF and Keramera. The purpose for SKF is to broaden its business in markets with components made of advanced engineering ceramic material and to look for new business opportunities.
A key objective for SKF is to understand which products and components that have the most promising business opportunities, according to the use of advanced engineering ceramics.
1.2 Thesis Structure
The thesis is arranged by the following main sections: Introduction, Theoretical Framework, Methodology, Results and Analysis, In-depth Analysis of a Single Business Opportunity, Conclusions, Discussion, Recommendations and finally Appendix, which provides the reader with additional information.
The theoretical framework is a description of the theories and models utilized in order to support the processing of information and data. At that point, a three-stage model is described, which permeates the entire report. After each stage, there are queries we aim to elucidate, which are summarized and explained in the Problem Analysis section. Furthermore, in the Methodology section we discuss how the investigation is done and the aspects concerning reliability and validity. The Results and Analysis section is the main part of the first and second stages containing a database and analyses on the six selected components, and thus aspires to answer the queries asked. The third and last stage contains an In-depth Analysis for one selected component within a specific application. Finally, conclusions are drawn in the Conclusion chapter and the line of reasoning is treated in the Discussion chapter. Suggestions for further progression for SKF are proposed in the last section, Recommendations. Throughout the report, numerous elements (components) are described, which are used in different applications and divided into segments. Not to confuse the reader and to clarify the terminology used, these elements are named as components. A component can be used in various different applications, and be divided into segments.
1.3 Delimitations
In the broad first selection of components to the database, we have not considered all components existing today. Instead, the selection descended mainly from discussions with experts in the ceramic field and material specialists together with prominent ceramic manufacturers’ assortment and consideration of what is of interest for SKF. However, the selection does also show components that after further investigation have ended up being outside the frame of the interest for the project and SKF.
Six components are chosen from the database. There are more components than these six that are of interest, but due to limitations in time and/or suitability for SKF, only six are further investigated. Moreover, the last part, the in-depth analysis, treats one component and should be regarded as an outline of a business case, thus not an entire business plan, due to the same time restrictions. In order to use this analysis as a foundation for decision making, more investigation has to be done. We have not had the resources, time and high-quality contact channels to be able to monitor all the critical facts needed for an entire business plan.
Moreover, because of the somewhat two-dimensional focus with both a broad mapping of the ceramic possibilities on the one hand, and an in-depth analysis on one business opportunity on the other, adequate balance between the parts has been a requisite to obtain and to work after.
2 Theoretical
Framework
In this chapter, models and theories used for data collection, results and analysis are described. The models are presented briefly to get enough understanding about why they are used and with what feature they can contribute in the support of logical steps in the phases of the analysis. As mentioned, the report is divided in three stages in order to obtain an easier overview and access to results as well as conclusions. All three stages are shown in the below figure.
Figure 2. The figure displays the process of the project and how the focus of the objectives will gradually change as the working process carry on.
The first stage is called market scanning and it includes a collection of components gathered in a database. The components are all evaluated with estimations for a number of factors. They are also ranked according to an evaluation system, described in the sub-section called Evaluation Method for the Database. We have also grouped a number of selected components in the market scanning according to their position in the ranking list and other factors. The other factors are, for example, certain circumstances suggested from the project team. The second ranking consists of a few components only, where the components are grouped, processed and selected for the next and second stage, Business Evaluation. Both internal analyses and external analyses are made in this stage. For the internal analyses, resource mapping and gap analysis are used, and for the external analyses, the five forces model by Porter is utilized. Furthermore, to make the interconnection of the internal factors with the external possible, a SWOT analysis is the groundwork.
Factors as technology adoption life cycle and time perspective (time-to-market) are discussed in addition to the internal, external and SWOT analyses. The in-depth analysis finally, is based on business plan construction models.
2.1 The First Stage – Market Scanning
In the first stage, numerous ceramic components are gathered in a database, which includes, for SKF, relevant ceramic components. The components are ranked according to evaluation values. The values for each component are processed with an algorithm which led to an overall ranking, out of which a number of components were picked for further analysis. The components are subsequently grouped in order to enable the selection of one component form each group. The tool used for the grouping
and association is the Ansoff matrix, which supports how to do the selection when considering market and product strategies.
2.1.1 Evaluation Method for the Database
The database and description for it is found in the Results and Analysis section as it requires a more practical description before a theoretical. However, the ranking of its content is subject for a description in this section. An algorithm based on the values for each row of components is created, which supports a ranking used to find out which components to select for the further investigation. The evaluation seeks to illustrate an overall rating and ranking of the various elements, and is performed in order to be able to get a rough guideline of which applications that are more important for this work than others. Furthermore, a weighting is done for the different factors, since there is an internal difference of importance of the factors. For example, a “2” in Ease of Entrance is worth more (of higher importance) than a “2” in for example Future Market Value. These values are formed through discussions with the team. A detailed explanation for how the evaluation is done is found in Appendix A – Spreadsheet on Engineering Ceramics, in the Evaluation section.
2.1.2 Ansoff’s Matrix
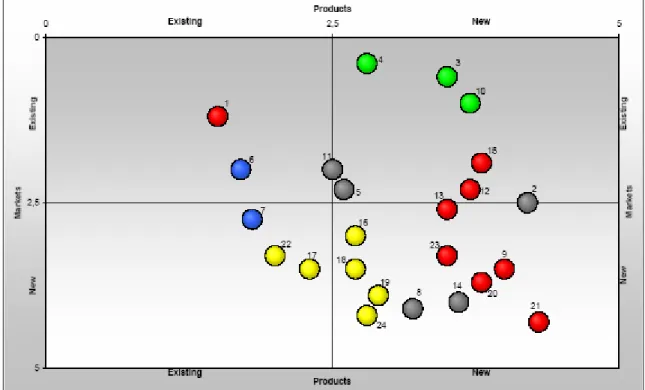
In order to support the selection, and in addition to the ranking, a grouping of components is made by an Ansoff matrix3 as it is a useful tool for indication of important strategy factors. The groups present different characteristics, and when having selected important parameters of strategic growth, six components are selected, to represent each group.
The Ansoff matrix portrays alternative corporate growth strategies with focus on the future and current products and customers, and offers strategic choices to achieve the objectives, considering ways to grow via existing products and new products, and in existing markets and new markets. These alternative directions, in which development can be made, are outlined in the following figure.
Figure 3. Ansoff’s matrix focuses on the present and potential products and markets. Considering different ways to grow, there are four possible product-market possibilities. (Source: Ansoff, 1957).
3
Ansoff (1957)
Existing Markets/Existing Products
Market penetration involves gaining market share as opposed to maintaining it (consolidation). When the overall market is growing, penetration may be relatively easy to achieve, because the absolute volume of sales of all firms in the market is growing and some firms may not be able to satisfy demand. In static or declining markets, a firm pursuing a market penetration strategy is likely to face intense competition.
The 'do nothing' strategy implies the continuation of an existing strategy. It may be appropriate in the short-term when the environment is static or when the firm is waiting to see how situations develop. However, in the long term, such tactics are unlikely to be realistic or beneficial. They may reflect a lack of strategic awareness on part of the management team.
Withdrawal may take place through the sale of business or through divestment, the sale of part or all of the business. Withdrawal may be an appropriate strategy if:
- There is an irreversible decline in demand. - The firm is over extended.
- The firm is adversely affected by competitive pressure and environmental change.
- The opportunity cost is such that a better return can be earned if the resources used in the particular line of business are engaged elsewhere.
Large conglomerate groups sometimes find themselves too thinly spread and many choose to withdraw from selected markets. Consolidation takes place when a firm concentrates its activities on those areas where it has established a competitive advantage and focuses its attention on maintaining its market share. When this strategy has been prompted by falling profits, the situation is often referred to as retrenchment. Both cases may involve the firm in improvements to cost structure, increased emphasis on quality and increased marketing activity. In the case of retrenchment, the cost reductions may involve redundancies or the sale of assets.
New Markets/New Products
Diversification can be classified as:1. Horizontal 2. Vertical 3. Conglomerate
1. Horizontal diversification refers to the development of activities which are complementary to or competitive with the organization’s existing activities. It is often difficult to distinguish between horizontal diversification and market penetration because classification depends on how narrowly product boundaries are drawn.
2. Vertical integration refers to the development of activities which involve the preceding or succeeding stages in the organization’s production process. Backward or upstream vertical integration takes place when the organization engages in an activity related to the proceeding stage in its production process. Forward or downstream vertical integration takes place when the organization engages in an activity related to a succeeding stage its production process.
Obvious examples of vertical diversification include the brewers' control of public houses and the oil industry's combination of exploration, refining and distribution.
3. Conglomerate diversification refers to the situation where at face value the new activity of the organization seems to bear little or no relation to its existing products or markets. The advantages of diversification include:
• Cost savings due to the effects of synergy (where the combined effect exceeds the sum of the individual effects)
• Spreading of risk
• Control of supplies (mainly related to vertical integration)
• Control of markets (mainly related to vertical integration)
• Improved access to information
• Escape from declining markets
• Exploitation of under-utilized assets
• Possible disadvantages of diversification include: • Inefficiency due to loss of synergy
• Inefficiency due to loss of managerial control
Existing Markets/New Products
Product development involves the firm in substantial modifications, additions or changes to its present product range, but it operates from the security of its established customer base. In research and development-intensive industries, product development may be the main direction of strategy because product life cycles are short, and because new products may be a natural spin-off form the research and development process. New product development can be risky and expensive.
The product development strategy means increasing the revenue by, for example, promoting the product, repositioning the brand, and so on. However, the product is not altered. It has been SKF’s desire for us to search for business opportunities within either this development strategy or the following, in new market/existing products (Market development strategy), since they allow growth at lower risk and cost.
New Markets/Existing Products
Market development can include entering new geographical areas, promoting new uses for an existing product and entering new market segments. It is an appropriate strategy to pursue when the organizations distinct competence rests with the product rather than the market.
The product and market development strategies, when either marketing an existing product to a new market, or promoting a new product to an existing market are, as said earlier, less risky projects than the diversification direction.
2.1.3 Technology Adoption Theory
The dynamics that subsist behind the reasons why a certain product gain success whereas others, not seldom with better technology and perhaps better financial capability, fail. In a high-tech market, by
observing the following bell curve, there is a crack between early adopters and early majority of a technological solution.4 A lot of companies with excellent technological solutions disappear into the chasm and each company has to struggle in this early period of a product’s life cycle. Difficulties in crossing the chasm will depend to a large extent on the mentality of the customer, and the willingness to adopt the technology.
Figure 4. The revised technology adoption life cycle. The area below the Bell curve indicates the amount of adopters of the technology. (Source: Moore, 1991).
Firstly shown are innovators – which pursue new technology components aggressively, early adopters – like innovators, early in a product’s life cycle, but more general, early majority – driven by technology process but also by a strong sense of practicality and wants to see well-established references before investing, late majority – awaiting an established standard and finally laggards – that do not want anything to do with new technology
.
There are gaps between all the different stages of the life cycle. In the figure is the most critical chasm displayed. A second crack, apart from the chasm displayed above, can be found, of approximately the same magnitude, which falls between the early majority and the late majority. The difference is that the market is well developed there and concerns the end user to be technologically competent and also the reluctance to invest before the references and standards have been well-established.
Different strategies are regarded depending on the nature of the product as well as location in the technology adoption life cycle. These aspects are important to consider when it comes to deciding on components to continue with.
2.1.4 Selection of Components
A selection of some components from the database is necessary in order to narrow down the task. Special consideration is taken to either the market development or product development sections in the Ansoff matrix. However, a selection of some components implies at the same time that others are deselected. The ranking of the components in the database can therefore also be seen as a tool to filter out components that are not selected. Nonetheless, there might be, far down in the list, components which are not selected, since the evaluation algorithm does not give an absolute and objective truth. From the upper part of the database ranking, 24 are handpicked in agreement with the project team. There is no specific reason why it is exactly 24 components, rather than when the components were grouped; it turned out to be a suitable amount to choose.
4
Moore (1991)
As stated above, many of the selected components fit into groups according to similarities in which industry the application is utilized. Out of the first 24 selected components, six of them are selected for the evaluation of business opportunities. The selection is based on, among other factors, technology adoption theories, which relates, as described earlier to which factors that make a product moving from being a product purchased by the early adopters to be a volume product. The product is interesting if there is a clear potential to be a precursor for other, larger, markets.
The products located in the product development section together with the ones located in the market development section of the Ansoff matrix, are assenting from SKF’s point of view regarding the technology adoption cycle, whereas especially the diversification is farther from the stated choice of growth strategy.
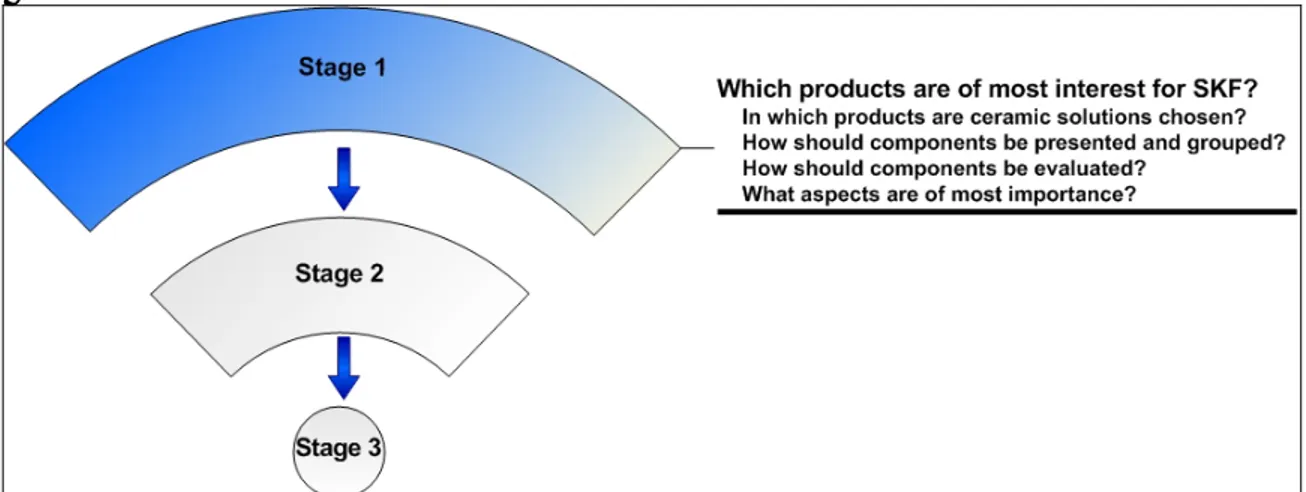
Summary of Stage 1
In the Market Scanning (stage 1), some questions are to be considered in order to keep on track. The overall question is: Which products are of most interest for SKF? The other questions are found in the following figure and they are reflected in the Results and Analysis section.
Figure 5. The questions asked in stage 1, of which the theory of this section aspires to reflect. These are considered in the results part.
2.2 The Second Stage – Business Evaluation
The first stage deals with the market scanning; a broad outlook, while in the second stage, the focus is narrowed down to deal with six components. These components are studied from different perspectives as shown in the figure below. For this second stage, additional data is collected.
Figure 6. This figure shows the interaction of the internal analysis and the external. The internal analysis consists in mapping of SKF’s internal resources, where the most important elements incorporated are resources, capabilities and gaps. The external analysis is supported by the industry competitiveness analysis. These two aspects are combined in a SWOT analysis that summarizes the study of the selected components.
The figure used is somewhat re-worked from its original structure in order to better fit our objectives. It is supported by the connections and relationships between determined strategic industry factors, and firm level resources, capabilities and strategic assets.5 The left side of their model is modified from showing resources, capabilities and strategic assets to contain a strategy formulation model.6 This procedure is used because the internal analysis in this report focus more explicitly on resources, capabilities and gaps than on strategic assets. Moreover, an internal analysis is performed where SKF’s resources and capabilities are observed, and as they are influenced by external factors, the strategic industry factors are also examined. To manage the interaction of both
5
Amit and Schoemaker (1994)
6
Grant (1991)
sides of the theories, external and internal, a SWOT analysis is a useful tool in order to get a united and extensive view of the influencing factors.
2.2.1 Internal Analysis – Resource Mapping
The first and section of the analysis to be processed in the second stage is an examination of the resources within the organization. The figure above shows the overall correlations between internal and external analyses and this is consequently the left part of the figure. The aim will consequently be to map the company’s internal capabilities. We also aim to identify factors that are needed but not present – gaps.
There are various articles and literature written on resource mapping, or resource-based theory, as it is formally called. Interest in the resource-based view of the firm continues to grow in the field of business policy and strategy7 and most of this interest seems to have been focused on understanding the empirical implications of this theory, and especially on how a firm’s resources and capabilities can affect its performance.8 However, resource-based theory is not uncontested, but has caused a wild debate, or stimulating discussion, between three research perspectives: “First, the resource-based theory incorporates traditional strategy insights concerning a firm’s distinctive competencies and heterogeneous capabilities. The resource-based approach also provides value-added theoretical propositions that are testable within the diversification strategy literature. Second, the resource-based view fits comfortably within the organizational economics paradigm. Third the resource-based view is complementary to industrial organization research. The resource-based view provides a framework for increasing dialogue between scholars from these important research areas within the conversation of strategic management. Resource-based studies that give simultaneous attention to each of these research programs are suggested.”9
An additional dimension on these theories is the positioning of the resource-based view, which can be positioned relative to three theoretical traditions: SCP-based (structure-conduct-performance) theories of industry determinants of firm performance, neo-classical microeconomics, and evolutionary economics.10 This dimension points out the relationship between different economical schools. Nonetheless, when utilizing resource mapping as a practical approach to chart a firm’s resources, tools for the identification are sought after and methodological problems are pointed out. The internationalization studies reviewed, directly measure organizational learning as an intangible resource and links between the resource-based view and human resource management suffers from serious methodological shortcomings, producing illegitimate relationships or even reverse causation.11 Furthermore, researchers have struggled to measure resources because many are intangible12 and they should be diagnosed via qualitative methods.13 Suggested are, for example, that because culture involves tacit knowledge, organizational members can not easily communicate culture’s role in developing a sustainable competitive advantage (SCA).14 Models for practical use of resource-based view are suggested, where the focus is, nonetheless, to compare resource-based view to an opportunism-based approach.15 This point of view is a bit too far from our focus though, and the
7 Barney et al (1994) 8 Barney (1996) 9 Mahoney et al (1992) 10 Barney (2001) 11 Peng (2001) 12
Godfrey & Hill (1995)
13 Rouse et al (1999) 14 ibid 15 Conner et al (1996) Theoretical Framework
line of reasoning develops as it is argued that analysing the resource side of the firm is more useful than exploring the product side.16 However, we still need a better framework for the resource mapping and the models presented in the articles The Resource-Based Theory of Competitive Advantage: Implications for Strategy Formulation17 and Strategic Assets and Organizational Rent18 are better suited to fit the purpose.
The suitability of the articles mainly has its origin in the fact that they aspire to identify resources and capabilities. On the other hand, the procedure used is the one illustrated below19, which is not the aim with our resource mapping. It is merely used for first two steps; resources and capabilities, as well as the last step; resource gaps. With these restrictions, the model supports our internal analysis satisfactorily.
It is claimed that resource-based theory for strategic management in general is unclear for various reasons. 20 Contributions lack a single integrating framework as well as little effort has been made to develop the practical implications of the theory. Therefore, the aim will be to “make progress on both these fronts by proposing a framework for a resource-based approach to strategy formulation […]”.21 Nevertheless, we use this framework as it fits well despite some drawbacks.
Two main activities for mapping the resources are scheduled, leading to choice of strategy.22 These steps seek to find relationships between resources and capabilities, as well as giving an understanding of the mechanisms through which competitive advantage can be sustained over time. Furthermore, a resource-based approach to strategy formulation will be made to be able to maximize rents over time. Moreover, the main target with the procedure is to formulate a strategy. In this part, however, we focus neither on strategy formulation, nor on identifying competitive advantages explicitly. Competitive advantage will indirectly be treated when investigating resources and capabilities. The resource mapping will finally lead us to detect resource gaps.
Figure 7. Modified figure of the stages in formulating a strategy, where the most important elements incorporated being Resources, Capabilities and Gaps. (Source: Grant, 1991).
16 Wernerfelt (1984) 17 Grant (1991) 18 Amit et al (1994) 19 Grant (1991) 20 Grant (1991) 21 ibid 22 ibid Theoretical Framework
The framework presented is a four-stage procedure for strategy formulation. The figure illuminates the steps we focus on; mapping resources and capabilities, leading to resource gaps.
Resources and Capabilities
As a definition on a firm’s resources, the following is stated:
“The firm’s resources will be defined as stocks of available factors that are owned or controlled by the firm. Resources are converted into final products or services by using a wide range of other firm assets and bonding mechanisms such as technology, management information systems, trust between management and labour, and more. These resources consist of know-how that can be traded (e. g. Patents and licenses), financial or physical assets (e. g., property, plant and equipment), human capital, etc.”23
Although this definition gives a frame on what resources are, theoretically, a classification is needed to chart the resources. Another suggestion24 is a organization in six major groups: financial resources, physical resources, human resources, technological resources, reputation and organizational resources. This classification is modified to better support this thesis. The main difference is that human resources and reputation are in the organizational resources only due to better correspondence with SKF’s resources. The following groups are chosen: technological, physical, organizational, market and financial resources.
The technological column deals with intellectual property rights (IPR) and intangible assets whilst the physical concerns product and process technology. Organizational resources include customer channels and retaliatory capabilities. With customer channels, current customers are the most important factor. However, it is difficult to define customer channels because one can either mean customers that are likely to buy a new product, the product the investigation analyses or one can mean customer channels into a certain segment. An example for the latter case is that SKF currently sell bearings to automotive OEMs, and to sell another product apart from bearings does not necessarily mean the same company, even though customer relations exist closely related to the segment. In any case, it is obviously more beneficial to have customer channels related to the new specific customer than not to have it. Moreover, market resources embrace knowledge of the market. Because of the fact that most of the components we investigate are new fields for SKF, market knowledge is limited wherefore knowledge of the application also is considered. The last factor is financial resources at SKF. Under that segment, we deal with SKF’s financial strengths and capabilities to take care of a business opportunity for the component discussed.
Additionally, this section, resource mapping, deals with six applications, and therefore, the focus changes depending on what factor that is described. For example, when talking about the financial situation, it does not make sense to describe it for each selected component individually, but for the entire company. On the contrary, when focusing on customer channels, and the remaining factors, each component possess individual circumstances.
Furthermore, a company’s capabilities are the possibilities to utilize its resources and a definition for capabilities is as follows:
“Capabilities in contrast [to resources], refer to a firm’s capacity to deploy resources, usually in combination, using organizational processes, to affect a desired end” 25
23
Amit et al (1994)
24
Hofer & Schendel (1978)
25
Grant (1991)
This definition states that there is a connection between resources and capabilities. Because of the reciprocal interaction, it is suitable to discuss resources and capabilities jointly. Apparently, the resources a company possess are the base of its capabilities and when having identified these, a solid foundation is created in order to chart which desired resources that are lacking. This argumentation thus leads to the resource gaps.
The resources are graded in different matrices in the Result and Analysis section, with either “-“ for negative impact for SKF “+” for positive impact.
Resource Gaps
It is of importance to find out a company’s internal strengths and maybe of even more value to map weaknesses and resource disparities. Theoretically, resource gaps are said to include replacement investment to maintain the firm’s stock of resources and to augment resources in order to support and extend positions of competitive advantage as well as broaden the firm’s strategic opportunity set.26 The resource mapping and gap analysis in this work mainly focus on identifying resource gaps, and not so much on approaches to changing the “firm’s strategic opportunity set” because identifying gaps and list them in this report, will help the project team in their work of strategy formulation.
Finally, another aspect of resource-based theory is the importance of considering core competence versus core products. The tangible link between identified core competencies and end products is called core products – the physical embodiments of one or more core competencies.27 Furthermore, it is stated that the company “Honda [unlike Chrysler] would never yield manufacturing responsibility for its engines – much less design of them of so critical a part of a car’s function to an outside company – which is why Honda has made such an enormous commitment to Formula One auto racing. Honda has been able to pool its engine-related technologies; it has parlayed these into a corporate-wide competency from which it develops world-beating products, despite R&D budgets smaller than those of GM and Toyota.”
What is the point with the above quotation? It is the further analysis of the case that makes it possible to connect Honda with SKF: “Of course, it is perfectly possible for a company to have a competitive product line-up but be a laggard in developing core competencies – at least for a while. If a company would like to enter the copier business today, it would find a dozen Japanese companies more than willing to supply copiers of the basis of an OEM private label. But when fundamental technologies changed or if its supplier decided to enter the market directly and become a competitor, that company’s product line, along with all of its investments in marketing and distribution, could be vulnerable. Outsourcing can provide a shortcut to a more competitive product, but it typically contributes little to building the people-embodied skills that are needed to sustain product leadership.”28 Having defined this, we want to draw a parallel that it is of importance for SKF to consider its own resources even in the choice of product development and strategies for new business opportunities. When entering markets that are somewhat out of the core, it must at least be a very conscious move.
26 Grant (1991) 27 Hamel et al (1990) 28 ibid Theoretical Framework
2.2.2 Industry Competitiveness – Five Forces Analysis
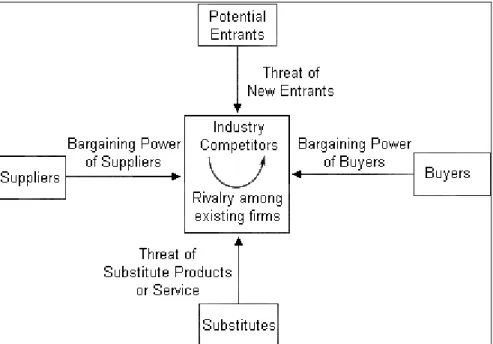
The most influential analytical model for assessing the nature of competition, and to understand the dynamics of the competitive structure, in an industry is the Five Forces Model.29 Apart from understanding what resources that are required and more critical, and thus needed to be excelled in order for the company to operate successfully in a competitive industry environment, it is also important to understand the nature of the competition itself.
An industry is a group of firms that market products which are close substitutes for each other. The theory explains that there are five forces (with the interaction illustrated below) that determine industry attractiveness and long-run industry profitability. The analysis will conduct the external aspects (the section to the right side of the initial figure of this chapter), considering the strategic industry factors.
Figure 8. The Five Forces Analysis is a means of identifying the forces which affect the level of competition in an industry. The forces are: threat of entry of new competitors (new entrants), threat of substitutes, bargaining power of buyers and of suppliers and the degree of rivalry between existing competitors. (Source: Porter, 1980).
The investigation is embodied in assessing the industries of interest rather than on the level of the applications. We use the Five Forces analysis as an instrument to investigate the industries of our selected components in the business evaluation stage.
29
Porter (1985)
Threat (Ease) of Entry
From SKF’s point of view the threat of entry should be seen as an ease to enter the industry. In theory, any firm should be able to enter and exit a market, and if free entry and exit exists, then profits always should be nominal. In reality, however, industries possess characteristics, barriers of entry, which protect the high profit levels of firms in the market and inhibit additional rivals from entering the market. New entrants to an industry can raise the level of competition, thereby reducing its attractiveness. The ease of new entrants will largely depend on the barriers of entry.
Table 1. Ease of entry
When industry profits increase, one can expect additional companies to enter and when profits decrease companies to exit. Moreover, companies are reluctant to enter uncertain markets. Nevertheless can companies, both individually and collective (an illegal action), keep prices artificially low in order to prevent potential entrants from entering the market.
Threat of (Ease to) Substitute
From SKF’s point of view, the threat of substitute should be seen as an ease to substitute products. In Porter’s model, substitute products refer to products in other industries. They have primarily their impact either through the demand of a certain product because of the impact of the price for a substitute product, or through the performance by the substitute application.
The presence of substitute products can lower industry attractiveness and profitability because they limit price levels.
Bargaining Power of Buyers and Suppliers
Table 2. Bargaining power of buyers.Easy to enter if there is: · Common technology · Little brand franchise
· Access to distribution channels · Low scale threshold
Difficult to enter if there is:
· Patented or proprietary know-how · Difficulty in brand switching · Restricted distribution channels · High scale threshold
Buyers are powerful if:
Buyers are concentrated – there are a few buyers with significant market share
Buyers purchase a significant proportion of output - distribution of purchases or if the product is standardized
Buyers possess a credible backward integration threat - can threaten to buy producing firm or rival Buyers are weak if:
Producers threaten forward integration - producer can take over own distribution/retailing
Significant buyer switching costs - products not standardized and buyer cannot easily switch to another product
Buyers are fragmented (many, different) - no buyer has any particular influence on product or price Producers supply critical portions of buyers' input - distribution of purchases
Table 3. Bargaining power of suppliers.
The buyers in the matrix are SKF’s customers and the people / organizations, who create demand in the industry. If the power of the buyer is strong, then the industry comes close to a monopsony – many suppliers and one buyer, in which practically the buyer sets the price. The nature of a majority of the markets for ceramic components (depending on the level of differentiation of the component) will be a market that could almost be defined as a monopsony, or at least, some sort of asymmetry between the producing industries and the buyers.30
Suppliers are powerful if:
Credible forward integration threat by suppliers Suppliers concentrated
Significant cost to switch suppliers Customers Powerful
Suppliers are weak if:
Many competitive suppliers - product is standardized Purchase commodity products
Credible backward integration threat by purchasers Concentrated purchasers
Customers Weak
The cost of items bought from suppliers (e.g. raw materials, components) can have a significant impact on a company's profitability. Suppliers, if powerful, can exert an influence on the producing industry, such as selling raw materials at a high price to capture some of the industry's profits. If suppliers have high bargaining power over a company, then in theory the company's industry is less attractive.
Intensity of Rivalry
The most common indicator on rivalry is the concentration in the industry. A high rate of concentration indicates that a high concentration of market share is held by the largest firms, and with fewer firms holding large market shares, the competitive situation is less competitive (closer to monopoly). With lower concentration in the industry, many rivals exist, none of which have a significant market share, and the situation is very competitive.
2.2.3 SWOT Analysis
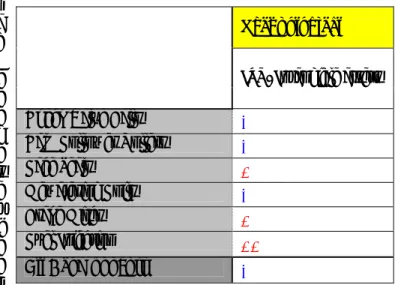
A SWOT analysis (Strengths Weaknesses Opportunities and Threats) summarizes the key issues from the analysis of the business environment and the strategic capabilities of the organization31. The aim is to identify the extent to which the current strategy of SKF’s organization, and its more specific strengths and weaknesses, are relevant to, and capable of, the changes taking place in a business environment.
The analysis is founded on the resource analysis and the environmental analysis, where knowledge about the five forces generates threats and opportunities for SKF, and identifies the basic motives behind competitive ability. It should be seen as a useful way to summarize the relationship between the different analyses.
30 Andersson, interview, 2004-01-28 31 Johnson et al (1999) Theoretical Framework
The working method and how internal factors have an influence on key issues in the environment, is displayed in the figure below:
Table 4. Example of the overview of the SWOT analysis, using a fictions product, where the different factors are listed with decreasing impact.
Product "Adam"
Main strengths Main weaknesses
Process and prod. tech.(Keramera) Lack of product experience
Brand name Lack of tech. knowledge
Distribution channels Small market share
Financial capability Non-structured organization
Opportunities Threats
Barriers of entry Bargaining power of buyer
Technology development Intensity of rivalry
Substitute products
Technology trends
Key environment issues are based on the critical external factors, where it is of importance that SKF excel to outperform its competition. The list should not exceed 7-8 key points32, and as can be seen in the figure below, we have chosen a number of 5-6 external factors. Strengths and weaknesses are critical internal factors, based on the applications of competences and resources.
Figure 9. Example of SWOT analysis, using a fictitious product, where the interaction between external and internal factors of strengths and weaknesses is displayed.
Finally, the internal and external aspects are summarized in an overview where the main opportunities and threats, as well as strengths and weaknesses are presented.
32
Johnson et al (1999)
Summary of Stage 2
In the second stage, the Rough Business Evaluation, some questions are to be considered in order to keep on track. The main question is what product that should be selected and further processed in the third and final step.
Figure 10. These questions are asked in stage 2, of which the theory of this section aspires to process, which will be further conducted in the results part.
2.3 The Third Stage – In-depth Analysis of a Single Business
Opportunity
The second stage manages strategic instruments and leads us to one component that is the best suited to continue with into the third stage for business development, when having considered the specific objectives and strategic views.
Due to limitations mentioned earlier, in the Delimitations part, the in-depth analysis of a single business opportunity will not be a complete business plan; it should rather be seen as an analysis treating the business development of a selected component.
2.3.1 Building a Business
In order for a venture to be properly set off, an entrepreneur attitude in the start-up phases is valuable. However, as the business enterprise develops, not only the entrepreneurial capabilities, but also skilful business development abilities are of importance. Thus to be a good entrepreneur does not only stand for a talent to come up with proficient ideas. In order for the entrepreneurial team to build a durable business it has to be able to answer the following three questions:33
1. Are my goals well defined?
Before starting a business, an entrepreneur has to be sure of his/her “private” goals – Where do I want to go? The goals have to be explicit, for example: gaining independency by starting up an own project is not goal enough. It should answer questions such as detailed questions regarding the structure of the venture and what risks the entrepreneur is willing to take
33
Bhidé (1999)
2. Do I have the right strategy?
A lot of entrepreneurs start up new ventures seizing the short-term opportunities without thinking about the long-term strategy.34 A successful entrepreneur soon changes from a tactical to a strategic point of view, in order for crucial capabilities and resources to be created. The strategy needs to be well defined, meeting the goals regarding growth and profits as well as answering the question: How will I get there?
3. Can I execute the strategy?
Good ideas do not guarantee great performance; many entrepreneurs fail because of inability to execute the strategy.35 The entrepreneur has to ask himself/herself if the adequate resources and relationship exist, if the organization is strong enough and if the entrepreneur can play his/her role well.
It is claimed that good ideas will not be enough for success and that one of the most critical factors to create a sustainable business plan that covers a broad spectrum of factors.36 Among the most important factors are to sell the idea in order to tempt investors to offer venture capital, and it also shows that the main focus is to help entrepreneurs making their idea lift from being just an idea to be a long-lasting business. Therefore, the core predicament is how to sell the idea and get capital for a start-up. In this work, however, we do not face these issues to a significant extent even if they are important factors. SKF already have capital to invest in new business opportunities, but nonetheless, it is crucial at this point that the ideas generated in this thesis are “sold” to decision makers for their support in resources in form of capital and knowledge.
Additional important focus areas are market estimation, pricing strategies and mapping of competitors. As mentioned in the delimitations section, we do not focus exhaustively on these factors, as it will not be an entire business plan. Our outline follows the suggested37, with some exceptions. We do not mention the aspects on choosing managerial body, specific product offer, profitability assessment and cash flow calculation. Our main focus is instead to gain deeper knowledge of one business opportunity and no single outline is appropriate for every new venture and business development situation. The following outline covers most of the important areas that are included:
• Background and purpose
• Customer need and problem
• Solution
• Market
• Competitive Situation
• Risks
The first three sections are informative and reveal information about the application, what the problem is and the ways to solve the problems. The market and competitive situation sections cover general market trends for the oil industry, and market estimation for the specific component as well as a concise summary of the competitors. Finally, the risks involved with this product development are included.
34 Bhidé (1999) 35 ibid 36
McKinsey & Company (2001)
37
McKinsey & Company (2001), Smith et al (2000)
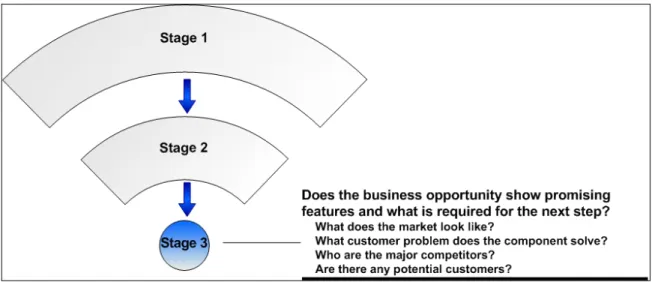
The figure below contains a summary over queries that are regarded as means and instruments of how the objective is achieved. The main question is how, or perhaps what information is lacking in order to verbalize how, SKF should proceed with the selected component.
Figure 11. The figure shows the questions pointed out in the third stage.
2.4 Summary of the Theoretical Framework
In order to fulfil the purpose of the thesis, several problem areas must be analysed. In this section, we integrate the purpose, the theoretical framework and the analysis by constructing a practical framework, illustrated in the figure below.
As the disposition of the report consists of three stages, each stage has various sub-targets that need to be examined. Every step has a number of questions to be focused and answered, directly or indirectly. The figure shows the three steps and their core deliverables to the left, which have their origin in the questions to the right in the figure, and the deliverables can be regarded as tools to handle the questions.
Figure 12. The figure shows the stages in the working process. The subject matters mentioned in the theoretical framework are listed to the right in the figure. To the left, from each stage respectively, the different deliveries in every stage of the working process are listed.
3 Methodology
This chapter describes the methods used throughout the work. It begins with a description of the procedure and the practical approach, and continues with the methods used while collecting information. Finally, an evaluation of the validity and reliability of the report is regarded.
3.1 Data Collection
Most of the data collection needed to perform the stages mentioned in the Theoretical Framework section, together with the processing of the data has been done through personal interviews and literature or electronic sources. Also of significance have been visits at fairs.38
The main idea and focus have been to cover sufficient components of the engineering ceramic market to be able to select interesting components without missing important parts of the market. Sources to the components are companies working with ceramic material in their products. This is obtained through a consistent and thorough working process during the data collection phase. To certify that the emphasis is set correctly, the method is built up continuously through verification of the data acquired.
In addition to this, knowledge is also gathered from business reports, market analyses and interviews with scientists and development departments at ceramic companies. A majority of the material upon which the in-depth analysis is generated springs out of interviews with existent customers and experts within the selected field.
An explanation of how the obtained data is presented follows in the next section, the Results and Analysis, and with a more extensive explanation of the database in Appendix A – Spreadsheet on Engineering Ceramics.
3.1.1 Interviews
The focus with the interviews has been to obtain a base of information, with both a varied and broad range of aspects and competences, why also different types of interviewing techniques have been used. Interviews have been used in order to acquire different types of information. First of all, the basic knowledge about ceramics and fundamental components and later more specified information regarding certain components. Depending on the motive for the interview, the structure39 and realisation of the interview was decided.
Either the interview was open; an open formulation to which the interviewee could freely develop ideas and this could benefit the ability to assemble a picture of reality, since the interviewee can express its subject view. Another possibility is a more structured interview, where a relationship between predestined questions is sought. The more structured interviews were used in order to benefit the situation where a certain knowledge and question more strictly is wanted.
38
Scanpack, fair, 2003-10-24 and Subcontractor, fair, 2003-11-11
39
Lantz (1993)
Often were a mixture of the interviews mentioned above used, and to some extent directed concerning a, by the interviewer, specified area where a certain coherence between different subjects and related knowledge is required.
3.1.2 Validity and Reliability
A definition on validity is that validity is the measurement to which a question in reality reflects and evaluates the feature desired to investigate.40 Either how the results can be used in other external assignments or to what extent the results correspond with the reality.
With reliability are the trustworthiness and the regularity considered during the process and can be seen as a measurement of how the used instruments and methods deliver the same result under different circumstances and moments in time.41
A limitation with the tools used is that an instrument of analysis can be very subjective – two people rarely come up with the same final version of SWOT for example. Therefore, it should be regarded as a guide and not a prescription, which have been taken into account while analyzing the results. The same amount of carefulness should be taken when using the Five Forces Analysis, Ansoff’s Matrix as well as the Resource Mapping.
We have consistently made our analysis separately, in order to put together a combined result after discussions. In addition to this, we have on a regular basis gone through the results with tutors, from SKF as well as from the university, since a higher level of reliability is obtained if a large number of persons attain the results.
40 Bell (1987) 41 ibid Methodology
4 Results
and
Analysis
In this chapter, we present results and analyses from the data collected. Major part of the data is found in the database, as it is the base for information. Nonetheless, the database does not contain all information for the further investigation as a significant amount of components are handled. After the first stage’s information collection for the database, additional interviews and research are done. This is also the case before arriving at the last stage, the In-depth Analysis of a Single Business Opportunity, where even more information is gathered. Moreover, the last stage is covered in a section after this chapter, and thus not in this chapter, the Results and Analysis.
For the first and second stages, market scanning and business evaluation, the major part of the data is derived from interviews with specialists within ceramics and their applications, apart from the above mentioned fairs, competing companies product catalogues etc. Moreover, interviews are also carried out with the following persons for the first and second stages: Kent Rundgren (Keramera Scandinavia and The Institute of Ceramics), Roger Karlsson (The Institute of Ceramics), Rolf Mendel & Björn Åhlander (Huhnseal), Claes Kuylenstierna (Volvo), Anders Hedlund (CeramTec) and Cornelia Barkebo (Glynwed). Apart from these, internal sources at SKF has been contacted, at a continuous basis or a one-time interview; Kjell-Arne Arvidsson (SKF Paper Machines), Ellinor Ehrnberg (SKF Business Development), Egon Ekdahl (SKF Railway), Håkan Zetterling (John Crane) and Lars Kahlman (Industrial Division Prominent Needs Development, SKF Gothenburg).
4.1 The Database
The idea with the database is to get an organized picture of which applications made of advanced engineering ceramics that are used today and the planned component usage for the near future - with interest for SKF. The database contains more than 140 lines with components. Every single line does not necessarily represent a unique component. In order to get an as complete picture as possible we are obligated to include for
example hybrid bearings used in several applications. This means that such a component will be listed in more than one place with different application areas, which naturally is the case for a number of components and thus could the component name be not one specific component, but a group of components with similarities. There is a range of variants (sizes, materials, appearances etc.) of for example hybrid bearings42, and they are grouped according to similarities in technology and application area.
The components found in the database are selected from various ceramic manufacturers’ assortment; product catalogues, home pages and queries. Furthermore, interviews with experts of the engineering ceramic business are accomplished.
In order to do a selection, the components are ranked using assessed data; each line in the database has an estimate-number in the corresponding columns. This is schematically showed in the figure below.
42
In the ranking of components, and the further work, hybrid bearings are not considered as a subject of interest in this thesis for the simple reason that SKF already possess knowledge in this area and it would require a considerable amount of investigation in order to surpass current understandings.
Figure 13. The figure displays an example of the function of the database divided into three parts because of the width of the spreadsheet. The elements are agreed upon different numbers in the different columns, where each figure is representing a certain estimated aspect.
The first columns are order under a generic term called “Market”. This signifies the categorization of the component; in which segment it is classed, according to SKF internal classification system. One column also shows in which application the component is used. The columns following after “Market” are called “Data” and contain values for the evaluation. Included columns are: Critical Customer Requirement, Type of Market, Ease of entry, Market Value, SKF Involvement, Competitors, Competitive Advantage, Competitive Environment, Possibility of Implementation and Strategic Fit. The factors are chosen because of the need to indicate grade of attractiveness the component has for SKF to look for further business opportunities. Thus, “Attractiveness for SKF” is defined through collaboration with the project team. The main factors are:
• What type of market it is
• How intense competition it is, easiness of entering this market
• Potential value for SKF in this market
• How involved SKF is in this market today, either with customers or internal knowledge, or both
• Main competitors
An instructive description of the database is found in Appendix A – Spreadsheet on Engineering Ceramics, where detailed texts of what the different columns mean.
The main query for this section is which components that are of most interest for SKF, which is required to be shown in a logical way through grouping and presentation.
4.2 Processing and Evaluation of Components
The components in the database have an individual evaluation mark derived and they are sorted in a descending scale, according to the estimate of each component respectively. Naturally, other factors, such as possibilities for SKF to broaden the business within other markets for the same component are important aspects for the selection. Check valve balls, for example, can be used for oil production pumps, but also for pumps within the chemical industry. This idea with the different groups facilitate, as mentioned, the possibilities to exploit knowledge gained in one business area and then transfer these advantages into new sectors. This is the cascading factor.
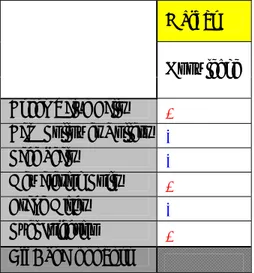
Table 5. In the figure are the 30 highest ranked components listed from the data base. To the very right, the evaluation figure is found. Also displayed are the belonging applications as well as market segments and functions to each component. A star (*) to the right means that the component is selected for the further analysis.
# Segment Application Component Evaluation
1 MIN.&.CONSTR. Down Hole Seals 15,9 *
2 RAILWAY Carriage Wheels break discs 14,6 *
3 RACING F-1 brake discs 14,3 *
4 RACING F-1 valves 13,6 *
5 AEROSPACE Aircraft aircraft engine seals 12,3
6 AEROSPACE Aircraft struts and support rods 12,3 *
7 FLUID-MACH. Hydraulic Systems check valve balls 11,6 *
8 FLUID-MACH. Oil Extraction check valve balls 11,6 *
9 MIN.&.CONSTR. Oil Extraction measurement instruments 11,6 *
10 PULP-AND-PAPER Paper Processing Machines PZT, sensors 11,4
11 FLUID-MACH. Compressor pump parts 11,3 *
12 AUTOMOTIVE Engines push rods 10,9
13 MAT.HANDLING Can Making seaming roll hybrid bearings 10,8
14 POWER GEN. Nuclear Power face seals 10,8
15 FLUID-MACH. Pumps position components, PZT 10,8
16 RACING F-1 brake calliper 10,3 *
17 PULP-AND-PAPER Paper Machine Foils slotted dewater. centrifuges etc. 10,3 *
18 AUTOMOTIVE Diesel Engines turbo chargers 10,1
19 FLUID-MACH. Compressor face seals 9,8 *
20 FLUID-MACH. Injection Pumps face seals 9,8 *
21 AUTOMOTIVE Engines rocker arm pads 9,4
22 FLUID-MACH. Pumps for Paper & Food Industry face seals 9,3 *
23 FLUID-MACH. Fluid System valves 9,1 *
24 FLUID-MACH. Diesel Engines fuel injection, ceramic ball 8,8 *
25 AUTOMOTIVE Diesel Engines valves 8,8 *
26 AUTOMOTIVE Engines valve top 8,8 *
27 FOOD & BEVERAGE Food Industry spots, nozzles 8,8
28 POWER GEN. Fuel Cells PZT 8,8
29 METALWORKING Metal Heating Ovens masonry and fibre ovens 8,8
30 FLUID-MACH. Mixers, Stirrers seal rings 8,8 *
41 FLUID-MACH. Seawater Lift-Pumps seals 8,3 *
48 AUTOMOTIVE Diesel Engines cam follower rollers 7,8 *
49 FLUID-MACH. Diesel Engines fuel injection needle seal 7,8 *
56 AUTOMOTIVE Diesel Engines exhaust gas control valve 7,3 *
66 AUTOMOTIVE Engines fuel injection, PZT 6,8 *
The list shows the 30 highest positioned components, and five additional components. These five are specially selected, originating from positions below the top-30. Out of all these, 24 components are selected after consideration of the most important aspects and fit for the organization, the