V¨
aster˚
as, Sweden
Thesis for the Degree of Master of Science in Computer Science with
Specialization in Embedded Systems 15.0 credits
OPTIMIZING ENERGY
CONSUMPTION OF CLOUD
COMPUTING SYSTEMS
Ali Alshiekh
aah16002@student.mdh.se
Examiner: Thomas Nolte
M¨
alardalen University, V¨
aster˚
as, Sweden
Supervisor: Hamid Reza Faragardi
M¨
alardalen University, V¨
aster˚
as, Sweden
Co-Supervisor: Mohammad Ashjaei
M¨
alardalen University, V¨
aster˚
as, Sweden
Abstract
A large number of network devices in cloud data-centers consume huge amount of energy. This has emerged as a matter of concern for data center operators. Cloud computing finds its applica-tion in various fields such as telecommunicaapplica-tion, multimedia, video gaming and etc. Most of these applications require a timing guarantee which are reffed to as real-time applications. Once cloud providers aim to guarantee Quality of Service (QoS) parameters such as deadlines, more hard-ware resources are required because of using a higher number of servers, switches, higher network bandwidth, more cooling and power distribution systems. As a consequence of the use of a higher number of devices and communication links, power consumption and operational cost. This thesis aims to optimize the network energy consumption, which in turn results in reduction of the energy consumption of a data-center while respecting the network constraints. The energy reduction of the network is achieved by turning off idle network devices and playing with the allocation of the workload among the servers to minimize the communication load. Thereby, it increases the number of idle devices. Our experimental results demonstrate a full performance by using Open Shortest Path First (OSPF) routing protocol. OSPF creates a routing table to find the finest tasks paths and the address of the idle devices. It provides 22.75% reduction in energy consumption by applying Elastic Tree mechanism.
The performance of the method is also examined in terms of the network load. The results reveal a trade-off between network energy consumption and the load of the network. The results show that although the Elastic Tree mechanism optimizes energy consumption of the network, it increases the network load.
Contents
1 Introduction 3
2 Background 4
2.1 Data Center Network Topologies . . . 4
2.1.1 Switch Centric Architectures . . . 4
2.1.2 Server-Centric Architectures . . . 5
2.2 Data Center Network Topologies-Routing Mechanisms . . . 7
3 Related Work 8 4 Problem Formulation 8 5 Method 9 6 Description of Work 10 6.1 Implementation . . . 11
6.1.1 Network Topology Implementation with an Example . . . 11
6.1.2 OSPF Routing Protocol Implementation . . . 14
6.2 Optimizing Network Energy . . . 16
6.2.1 Optimizing Network Energy with OSPF . . . 16
6.2.2 Optimizing Network Energy with Elastic Tree . . . 16
6.2.3 Algorithm of The System Generation . . . 17
7 Results and Evaluation 18 7.1 Experiments Setting . . . 18
7.2 Experiments Results . . . 19
7.3 Results Analysis and Evaluation . . . 20
7.3.1 Analysis and Evaluation of Energy Optimizing . . . 20
7.3.2 Analysis and Evaluation of Increase Network Load . . . 21
8 Discussion 21
9 Conclusions 21
10 Future Work 22
1
Introduction
Data centers are becoming increasingly popular for their flexibility and processing capabilities in the modern computing environment. Data-centers have grown steadily with a widespread use of cloud-based services and unprecedented quantity of data delivered in/between data-centers. A data center is a collection of computing resources grouped together using communication net-works to host applications and store data. A typical data-center is modeled as a multi-layer hierarchical network with thousands of low-cost commodity servers and switches as network nodes. Data-centers are experiencing an exponential growth in the number of servers. Google, Microsoft, Facebook, Yahoo and etc. have already hosted hundreds of thousands of computing nodes with significant network bandwidth requirements [1,2].
Emerging new computing and communication technologies sch as virtualization and utility com-puting have led to a new generation of comcom-puting system called cloud comcom-puting system. Cloud computing system gives flexibility and access to shared and scalable computing resources from any point in the world. It takes into account the scalability, reliability, efficiency and the Quality of Services (QoS) including timing requirements of soft real-time applications such as multimedia and telecommunication applications. However, in order to fulfill all the QoS requirements, the cloud provider should accept a higher operational cost such as employing more powerful servers, a larger number of servers, switches and a higher network bandwidth. It comes at increasing energy consumption.
Energy consumption has already become a major challenge to the recent studies. Most researchers strive to optimize energy consumption under certain performance constraints. Due to the trade-off between network performance and energy saving, the architectural choices in the design of a network plays an important role on the overall efficiency of the network. Additionally, it impacts directly on its scalability, fault-tolerance, cost and power consumption. The majority of the net-work architectures are designed by using a tree-like topology. The Fat-tree netnet-work topology is adopted as the considered network topology in this thesis [2,3,4,5].
The tree leaves including end-nodes (servers) are connected to the Top-of-Rack (TOR) switches. The TOR switches are connected to the Aggregation switches, which are connected to the Core routers at the root of the tree as shown in Figure1. A Fat-tree data-center topology is built by a large number of richly connected switches. It possesses a full bisection bandwidth to support all communication patterns. Furthermore, the Fat-tree network topology uses multi-path routing protocols, which is a helping hand to spread the traffic from lower layers through the core. Further-more, it balances the load. First of all, these properties provide the ability to invest an effective routing protocol. Secondly, they find the fastest paths for the tasks.
The Open Shortest Path First (OSPF) is a link state routing protocol [6]. OSPF computes the cost of a route by taking into account the bandwidth, load, delay and tasks constraints to find out the finest paths for the tasks through the network. Another advantage of the link-state routing protocol is to illustrates the network by drawing a routing table and addressing the congestion of the network. Moreover, it supports network clustering. This provides the ability to subdivide the network into a number of clusters to simplify the administration and to optimize traffic and resource utilization.
To optimize network energy consumption, we use the OSPF link state routing protocol and clustering of the network to facilitate detecting of the idle devices according to the illustrated routing table and turning the idle network devices off.
To further improve the energy consumption of given network, we go through the routing table and reallocate the links load in the network. We also turn off some aggregation and core switches. Afterwards, we apply the Elastic Tree topology [7] to obtain a maximum energy saving subject to tasks constraints.
In this thesis, we first review briefly a general introduction of the widely common used data center network topologies in Section2.1, while considering different routing mechanism in Section
2.2. We present different techniques to optimize the energy consumption of cloud computing systems in Section3. The implementation report and energy optimization are described in Section
6. Section 7shows several experimental results with analysis. We further discuss the results and evaluation in Section8. In Section9we conclude the work and results. Finally, we end with future work in Section10.
2
Background
We begin with an overview of some data-center network topologies, and several routing mecha-nisms for different network topologies. Then, we explore some techniques which optimize energy consumption of a network.
2.1
Data Center Network Topologies
Data Center Network is typically based on Tree-tire, tree-based, hierarchical architecture multi-level of a tree as shown in Figure1. According to [4], the various architectures can be categorized in three forms: (i) Switch-centric, (ii) Server-centric and (iii) Dual centric.
Figure 1: Legacy DCN Architecture[2]
2.1.1 Switch Centric Architectures
A switch-centric consists of multi-level switches connected to the end nodes. Switch-centric based networks can support communication between tens of thousands of servers, for instance three-tire switch-based as shown in Figure 1. In this network topology the TOR switches are connected to links with 1Gbps. These links are responsible for transmission packets within the racks and modules. The aggregation layer is connected to links with 10Gbps. These links are responsible of connecting the highest level of the tree ”Aggregation and Core switches layer” [2,3, 5].
Fat Tree
A Fat-Tree network topology is based on a complete binary tree [2,3]. Figure2shows the Fat-tree topology, which is not similar to the basic tree network topology. The switches which are being conducted in the network layers employ the same type of common switches. There is no need for high performance switches in the aggregation and core level.
The advantage of the Fat-tree in our work is that the number of links with the down and up direction are equal. Links with downward trend connect with nodes and the upward links encounter the parents in the upper layer. This indicates that the architecture interconnects racks and modules in the three layers. The tree goes wider to the upper switches and core, meanwhile it employs a multi-path routing protocol. The traffic from the lower layers is going to spread across the core and valiant load balancing (VLB).
Figure 2: Fat Tree Topology [2]
VL2 (Virtual Layer 2)
The Virtual Layer-2 (VL2) [4] is similar to the Three-tier architecture data-center network. Never-theless, it employs various mechanisms for load balancing so-called Valiant Load Balancing (VLB). Furthermore, it applies Equal Cost Multi-Path routing protocol (ECMP) to distribute the load evenly over the paths with low-cost implantation e.g. Figure3.
Figure 3: Computer Network Architecture[4]
One-Tier Fabric Architecture
The Qfabric [4] transforms a Three-tier network architecture into a One-tier fabric. The purpose is to add value and quality for computer networks with a single logical switch. Qfabric supports high-speed communication from server to server and from server to switches with low latency and effort. It reduces the complexity, operational and cooling cost. Thus, it leads to great energy saving. Figure4shows how to transfer the three-tier structure into flat structure network architecture. 2.1.2 Server-Centric Architectures
The Server-Centric Architecture allows the network servers to connect directly to other servers and forward the traffic among each other. This adds a property to the centric architecture which
Figure 4: Qfabric architecture[4]
is high capacity. The high capacity network architecture supports all traffic types with very low delays.
DCell Dcell [3, 2, 4] ] is a hybrid server-centric network. In this architecture, one server is connected directly to numerous servers in DCell with multi-network interface port. DCell is structured as recursive and hierarchy cells as shown in Figure 5. DCell can expand without the
Figure 5: DCell architecture[4,2,3]
need to change in addressing and rewiring. The design employed is the fault tolerant algorithm. It provides the capability to host millions of servers with various types of failures such as links and servers, because the DCell has a rich connectivity between servers and switches. Overall, DCell is a highly scalable and fault tolerant topology. However, it provides low bisection bandwidth.
BCube
BCube [3, 2, 4, 8] is a server-centric network architecture. It aims to provide a Modular Data Center (MDC). Two types of devices are employed in BCube. Servers with multiple port interface and switches with n-ports connected to n servers. 8 port mini switch can support up to 4096 servers in one BCube cell. Figure6 shows the BCube topology architecture.
Figure 6: BCube architecture[4]
2.2
Data Center Network Topologies-Routing Mechanisms
The term topology means the physical architecture of the network. The routing algorithms are implemented with consideration of the physical architecture of the network to calculate and route paths. Generally, multiple paths exist between servers. Therefore, multi-path routing protocol is applied to help in load balancing and fault tolerance such as Equal Cost Management Protocol (ECMP) and Valiant Load Balancing (VLB) techniques [9].
The rapidly growth and demand of the data-center networks led to emerge new routing mech-anisms to avoid congestion and improve the performance of the network. The routing mechmech-anisms take into account minimum latency, maximum reliability, maximum throughput, energy and etc such as vFtree ” A Fat-tree Routing Algorithm using Virtual Lanes to Alleviate Congestion” [10]. The Fat-Tree routing algorithm [10,9] only requires a single VL. The rest of the virtual lanes are useful for other purposes i.e. for the quality of service (QoS) or reducing the negative impact of the congestion induced by the head-of-line blocking.
On the other hand, there is a powerful routing mechanism wFatTree ” A weighted fat-tree rout-ing algorithm for efficient load-balancrout-ing in InfiniBand enterprise clusters” [11]. This invests the advantages and features of the original Fat-Tree routing algorithm to consider node traffic char-acteristics and balance the load among the network links more evenly with predictable network performance.
Open Shortest Path First (OSPF) is one of the most widely employed routing protocols. It applies a link-state algorithm to calculate the routing databases. Each server communicates with all the other servers. The link-state algorithm informs them about the costs of their link. Furthermore, each server and switch disseminate their link status packets to all other servers and switches in the network. Thus, the whole servers have a similar view of the network. This protocol converges faster than other protocols [12]. Therefore, we adopted OSPF link-state routing protocol in this work.
3
Related Work
Data centers are the backbone of today’s Internet and cloud computing systems. Due to the in-creasing demand of electrical energy by data centers, it is necessary to count the huge amount of energy that they consume. Energy modeling and prediction of data centers play a pivotal role in this context. According to statistics in [13], 40% of the energy consumed by computing servers and network equipment overall data-center energy consumption. 60% consumed in cooling and the power distribution systems. There are a lot of research works concentrate on the energy con-sumption of servers [7,13,14,15], and the energy consumption in cooling equipments [14]. In this work we focus on the energy consumption of the network, by adopting a network topology and propose an effective routing mechanism to describe the network and addressing the idle devices in the network. Then, pursue an efficient policy to turn off the idle devices and gain more optimized network energy consumption.
Elastic Tree topology [7]. Heller et al. presented a dynamic system to adapt the energy con-sumption of a data center network. It consists of three logical modules Optimizer, Routing and Power Control. The Optimizer module finds the minimum power network subset that satisfies current or statistical traffic conditions. Its input consists of a topology, a traffic matrix and the power model of each switch. The Optimizer outputs a set of active components to both of Power Control and Routing modules. The Power Control turns ON or OFF ports, line cards or entire switches according to this output. The Routing module chooses routes for all flows. Then, it pushes routes to the switches in the network. Elastic Tree’s results show the ability to save up to 50% of network energy with satisfying their needs in fault tolerance and network performance. In similar work, Faragardi et al. [13] reduced the energy consumption of data-center by optimizing the energy consumption of the network part. They considered Three-tier topology. However, a simple and naive method was used to detect idle switches. They assumed that the load of the network is known at the beginning of each scheduling period (no need to a prediction of the load). EAICA’s results show reducing in energy by 21% in compare with Genetic Algorithm GA [16]. The energy consumption reduced by 51% in contrast with non-power-aware policy. In this case the switches and hosts were consuming their maximum power with less than 1% miss deadline of soft real-time services. The method provided a high performance in terms of predictability.
Also in [17]. Faragardi et al. proposed Imperialist Competitive Algorithm ICA to raise up the reliability. ICA performance results reduced the energy consumption by 17%. In a non-reliable system by 9% and 83% in non-power-aware policy where switches and hosts were consuming their maximum power.
Fang et al. [18] reduced plenty of energy consumed by network redundant devices. They considered Fat-Tree network topology and proposed a solution based on an agreed approach to network load balancing and minimize switch links rate. The results show reduction in the energy consumption by 63% with the number of flows = 10. 33% with the number of flows = 200 and 300.
4
Problem Formulation
The fast increase of the diversity of data-center network topologies and routing mechanism provide more reliable and flexible solutions in improving the efficiency. They offer utilities to reduce the energy consumption of data center networks by taking into account the tasks constraints and traffic conditions.
InfiniBand (IB) [11] becomes a common network interconnected for high-performance comput-ing (HPC) systems. A vast amount of IB-based HPC systems employ some variant of the Fat-Tree topology to take the advantages and features of the useful properties which is offered by Fat-Trees. In this thesis, we would implement a method to find the finest paths of the user tasks according to the network information. Network information includes Links Load and Tasks Load with con-sideration of tasks constraint, links congestion and network performance.
In order to reduce the energy consumption of the network, the method goes through the network equipments in different layers and clusters. It finds out the idle devices and turns them off by routing table of the OSPF link state routing protocol.
For more energy saving, the method checks whether it is possible to reallocate the load of switches and cores by changing some task’s paths to pass through an appropriate alternative paths. In addition, it increases the number of idle devices to gain more optimized energy consumption over the network.
In order to calculate the average optimizing energy consumption, we analyze the results of exper-iments that we have conducted with a large number of various system cases. Thus, it shows the trade-off between the optimizing of the energy consumption and the network load.
5
Method
Most researchers have been stimulated by problems resulting from the development and usage of the data-center networks and cloud computing systems. The research methodology has been pur-sued in this thesis to observe existed solutions and propose a better solution. After implementing and improving the solution, measuring and analyzing, we repeat the processes until finding the final improve with no more possible improvements.
To simplify, we implemented our method as a user interaction tool to give the network admin-istrator (user) ability to enter their network information with/without relying on other simulation platforms. Figure7 represents the procedure of the research methodology.
Figure 7: Flow Diagram of Research Method
1. Problem Formulation
obvious.
2. Related Work Reading
To guarantee the smooth processing of the work in the next steps, related work and basic knowledge are requested to build the work foundation and improvements as well as obtain Results of an approach.
3. Implementation
To do the programming of the work for the system generation with a large number of system cases.
4. Results and Evaluation
To do the experiments and collect the results to evaluate and compare it with the expected results in the related work. If the results match the expected results we will write the conclusion. Otherwise, we need to make a revision for the related work. Find out the misunderstanding or do more research to improve our implementation by proposing a better solution. Then, build the new solution and improve it according to the results. Repeating the processes until getting a satisfying result.
5. Discussion
To present the interpretation of the results. To show their significance and discuss the possible consequences.
6. Conclusion
To make a conclusion based on the experiments results and evaluation step.
6
Description of Work
The energy consumption of the data-center network optimizes in several steps.
Firstly, we adopt Fat-tree ”Three-tier” network topology as a data-center network for this work. The logical topology of the adopted data-center network is shown in Figure8.
Figure 8: Three-tier Network Topology[13]
Secondly, by applying OSPF routing protocol on the implemented Three-tier network topology, we gain the potential advantage of the new efficient introduced network topology. Furthermore, it is more applicable for more improvement such as Elastic Tree mechanism to gain more energy optimizing.
Thirdly, the load of switches can be detected in a better way in comparison with the mecha-nism applied in [13]. After this being accomplished, the method will decide which switches can be turned off with regards to the load of the network. We need to be aware of the fact that turning off a switch should not result in congestion in the network due to putting too much load on other switches. The congestion should be avoided since it increases deadline miss rate.
6.1
Implementation
The implementation has been done on Visual Studio 2015 environment in C++ programing lan-guage with console application to interact with users and match users requirements. Cisco Packet Tracer Student version 6.1.0.0120 is applied to represent the network topology as a graphical in-terface such as Figure9. The work scenario has been divided to three parts. First, it begins with implementing the network topology according to the adopted Three-tier network topology. Then, assign the network information on the network such as links load and nodes load from user in6.1.1. We implement OSPF routing protocol, using the lowest task’s path link load for more balancing in the network in6.1.2. After getting the OSPF with the finest task’s paths, the method decides which devices will be turned off and return the new ON-OFF array to the user with respect to task constraints and network congestion in6.2. The Elastic Tree mechanism will be implemented according to the OSPF as improvement to the OSPF optimizing energy.
6.1.1 Network Topology Implementation with an Example
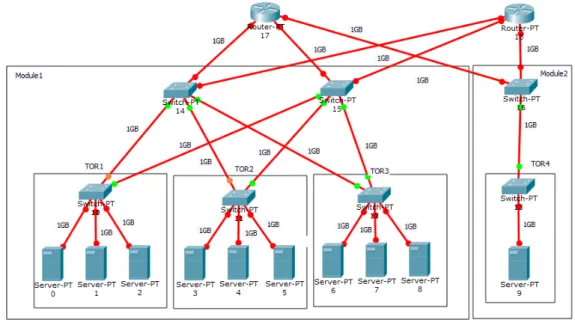
For clarification, the network topology implemented as a matrix of two-dimensional array to rep-resent the network and the connection between devices. We assumed that the network links bandwidth is equal to 1 GB and tasks load with tasks allocation are known. The numbering of the devices (Servers, Switches, and Cores) starts from 0 as a first Server and so on as shown in the example Figure9. The network is clustered according to InfiniBand IB [11]. Three TORs, two aggregation switches and one core for a module, and four cores for one cluster in the network as shown in Figure8. The example below explains obviously our approach.
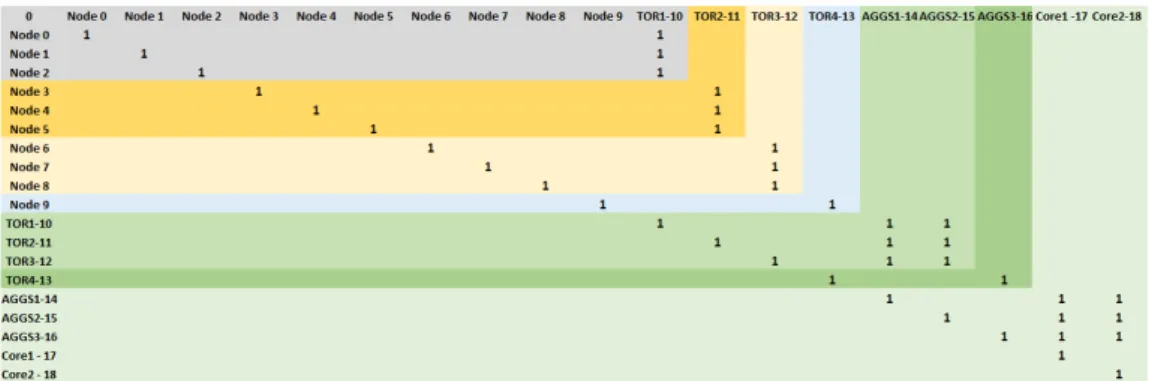
Figure 9: Example Of Three-tier Network Topology with 10 Nodes, 3 Nodes per Rack In order to maintain flexibility and holistic solution, the user can decide the number of servers in the network, and the number of servers per rack. These values will calculate the number of Switches and Cores that need to implement the network. By using a matrix, it determines values for indexing the elements in the network matrix as shown in Figure10. The figure shows 10 nodes and 3 nodes per rack, each rack connected directly to the top of the rack which called (TOR). Nodes 0, 1 and 2 are connected to TOR1-10. Nodes 3, 4 and 5 are connected to TOR2-11. Nodes 6, 7 and 8 are connected to TOR3-12 and Node 9 is connected to TOR4-13. TOR1-10, TOR2-11, and TOR3-12 are connected to Aggregation Switches AGGS1-14 and AGGS2-15. TOR4-13 is
connected to AGGS3-16. Aggregation Switches AGGS1-14, AGGS2-15 and AGGS3-16 are con-nected to Core1-17 and Core2-18. The connection of the link represented by ”1” and no connection represented by null or ”0”. Regarding the diameter, it represents the ON-OFF array of devices whereas it is the final results of our work. It can being provided by the user if the user wants to apply it to discover the task’s paths after turning off some devices. We assign the ON-OFF array to the diameter of the network matrix to turn off the device with diameter value ”0”. To turn off a device in the network we need to delete the row and column of the device. Thus, the connected links to the device also being disabled. Figure11shows an example of ON-OFF array assigned to the network matrix.
Figure 10: Example of Three-tier Network and links Between Devices Represented by ”1”
Figure 11: Example of ON-OFF Array Applied on The Network
After turning off the devices according to ON-OFF array we get a matrix of the on-line switches and cores, Figure12shows the on-line switches in the network.
The assumption of a network without a load of tasks or messages is an unlikely idea so we proposed a network preloaded by the user. According to the assumption we will have the task’s load which is the load that has been sent and received by the servers. With assigning these values to the node load matrix, we have the whole network information. Figure13shows an example of a task from node 3 to node 5 with load 5 KB and task from node 3 to node 4 with a load of 3 KB and so on. Figure14shows the network on-line links load.
Figure 13: Example of Node Load Matrix
6.1.2 OSPF Routing Protocol Implementation
Open Shortest Path First (OSPF) is a link state routing protocol which delivers the finest available path in the network. It finds out the shortest accessible path from the source to destination server. Every router and switch have a database. The database is calculated to find the neighbor’s servers and switches. Then, it draws a Routing Table with links cost and sends the originated Link-State Advertisement (LSA) Packet to the neighbors to describe the network area [6]. By having the network information, the routing protocol finds available paths for each node to the cores through multi accessible switches to draw the Routing Table. Drowning Routing Table is reached by the following steps.
First, we get the successors from On-line Switches matrix and put these successors into on-line successors matrix. By finding the successors in the previous example Figures12and14we will have the on-line successors matrix as shown in Figure15. Nodes 3, 4 and 5 are connected to switch number 11. Switch 11 is connected to switches 14 and 15, and etc.
Figure 15: Example of On-line Successors Matrix
Secondly, we find out the paths between the successors due to the on-line successors matrix. Then, we go through on-line successors matrix and draw the multi-path table. Each node has four paths to the cores in this example, Figure16shows multi on-line paths matrix as output.
Figure 16: Multi-paths Routing Table According to On-line Successors Matrix
Thirdly, to describe our network we need to find out the links cost of the paths. We have to draw the link’s cost between each hop. In this phase we already have the links load matrix. Thus, it merges between the links load and on-line paths and calculates the total link cost for each path in the routing table. Figure17shows the On-line Routing Table as output of the previous example.
Figure 17: The On-line Routing table of The Example
Throughout On-line routing table, OSPF checks the send and receive nodes of the tasks. If one of the sender or receiver node is OFF, there is no path for this task. The task will be canceled and removed from the node load matrix. Otherwise, the task has multi-paths and will look for the lowest path cost for the sender and the receiver nodes. Finally, these paths are being stored in the OSPF Tasks paths Table.
6.2
Optimizing Network Energy
The optimizing energy consumption of network scenario comprised of two optional cases. In the first phase, we find out the open shortest paths of the user’s tasks by assuming that all network devices are ON, to provide the optimal tasks paths and return the ON-OFF array of the network devices.
The second phase, the user enters manually the ON-OFF array and turns OFF some of the net-work devices. The OSPF will find out the cheapest paths of the user’s tasks. Then, we check if it is possible to improve the ON-OFF array to gain more energy optimizing and return the new ON-OFF array. Otherwise, the tasks without paths will be canceled and removed from the node load matrix. The second case covers both cases extensively. It is explained briefly in the previous example.
6.2.1 Optimizing Network Energy with OSPF
The OSPF routing protocol is employed to describe the state of the network by drawing a routing table with Link-State Advertisement (LSA) to find out the open shortest path first for the tasks over the network. OSPF takes into account the maximum load limit of the network links. It avoids congestion and hence it is useful for the real-time systems, where the congestion is a source of unpredictability.
OSPF task’s paths table shows a full path of the task from source to the destination with hops and the cost of each hop. Practically, the OSPF tasks paths table and the routing table are describing the network with information of every device in the network. OSPF tasks paths table illustrates only the employed devices to serve the tasks. Now we go through this table and set used devices as ON in the ON-OFF array and sets the rest of the devices as OFF. On the other hand, this table guarantees all tasks have met their constraints without network congestion or overloaded net-work. We turn off the unused device and this dose not affect the network load or deadline miss rate.
6.2.2 Optimizing Network Energy with Elastic Tree
As it mentioned about Elastic Tree in the related work section [7], it is a network topology pro-posed mechanism to optimize the energy consumption of a huge network with a large number of tasks. It adopted a Three-tier Fat-Tree network topology with clustering the network into multi-network areas with an assumption of one switch core for four modules. Each module consists of one aggregation switch and two top or rack switches as shown in Figure18.
A loaded network with a large number of tasks is taken into consideration. The Optimizing Network Energy with OSPF in the previous step provides the routing and OSPF tasks paths ta-bles. Furthermore, it provides zero energy optimizing in the worst cases of loaded network. By changing the network behavior to act as Elastic Tree, it avoids the zero gain of energy saving. In addition, Elastic Tree with OSPF improves and increases the Optimization of Network Energy consumption. The maximum optimization of the energy is represented as follows: Optimizing Network Energy with Elastic Tree = Optimizing Network Energy with OSPF + Optimizing Net-work Energy with Elastic Tree. In other words, with Elastic Tree, we would have at least the minimum amount of energy saving instead of zero gain in the worst cases. On the other side, the consequence of Optimizing Network Energy with Elastic Tree increases the load over the network especially at the aggregation and core layers. It represents the trade-off between the optimizing energy consumption and network’s load. With more energy optimizing it leads to increase the network load and vice versa.
Figure 18: Elastic Tree. Optimized 38% of Fat-tree Network Topology Energy Consumption[7]
6.2.3 Algorithm of The System Generation
The algorithm of the system generation should follow the steps mentioned in Subsections6.1and
6.2. It implements and calculates the optimization of the network energy consumption according to the mechanisms in Subsections6.2.1and6.2.2. The algorithm1describes the main mechanism. Algorithm 1 Algorithm of The System Generation: SystemGenerate( int NumberofSteps)
1: for iteration (from 0 to NumberofSteps) do
2: network = ImplementNetwork ( );
3: OSPFtasksPathsTable = OSPFroutingprotocol ();
4: Function OSPF-OptimizingEnergy( network, OSPFtasksPathsTable);
5: return OSPF-ON-OFF-array;
6: Function Elastic-Tree-OptimizingEnergy(network, OSPFtasksPathsTable);
7: return Elastic-Tree-ON-OFF-array, IncreasedNetworkLoad;
8: end for
The algorithm of system generation depends on NumberofSteps as input which is the number of the system cases. Then, we have set 1000 cases. The type of network’s variables and OSPF-tasksPathsTable is int[ ][ ] with a fixed size of the matrix. The type of Elastic-Tree-ON-OFF-array and OSPF-ON-OFF-array is int[ ], and int IncreasedNetworkLoad. The network variable rep-resents the implemented network as show in Figure 10. The OSPFtasksPathsTable represents the network tasks paths founded by OSPF routing protocol according to the open shortest path first. The function OSPF-OptimizingEnergy goes through the OSPFtasksPathsTable and turn off the unused devices in this table. The function Elastic-Tree-OptimizingEnergy improves the OSPF-OptimizingEnergy by converting the network to act as Elastic Tree topology and turn some switches off. These off switches will be added to the devices that have already been turned off by the OSPF-OptimizingEnergy function. During the system generation, the tasks constraints and network congestion were being checked.
7
Results and Evaluation
7.1
Experiments Setting
The target of this work is to gain the maximum optimizing of energy consumption of cloud com-puting system in the network part, under different system cases. Figure19shows the experiment’s designs consist of 3 parts as following:
1. System Generation as initialization part: to originate the network with it’s information under different system settings. In addition, to describe the network via OSPF routing table and find the network tasks paths.
2. Energy Optimizing is used to detect the idle devices and turn them off by OSPF Optimizing Energy. It consists of OSPF Optimizing Energy plus Elastic Tree mechanism to improve the energy optimization and turn off a large number of devices with consideration of tasks constraints and network congestion.
3. The work will make evaluations from the following aspects: (a) Optimizing energy consumption of the network with OSPF. (b) Optimizing Energy Consumption of the network with Elastic Tree.
(c) Increased Network’s Load after turning off the maximum number of the idle devices.
Figure 19: Project Diagram
The system is originated to handle a huge network with a large number of tasks. The range of random changes will be as following:
• The number of nodes is from 3 to 64. 3 nodes is as a minimum.
• The number of nodes per Rack is from 1 to 10. It is the number to distribute the nodes in each Rack.
• The number of tasks is from 3 to 100. 3 tasks as a minimum.
• The tasks load is from 1 to 1000 KB according to 1GB as assumption of the maximum link bandwidth.
• The links load from 0 to 500 KB equal the half of the bandwidth link. • The number of system generation is 1000 times.
• The allocation of the tasks between servers is always random for all experiments.
- Notation
• Nod represents the number of servers.
• NPR represents the number of servers per rack. • NT represents the number of tasks.
• TLoad represents the tasks load. • LinkLoad represents the Links Load.
• Increased Net-Load represents the increasing of network load after turning off a number of switches and cores. It only being calculated in core and aggregation switches layers.
7.2
Experiments Results
Table1 describes the minimum and maximum amount of optimizing energy consumption overall network. By using OSPF and Elastic Tree mechanisms under 1000 different system cases.
Table 1: The Min, Max and Average of Optimizing Network Energy Consumption by OSPF and Elastic Tree Mechanisms
Exp No
Network Information OSPF Optimizing Elastic Tree
Nod NPR NT TLoad LinkLoad Min% Max% AVG% Min% Max% AVG%
1 18 Rand Rand Rand Rand 2.77 77.77 15.26 11.11 80 21.15
2 Rand 3 Rand Rand Rand 1.35 85.55 19.05 12.16 85.55 26.28
3 18 3 Rand Rand Rand 3.33 73.33 10.24 13.33 76.66 17.51
4 Rand Rand Rand Rand 200KB 6.25 100 27.10 6.25 100 27.43
5 Rand Rand Rand 500KB Rand 1.35 100 22.03 6.25 100 27.62
6 Rand Rand 50 Rand Rand 1.96 100 16.5 7.5 100 22.25
7 Rand Rand Rand Rand Rand 1.63 100 23.01 6.55 100 28.39
8 18 4 50 200KB 200KB 13.79 20.68 13.99 13.79 20.68 13.99
9 32 3 25 200KB 200KB 16.36 38.18 26.33 16.36 38.18 26.33
10 64 4 75 300KB 100KB 9.27 23.71 14.55 11.34 25.77 16.54
The experiments divided into 3 groups. In the 1st group all arguments are random except one of them, which represents in experiments 1,2,3,4,5 and 6. In the 2nd group all arguments are random where it represents in experiment 7. The 3rd group all arguments are constant except the task allocation between servers is random which represents in experiments 8, 9 and 10.
Group 1, The system with a constant number of nodes per rack shows better energy optimizing than the system with a constant number of nodes. Because the drooping of modules number in the network means decreasing the number of the aggregation and cores switches. It puts together a large number of tasks within a module or rack and increases the opportunity to gain more energy saving.
Group 2, The system with random network information also shows better energy optimizing. This is because of three probabilities. Either because of the links load with tasks load is higher than the available bandwidth links and most of the tasks unserved or the tasks are in the same module and rack or simple tasks in a huge and unloaded network.
Group 3, The systems with constant network information shows a similar energy optimizing, whereas task allocation between servers is random. It meets the expected results.
In general, the results of the experiments show that the optimizing energy with OSPF deals with the idle devices in the network. it is partly unable to reach the maximum gain of optimizing energy consumption of busy network. After applying Elastic Tree mechanism with the optimized energy with OSPF, it is configured to manage and turn off the maximum number of devices in the network. By this process we gain the maximum energy saving over the network.
The method calculates the raise of the network load, after turning off the maximum number of devices in the network. Table2 describes the minimum, maximum, and average of the increased network load of the experiments in Table1under different system cases.
Table 2: The Min, Max and Average of Increased Network Load after Optimizing Network Energy Consumption by Elastic Tree Mechanism
Exp No
OSPF Optimizing Elastic Tree Increased Net-Load
Min% Max% AVG% Min% Max% AVG% Min% Max% AVG%
1 2.77 77.77 15.26 11.11 80 21.15 0 56.25 34.40 2 1.35 85.55 19.05 12.16 85.55 26.28 0 58.33 40.85 3 3.33 73.33 10.24 13.33 76.66 17.51 0 50 39.24 4 6.25 100 27.10 6.25 100 27.43 0 28.57 2.50 5 1.35 100 22.03 6.25 100 27.62 0 58.33 35.66 6 1.96 100 16.5 7.5 100 22.25 0 58.33 36.70 7 1.63 100 23.01 6.55 100 28.39 0 58.33 34.34 8 13.79 20.68 13.99 13.79 20.68 13.99 0 0 0 9 16.36 38.18 26.33 16.36 38.18 26.33 0 0 0 10 9.27 23.71 14.55 11.34 25.77 16.54 0 20 19.28
The results of Table2 show the minimum increase of the network load = 0. The Optimizing Energy with OSPF already reached the peak of energy optimization. The maximum raise of the network’s load represents the maximum difference of optimizing energy consumption made by Elastic Tree mechanism. The Average represents the average of the 1000 system cases. In conclusion, the increased network’s load is related to the difference between Optimizing Energy with OSPF and Elastic Tree mechanism. This means the increased network load is only appeared by the Elastic Tree mechanism. It increases and decreases according to the optimizing energy difference which appeared after applying the Elastic Tree mechanism with the Optimizing Energy with OSPF.
7.3
Results Analysis and Evaluation
7.3.1 Analysis and Evaluation of Energy Optimizing
Table1shows the calculated average of the optimizing network energy consumption with OSPF and Elastic Tree under different system cases. Table2 describes the average of the increased network load. As mentioned before, Elastic Tree is added to improve Energy consumption with OSPF for more optimized network energy consumption. The Maximum Optimizing Energy consumption = Optimizing Energy with OSPF + Optimizing Energy with Elastic Tree. Thus, Optimizing Energy with Elastic Tree = Optimizing Energy with OSPF + Optimizing Energy with Elastic Tree.
Figure 20: The Average Energy Consumption Optimizing of OSPF and Elastic Tree Showing the Average Increase of Network Load
7.3.2 Analysis and Evaluation of Increase Network Load
Figure 21 shows the difference between OSPF and Elastic Tree and how the network’s load is increasing and decreasing. This means the network’s load has a positive relationship with the increasing of the Elastic Tree. According to Figure20and21, the increasing of the network’s load increases approximately to linear trends with the difference between the OSPF and Elastic Tree mechanisms. Figure21 shows the trade-off between the optimizing energy consumption and the
Figure 21: Changes of Network Load According to The Difference between OSPF and Elastic Tree network load.
8
Discussion
We have demonstrated the data-center network topologies architecture and routing mechanisms. Furthermore, we found out the features and differences between them. Both of fat-tree topology and OSPF routing mechanism are employed to balance the load through the network links. This discovers the tasks paths with the lowest links load and keep the network in balance and turn off the unused devices (Server, Switch or Core), without affecting the performance of the network. Optimizing Energy with OSPF is not enough to reach the maximum optimizing energy consump-tion. Thus, we added improvements of some mechanism features to make the results more effective and reach the goal. By applying another mechanism without adding any improvements causes to useless results.
The combination between OSPF protocol and turning Off some aggregation and cores switches lead to reach the goal and get effective results. By this action we make the network to act as Elastic Tree. This means more optimized network energy consumption. On the other hand, we overlook a little the increase of the network load. Each module will have one aggregation switch instead of two in our network topology. The number of core switches also will decrease.
The experiments in Section7 showed that the tasks met their constraints and the links load are still under limits with no congestions in the network.
9
Conclusions
In this thesis, we exploit the advantages of an efficient routing algorithm to minimize the energy consumption of cloud computing systems. In our method the network switches are turned off according to their traffic load whilst maintaining the network performance. We employ this strategy in the popular Three-tier network topology. The network is described by drawing a routing table to facilitate finding the finest paths. We applied OSPF with features offer to address the load allocation and simplify the detection of idle devices. It gives us ability to turn them off. We
conclude: by applying OSPF routing mechanism we gain the average energy saving by 18.8% while we had 0% increase in the network load. By applying the Elastic Tree we achieved the maximum reduction in energy consumption of the network. The maximum energy reduction is: Optimizing Energy with Elastic Tree = Optimizing Energy with OSPF + Optimizing Energy with Elastic Tree. Furthermore, the results showed a significant improvement by integrating OSPF routing protocol and Elastic Tree mechanisms. Also, the average optimizing of network energy consumption by 22.75% with average increased network load by 24.3% which is a trade-off between the optimizing network energy consumption and the network load.
10
Future Work
There are multi future directions of energy consumption modules and prediction in the areas of cloud data centers networks in the network part. In this work, we focused on turning off the idle network devices. The future work can focus on a recursive method to calculate links load in different layers in the data-center network. This is to re-balance the load evenly through the network after turning off the maximum number of devices. Re-balancing the network it simplifies to check if there is more possibility to integrate network traffic and minimize switch link rate. Furthermore, taking into account network congestion and tasks constraints. The method repeats its function until getting the opportunity to turn off a higher number of idle devices.
OSPF is a wide common used routing protocol over different network topologies. We used OSPF routing protocol in our work. It is possible to develop our method to be more applicable on various network topologies being used in cloud data-centers.
References
[1] C. Guo, H. Wu, K. Tan, L. Shi, Y. Zhang, and S. Lu, “Dcell: a scalable and fault-tolerant network structure for data centers,” in ACM SIGCOMM Computer Communication Review, vol. 38, no. 4. ACM, 2008, pp. 75–86.
[2] M. V. Yang Liu, Jogesh K. Muppala, “A survey of data center network architectures .” [3] K. Bilal, S. U. Khan, J. Kolodziej, L. Zhang, K. Hayat, S. A. Madani, N. Min-Allah, L. Wang,
and D. Chen, “A comparative study of data center network architectures.” in ECMS, 2012, pp. 526–532.
[4] M. Rogers, M. Robert, and J. Businge, “Tools, architectures and techniques for monitoring energy efficiency in computer networks: State of the art survey,” International Journal of Computer Applications, vol. 146, no. 14, 2016.
[5] B. Wang, Z. Qi, R. Ma, H. Guan, and A. V. Vasilakos, “A survey on data center networking for cloud computing,” Computer Networks, vol. 91, pp. 528–547, 2015.
[6] A. Verma and N. Bhardwaj, “A review on routing information protocol (rip) and open shortest path first (ospf) routing protocol,” International Journal of Future Generation Communica-tion and Networking, vol. 9, no. 4, pp. 161–170, 2016.
[7] B. Heller, S. Seetharaman, P. Mahadevan, Y. Yiakoumis, P. Sharma, S. Banerjee, and N. McK-eown, “Elastictree: Saving energy in data center networks.” in Nsdi, vol. 10, 2010, pp. 249–264. [8] C. Guo, G. Lu, D. Li, H. Wu, X. Zhang, Y. Shi, C. Tian, Y. Zhang, and S. Lu, “Bcube: a high performance, server-centric network architecture for modular data centers,” ACM SIGCOMM Computer Communication Review, vol. 39, no. 4, pp. 63–74, 2009.
[9] S. Habib, F. S. Bokhari, and S. U. Khan, “Routing techniques in data center networks,” in Handbook on Data Centers. Springer, 2015, pp. 507–532.
[10] W. L. Guay, B. Bogdanski, S.-A. Reinemo, O. Lysne, and T. Skeie, “vftree-a fat-tree routing algorithm using virtual lanes to alleviate congestion,” in Parallel & Distributed Processing Symposium (IPDPS), 2011 IEEE International. IEEE, 2011, pp. 197–208.
[11] F. Zahid, E. G. Gran, B. Bogdanski, B. D. Johnsen, and T. Skeie, “A weighted fat-tree routing algorithm for efficient load-balancing in infini band enterprise clusters,” in Parallel, Distributed and Network-Based Processing (PDP), 2015 23rd Euromicro International Conference on. IEEE, 2015, pp. 35–42.
[12] F. J. Rodriguez, S. Fernandez, I. Sanz, M. Moranchel, and E. J. Bueno, “Distributed approach for smartgrids reconfiguration based on the ospf routing protocol,” IEEE Transactions on Industrial Informatics, vol. 12, no. 2, pp. 864–871, 2016.
[13] H. Faragardi, A. Rajabi, K. Sandstr¨om, and T. Nolte, “Eaica: An energy-aware resource provisioning algorithm for real-time cloud services,” in Emerging Technologies and Factory Automation (ETFA), 2016 IEEE 21st International Conference on. IEEE, 2016, pp. 1–10. [14] J. Shuja, K. Bilal, S. A. Madani, M. Othman, R. Ranjan, P. Balaji, and S. U. Khan, “Survey
of techniques and architectures for designing energy-efficient data centers,” IEEE Systems Journal, vol. 10, no. 2, pp. 507–519, 2016.
[15] A. Dhingra and S. Paul, “A survey of energy efficient data centers in a cloud computing environment,” International Journal of Advance Research in Computer and Communication Engineering, vol. 2, no. 10, 2013.
[16] M. Mezmaz, Y. C. Lee, N. Melab, E.-G. Talbi, and A. Y. Zomaya, “A bi-objective hybrid genetic algorithm to minimize energy consumption and makespan for precedence-constrained applications using dynamic voltage scaling,” in Evolutionary Computation (CEC), 2010 IEEE Congress on. IEEE, 2010, pp. 1–8.
[17] H. R. Faragardi, A. Rajabi, R. Shojaee, and T. Nolte, “Towards energy-aware resource schedul-ing to maximize reliability in cloud computschedul-ing systems,” in High Performance Computschedul-ing and Communications & 2013 IEEE International Conference on Embedded and Ubiquitous Computing (HPCC EUC), 2013 IEEE 10th International Conference on. IEEE, 2013, pp. 1469–1479.
[18] S. Fang, H. Li, C. H. Foh, Y. Wen, and K. M. M. Aung, “Energy optimizations for data cen-ter network: Formulation and its solution,” in Global Communications Conference (GLOBE-COM), 2012 IEEE. IEEE, 2012, pp. 3256–3261.
![Figure 1: Legacy DCN Architecture[2]](https://thumb-eu.123doks.com/thumbv2/5dokorg/4443754.107694/5.892.156.733.459.650/figure-legacy-dcn-architecture.webp)
![Figure 3: Computer Network Architecture[4]](https://thumb-eu.123doks.com/thumbv2/5dokorg/4443754.107694/6.892.274.609.606.852/figure-computer-network-architecture.webp)
![Figure 5: DCell architecture[4, 2, 3]](https://thumb-eu.123doks.com/thumbv2/5dokorg/4443754.107694/7.892.263.668.537.975/figure-dcell-architecture.webp)
![Figure 6: BCube architecture[4]](https://thumb-eu.123doks.com/thumbv2/5dokorg/4443754.107694/8.892.191.717.248.490/figure-bcube-architecture.webp)

![Figure 8: Three-tier Network Topology[13]](https://thumb-eu.123doks.com/thumbv2/5dokorg/4443754.107694/11.892.164.724.697.904/figure-three-tier-network-topology.webp)