Kultur–språk–medier
Examensarbete i fördjupningsämnet Engelska
15 högskolepoäng, avancerad nivå
The Role of Communicative Confidence
in the Swedish English Education
Are the Learners Ready for the Global Arena?
Rollen kommunikativ säkerhet har i
engelskundervisningen
Är eleverna redo för den globala arenan?
Jonas Berg
Jerry Olsson
Ämneslärarexamen med inriktning Engelska, 300 högskolepoäng
2016-03-06
Examinator: Björn Sundmark Handledare: Anna Wärnsby
2
Foreword
Both authors contributed equally to the making of this study. We would like to thank our supervisor Anna Wärnsby for her amazing support and feedback. We would also like to thank the teachers from the school for helping us out with participants for our study.
3
Abstract
In today's globalized society, English is one of the main ways of communication. Therefore, teaching students English in such a way that they not only understand the basics, but are confident enough to communicate with an international population of varied ability and linguistic background becomes a high priority in school. In this study we look at the reported communicative confidence level (CCL) of learners at a Swedish upper secondary school. This quantitative study collected data from questionnaires from upper secondary students in the Swedish school. We found that the participants
displayed an above average level of perceived communicative confidence; that a higher academic achievement correlated with a higher CCL; that the expected need, the
context, and the interlocutors do not correlate with the CCL; and that a higher degree of formality and unfamiliarity of a communication situation seems to correlate with a lower CCL. To be able to make confident generalisations in the future about CCL, we suggest this study be reproduced on a larger set of data and that actual CCL, as opposed to participant perception of CCL, could be observed.
Keywords: Communicative Confidence Level; English as a Foreign Language; English as a Second Language; English Education; Globalization; Global English; Lingua Franca; Swedish Upper Secondary Education.
5
Table of Contents
1. Introduction ... 7
2. Aim and Research Questions ... 9
3. Literature Review ... 10
3.1 Communicative Confidence and Language Proficiency ... 10
3.2 Globalization of English ... 11
3.3 Summary ... 13
4. Method ... 14
4.1 Quantitative Research ... 14
4.2 Setting and Participants ... 14
4.3 Ethical Considerations ... 19
4.4 Data Elicitation... 19
4.5 The Questionnaire ... 20
4.5.1 Communication situations ... 21
4.5.2 Familiarity and formality ... 24
4.5.3 Likert scale ... 25
4.6 Data Analysis ... 26
4.6.1 Omissions ... 26
4.6.2 Software employed ... 27
4.6.3 Necessary data conversion ... 28
5. Results ... 30
5.1 Average CCL and Uniformity ... 30
5.2 Academic Achievement, Linguistic Background, and Usage
Expectation ... 32
5.3 NNS or NS Interlocutors ... 35
5.4 Communication Situations' Formality and Familiarity ... 36
5.5 Summary of Results ... 40
6
6.1 Problematization of Our Results ... 41
6.1.1 Communicative confidence level average ... 41
6.1.2 Academic achievement ... 42
6.1.3 Communicative confidence level uniformity ... 42
6.1.4 Number of languages spoken ... 43
6.1.5 Usage expectations ... 43
6.1.6 NNS and NS ... 44
6.1.7 Formality and familiarity ... 45
6.2 Future Role as Teachers ... 46
6.3 Limitations of Method and Design of the Study... 47
7. Summary and Conclusions ... 49
7.1 Future Research ... 50
8. References ... 51
9. Appendix 1. Questionnaire ... 55
7
1. Introduction
In the latest Special Eurobarometer, the official public opinion surveyor of the EU, by TNS Opinion & Social (2012), the focus was on Europeans and their language. The report presents results showing that of “those countries where respondents are most likely to regularly use foreign languages on the internet are Sweden (71%), Denmark (69%) and Finland (61%)” (p. 51). Since English is the foreign language in Sweden most people claim proficiency in (p. 21), this demonstrates one of the settings where Swedish speakers of English make use of the English language in a global setting.
The English education in the Swedish school for upper secondary education aims to “develop language- and world-knowledge so that [the learners] can, want to, and dare use English in various situations and for various purposes” (our translation and emphasis, Skolverket, 2011a, p. 53). In the official English translation (Skolverket, 2011b), Skolverket has opted to not do a direct translation, but instead write
"confidence" (p. 1) instead of "dare". While this translation supports our purpose, we have decided to use our own more literal translation of the Swedish original, since it is that document and not the officially translated one we are basing our future career on. We find the formulation "dare to use English" particularly interesting. Having the courage to use English in various situations is of course related to the ability (“can”) and the motivation (“want”), but the fact that Skolverket explicitly adds “dare” indicates that communicative confidence is important enough to identify as a separate goal. We would therefore like to inquire into the confidence of learners in relation to their English use. How confident do they actually perceive themselves using their English? In what situations would they dare to use English after having completed their English studies?
When the curriculum mentions daring to use English, it is actually talking about communicative confidence, that is the will and ability to participate in communication without feeling that one’s language is in the way. This could include aspects like pronunciation and grammar, but also the self-image of how your English is perceived by others (Clement, Dornyei, & Noels, 1994).
Innumerable factors may affect a learner’s communicative confidence and in the Swedish school context there are some factors that may be more prevalent than others. Firstly, academic achievement is considered to be a relevant factor, since higher grades ideally correlate with high proficiency (see learning outcomes for the grades
8
many different languages a learner is proficient in and what those languages are) may affect communicative confidence (see Bialystok, 2001; Beyene, 2007 in section 3.1 and 3.2). The linguistic background of the interlocutor(s) (e.g. if the learner is speaking to a native or non-native speaker of English or if the learner shares another language with the interlocutor) of the learner may also affect communicative confidence (Neeley, Hinds, & Cramton, 2012; Beyene, 2007; Shehadeh, 1999). A third factor could be a learner’s expected degree of English usage, which is closely related to finding the English subject relevant and worthy of personal and intellectual commitment. See Tella (2007) for discussion on the correlation between usage expectation and academic
achievement. A fourth factor might have to do with the communication situation and the degree of formality and familiarity it entails. According to American Psychological Association (2015) matters that stress American people the most are those connected to money and safety, arguably formal matters. Vygotsky (1978) presents a model showing that unfamiliar may require more support when learning a language. These are factors that may affect the linguistic demands of a situation and thereby potentially the confidence for those situations.
Today due to globalization, the Internet, and the spread of American culture, English is being taught and used by people all over the world. English is used as a Lingua Franca (see Jenkins, 2007), a figurative bridge between people with different native languages. Present Day English is also sometimes described as World Englishes (see Kachru & Smith, 1985). The plural form indicates that the inner circle countries’ (e.g. US, UK, AUS) versions of English are not the definitive version of English, but that other non-Anglophone versions of English are as legitimate, containing their own idioms, cultural words, and dialects. This defines the arena in which the learners in the Swedish school are supposed to function. Learners' English proficiency must thus allow them to “dare” to communicate in such an environment where not only traditional Anglophone variants are used and with interlocutors who are not necessarily native speakers of English. While this may inspire confidence in the learners' own Swedish variant of English, there may still exist a cultural bias that could affect students’ communicative confidence. It is the Swedish school’s role to make sure that this communicative confidence is at an adequate level as indicated by the “dare” mentioned above.
9
2. Aim and Research Questions
Our aim is to look at the communicative confidence levels (CCL) of students who have completed or are close to completing their upper secondary English education; the CCL is scrutinized in relation to the factors that may affect its level to discover what the relevant factors in a person’s communicative confidence are and what role the school may have in this. Our aim is to generate further knowledge regarding this, which could benefit teachers and academic decision makers when developing future English
education in school.
We therefore pose the following research question:
Do any of the following four factors affect the reported communicative confidence level of learners of English from a Swedish upper secondary program and if so, in what way? - Academic achievement
- Linguistic background of the learner and of the other interlocutor(s) - Expected degree of English usage
10
3. Literature Review
In this section, we present the theoretical framework for this study. The section is structured into two parts: Communicative Confidence and Language Proficiency, and Globalization of English.
3.1 Communicative Confidence and Language Proficiency
Communicative confidence, in this text, refers to an interlocutor’s will and ability to participate in a conversation without feeling hindered by their perception of their own linguistic qualities, such as pronunciation, spelling, vocabulary, and grammar. The more confident the interlocutor, the better will this support communication, as the amount of mistakes could be reduced (Clement, Dornyei, & Noels, 1994). Beyene (2007) has shown that if you know more languages fluently, your willingness to communicate with native speakers (NS) of your second languages (L2) increases (Beyene, 2007). If you learn or know more languages, your confidence in using all of them increase. Henry and Goddard (2015) show that the biggest issue Swedish students face when studying at an international university in English is not the language; writing papers, listening to lectures, and participating in discussions were not considered difficult, instead, the content being learned proved the bigger challenge (Henry & Goddard, 2015). So, when it comes to confidence in using English as an L2, Swedish students seem to be doing okay.
Who you speak with and in what situation the communication takes place may also affect your communicative confidence (Clement, Dornyei, & Noels, 1994) and willingness to communicate (WTC), especially when using an L2 (Pawlak and
Mystkowska-Wiertelak, 2015). Further, if the situation is informal or formal, involves your boss, a stranger, or a friend. Additionally, where communication takes place may also be of significance: whether at work, at home, or at a public location. All factors in when determining how secure you are at engaging in communication. CCL may also be affected by the dialect of whomever you are communicating with, as shown in a study where NS Americans react differently to hearing different dialects of L2 English (Delamere, 1996).
Learning English, according to the Swedish curriculum, should increase the learners' ability to participate in a global academic and professional society (Skolverket,
11
2011a). The English subject is meant to teach the students confidence in using their L2 and to be able to communicate in a variety of contexts and situations. To be able to use a language you need to have the confidence to use it, and paradoxically becoming proficient in a language gives you the confidence to use it. Communicative confidence and L2 proficiency seem to have a positive correlation (Stankov, Lee, Luo, & Hogan). Confidence is also one of the main factors in achieving a higher grade according to Park, Lawson, and Williams (2012).
3.2 Globalization of English
Today, the English language is no longer limited to countries like Great Britain or the USA. It is now a language used worldwide, even in the absence of NS:s of English (Jenkins, 2007; Kachru & Smith, 1985). This use of English, where not every interlocutor is an NS of the language, goes by many names, e.g. English as an international language (EIL), Global English, English for academic purposes (EAL), World Englishes (WE, mentioned in Introduction), among others. However, we choose to focus on the Lingua Franca definition, originally made known by Jennifer Jenkins (Jenkins, 2007). While some may argue that Lingua Franca is only interaction between interlocutors who are not English NS:s (see Jenkins, 2007; Seidlhofer, 2004), we apply Lingua Franca in a different sense (see, for example, Mauranen, 2003) and include any communication situation in English where at least one interlocutor is not an English NS.
The point of using English as a Lingua Franca is to create a common language to bridge various language backgrounds, allowing for communication regardless of what your mother tongue is. However, this aid does not come without its problems. Neeley, Hinds, and Cramton (2012) highlight the issue of forcing English upon people in the business context. They found that English-only policies would to some extent shift the focus from content to language to the point where interlocutors felt that they had to spend their energy on speaking in English rather than putting that energy into conveying information properly. Had they been using their mother tongues, the focus would have been on sharing that valuable information they actually possessed (pp. 237-238). Although this may be harder to achieve in a school environment, it does connect to the curriculum goal of using English in the context of real working life.
Another potential issue with using English as a Lingua Franca lies in the
12
et al., 2012; Beyene, 2007) the interaction between native and non-native speakers of English was found to stigmatize the non-native interlocutors. The NNS (non-native speaker) reported feeling anxious, incompetent, disadvantaged, among others. when interacting with NS:s (Neeley et al., 2012; Beyene, 2007). In some cases, researchers reported that NNS would withdraw and become passive during the interaction; sometimes the NNS would even group up with each other and omit NS from their interactions (Neeley et al., 2012, p. 238). When NNS interacted with each other,
however, there seemed to be no stigma: the participants claimed that NNS interlocutors could more easily share ideas (Beyene, 2007, p. 49-50). This is further supported by Shehadeh (1999), who found that NNS-NNS interaction exhibited a higher frequency of negotiation for meaning, which would render such an interaction more supportive than an NS-NNS interaction (p. 658). These findings indicate that when English is used as a Lingua Franca there may exist a certain imbalance in terms of power: an NS is
linguistically, and therefore possibly also generally, at an advantage. In addition, when English is used as a Lingua Franca without an NS present, the NNS communication might be more focused on transfer of meaning.
Although using English as a Lingua Franca may give rise to several problems, it also has a lot of advantages. For example, Edu-Buandoh and Otchere (2012) found that participants in Ghanaian Schools wanted to learn and speak English to be able to ascribe English speaking skill to their identity; in their setting, knowing English was considered very prestigious, and this motivated the participants to improve their English. This can be nuanced by considering Cheung and Sung (2013), who compiled a number of studies looking at learning English as an L2 in the world. One finding was that the appeal to learning English does not always seem to be a desire of becoming part of a particular NS-culture, but to be able to participate in a global culture (Cheung and Sung, 2013). Learning English as a second language can therefore be a matter of identity and belonging.
Another reason to learn English and use it as a Lingua Franca is brought up by Ali, Wyatt, and Van Laar (2015), who argue that English may be used as a Lingua Franca to help promote a positive image of one’s native language and context. This is partly a contrast to the previous reasons, where NNS:s aimed to affiliate themselves with an English or global culture, the difference being that this position seeks out to remain affiliated with one’s current setting and make it part or a greater part of the global culture instead. This falls in line with Modiano (2003), who considers a Swedish
13
variety of English: Swenglish. In his article, Modiano argues that when the Swenglish variety is used, it is accepted by the interlocutors and functions as a communicative vehicle. Thus, the variety gains acceptance as a valid dialect of English. This increased acceptance can be compared with what Ali, Wyatt, and Van Laar (2015) argue: it promotes Swedish culture and speech variety as positive and valid member of a global culture. Modiano (2003) urges teachers to not shame the pupils and correct their Swenglish because this may prevent the Swenglish variety from becoming an accepted one.
3.3 Summary
In this section, we have explained two terms important for this study: communicative confidence and the globalization of English. Communicative confidence is one of the cornerstones in successful communication and is one of the goals of learning English in the Swedish curriculum. Communicative confidence is a person’s ability and will to participate in communication without being hindered by obstacles such as self-doubt. It is also connected to the globalization of English, the idea that English is becoming more than the mother tongue of a select few countries. English is now becoming a vehicle of successful communication globally, even between people who do not have English as an official language; it has become a Lingua Franca. This is however not without issues.
14
4. Method
In this chapter, we present the methodological choices we have made when conducting the study. The chapter is divided into sections giving detailed information on the creation, rationalizations, and execution of the questionnaire; information about the setting and participants of the study; the ethical considerations taken throughout the study; and the method and tools used when the data gathered was analyzed and processed.
4.1 Quantitative Research
Quantitative research focus on statistics and quantifiable results that can be extrapolated to be applied on a larger population. Common methods are surveys and observations (see, for example, Nunan, 1992).
Since our research question aims to look at the correlation between CCL (communicative confidence level) and a number of other factors, we would need data which could be turned into average and correlation: average will allow us to look generally at a current situation and then compare that with situations differing in time or context; correlation will enable speculation about causation, as there can be no
causation without correlation. We therefore decided to create a questionnaire because the data collected can more easily be quantified (Nunan, 1992, p. 143-144).
4.2 Setting and Participants
The school at which we carried out our study is located in a large city in southern Sweden. There are approximately 700 students at the school. It offers several programs, but the one we looked at is the behavioral science program with a focus on uniform occupations (e.g. police, firefighter, coast guard, customs, military, among others). The program is thus focused on further studies, however, not necessarily at university level. Often there are specific courses or certain programs mandatory to applicants of these jobs which are offered as part of a hire or are educations that lead to a hire. The program has around 100 students currently attending. The other programs at the school are also
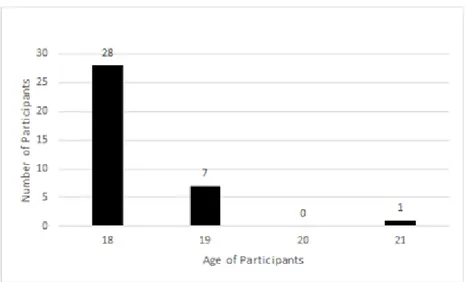
15 Figure 2. Age Distribution of Participants
focused on further studies, however, focus more on university studies than on
occupational studies; the uniform program does, however, provide all courses required for university studies. Since the program, is oriented towards the social sciences, but with a practical future application (uniformed jobs), the participants can be said to straddle two worlds: a theoretical world and a practical world. This can either mean they represent in part both worlds, or neither.
Figure 3. Gender Distribution of Participants
Our 45 participants were all learners at the upper secondary level of education. They all attended the school described above, and all participants were from the same education
16
program (the behavioral science with a focus on uniform program). The participants made up around half of that program's students. Most of the participants were taking their third and final year (33 participants) and some were taking their second year (twelve participants). The participants’ age ranged from 17 to 22, but after removing disqualified questionnaires the range was 18 to 21. 26 of the participants were 18 years old, seven were 19 years old, and one was 21 years old (see figure 2). After excluding some additional questionnaires from our study (detailed below), 36 questionnaires remained. Of those questionnaires, twelve recorded a female participant, and 24 recorded a male participant (see figure 3). Our participants therefore represent upper secondary students who have completed or nearly completed the mandatory English education in the Swedish school. We requested, but were denied access to statistics regarding gender distribution at the school; hence, gender could not be controlled and could not be used as a variable in the study, but could still be of interest in the
discussion.
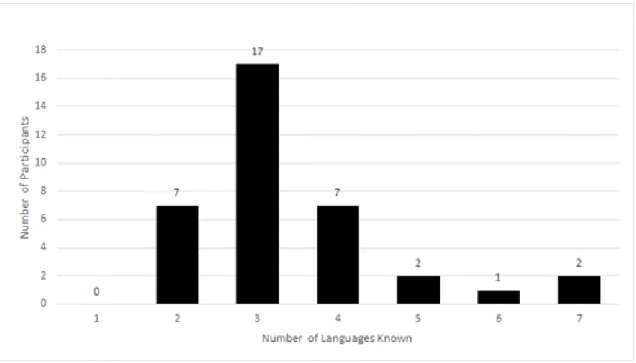
Figure 4. Number of Languages Spoken by Participants.
All participants reported proficiency in Swedish, however, not all reported Swedish as their mother tongue. Of the seven participants who spoke two languages, the two languages were always Swedish and English. As seen in figure 4, the participants speaking three languages made out the largest group of 17. Seven participants spoke four languages. After that, the number of participants dropped significantly to two
17
participants speaking five languages, one participant speaking six languages, and two participants speaking seven languages. The language distribution lends itself for analysis when participants speak two, three, or four languages in terms of providing enough data to be able to say something about those groups. However, it is not unexpected to find fewer participants in the groups where proficiency in five or more languages is reported; it is probably not as common that people speak as many as seven languages as it is that people will speak two or three. Therefore, our sample may not allow us to say something particular about learners speaking five or more languages, but the number of languages spoken is still a controlled variable in our study.
The participants had various experiences of English studies in the program; some had taken the two compulsory courses and were either not currently studying English or were in the process of taking a third non-mandatory one, whereas others were currently taking their second mandatory course. This means that their level of English proficiency might vary. However, since all participants finished their first mandatory year, they were considered ready for society at that initial level. Assuming that the grades will not change too much in the second year and given the fact that we collected our data late in the spring semester, the participants who recorded that they currently are taking their second mandatory year can still be considered valid for our purposes and ready to use English in society.
18
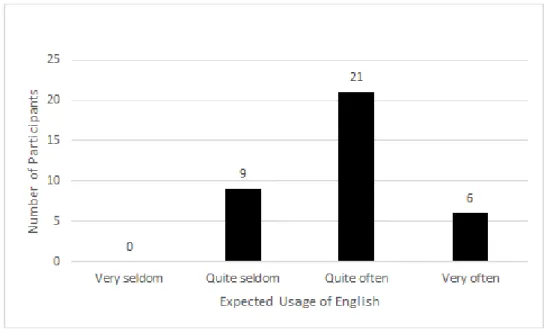
Looking at the expected usage of English after graduation, a bell curve appeared (see Figure 5). No participant recorded “very seldom”; nine participants recorded “quite seldom”; 21 recorded “quite often”; and six recorded “very often”. This means that the participants expects to use English to a degree slightly higher than average on our scale.
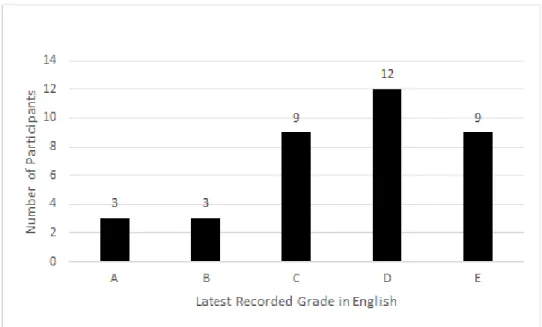
Figure 6. Latest English Grade of Participants.
The Swedish grade system for English ranges from F to A (see Skolverket, 2011a, pp. 55-63). Among the participants, three recorded an A in their latest English course, three recorded B, nine recorded C, twelve recorded D, and nine recorded E (see figure 6). The participants reporting an F as their latest grade were removed from further analysis, since they were not found ready to use English in the global arena according to the Swedish school, and thereby would not be of interest for our results. The bell curve which appeared this time has its highest point around the grade D, which indicates that the participants are just below average on the grade scale.
The setting and the participants were chosen for two reasons. The first reason was that those participants were the ones we had access to due to a connection with one of the teachers at the school, i.e. ease of access. The second reason is that English is a mandatory choice for any upper secondary school in Sweden and while some of the context of that learning of English might differ, the general purpose does not, that purpose being students’ ability to “can”, “want”, and “dare” (Skolverket, 2011a) to use their English globally (see introduction). Hence, these participants could be said to represent the average Swedish student in English.
19
4.3 Ethical Considerations
There are four main ethical considerations that we took, which are based on the recommendations of the Science Council (Vetenskapsrådet, 2002). The first consideration was the Information Agreement (our translation). It means that we informed our participants of the purpose of our study, what the role of the participants would be, and that their participation was non-mandatory. The second consideration was the Consent Agreement (our translation). First we made sure to obtain oral consent from all participants and from the school. In addition, one of the personal questions on the questionnaire asked for the age of the participant; since we did not ask for parental consent, this was used to remove any questionnaires answered by minors. The
Confidentiality Agreement (our translation) was the third consideration. Before the data collection commenced, all participants were informed that their participation would be anonymous. This had two purposes: to make sure no one is identified and to ensure honest answers. We also made gender an open question to let the participants answer in any way they felt comfortable with. Lastly, we had an open question asking for the participants spoken languages and allowed any or all to be checked as mother tongue. Therefore, the questionnaires did not ask for identifying information. In the description above, the school at which the survey was carried out has been anonymized as far as possible. The fourth and final consideration is the Application Agreement (our
translation). It means that we will not to use any collected data for commercial purposes or outside of our study. It also means that any personal information gathered will not be used to make decisions affecting that participant (e.g. decisions affecting their progress or presence in school).
4.4 Data Elicitation
The data was collected at the school where all of our participants attended. It was collected over a single day, in early April, at four separate classrooms during the school hours. Each time we started by introducing ourselves by name, that we are university students doing our final exam study, and described the nature of our study. We gave instructions on how the questionnaire should be filled out, that it was anonymous, and if they had any questions regarding comprehension or clarification they were free to ask. We also informed them that it was to be filled in individually and that it would probably take no more than 10 minutes. We, and a teacher, stayed in the classroom during the
20
collection process, but did not interfere or watch who answered what on the questionnaire. Once or twice, when the majority were done with answering the questionnaire, we prodded a student or two who apparently had stopped writing to finish by asking if they needed help, which resulted in them not needing it, but finishing the questionnaire instead. We then gathered all the filled in questionnaires without marking them or identifying them. Each such session lasted between 15 and 20 minutes.
4.5 The Questionnaire
The questionnaire was created in Swedish in two parts (see Appendix 1). The first part collected personal information of participants pertinent to the study, i.e. gender, age, achieved grades in English and the languages spoken. Gender was an open question in case the options we would have provided would not have included the gender the participants identified themselves as; gender subsequently constituted one of the variables for the analysis in this study. Age was included as a variable for correlation analysis and to make sure the participants were of age as we had not obtained the consent of participants’ legal guardians. The question about students' achieved grades gave the participants the choice to fill in the grades they had achieved in English 5, 6, and 7 if applicable, and was also an analysis variable. The question on languages spoken included up to seven options and the students were asked to mark the ones they identified as their mother tongues. This was partly for us to be able to identify people whose linguistic background would have interfered with their answers. Linguistic background was also considered an important variable (see Bialystok, 2001; Beyene, 2007).
The second part of the questionnaire consisted of closed-scale questions. Closed means that the questions had a limited number of answers that can be chosen to each of the questions, and scale means you are supposed to grade your answer on a scale (in our questionnaire from 1 to 4) (Nunan, 1992, p. 143-144). We chose the closed approach because it provided a limited number of possible answers, meaning that the data
became more easily quantifiable. The scale was included because it allowed us to gauge the level or degree of communicative confidence participants would perceive
themselves to have; this was a vital requirement for our research question.
Initially, we chose several different countries for our communication situations when creating our questionnaire. We wanted to cover a large number of different World
21
Englishes to reflect the current development in the world. We then conducted a pilot study with five participants. After feedback from the pilot participants, we decided to change all non-English speaking countries to Italy and all English speaking countries to the United States as it proved problematic for the results we wanted. It turned out that the specific countries mentioned influenced the participants too much, even when both countries were NS (native speaker) or NNS (non-native speaker). We wanted the focus to be on whether the communication was with someone with English as a native language or not; we did not want country specific bias to be a factor (e.g. a participant having a certain disposition towards a specific country’s level of English). We chose Italy because it’s not a common first or secondary language in Sweden so we would not have to exclude many participants, at least it is not one of the languages in which schools are required to offer education (Utbildningsdepartementet, Ch. 9, 5§.). We chose the US because we believe that it has a rather strong cultural attraction, which is discussed in Jessica C.E. Gienow-Hecht (2006); this means that the participants could more easily recognize themselves in those situations.
4.5.1 Communication situations
Our aim with the questionnaire was to try to find factors that would affect a
participant’s communicative confidence. While asking the participants such a question directly would be one approach of getting to that data, it would be an approach where our aim’s transparency might affect the results; to put this in the terms of Nunan (1992), we would “intervene” (p. 5) too much. Yet, we could not afford being too vague, as that would yield too much data; again putting this in terms of Nunan (1992), we would be too “unselective” (p. 5). We therefore had to find a way of asking our participants about these factors in a subtler and indirect way while still being specific enough to keep the results manageable. Hence, we chose to create communication situations.
22
Table 1. Questions Where the Mother Tongue of the Interlocutor Can Be Compared and Contrasted (translated excerpt from the questionnaire).
NS example:
Question 18. You have a friend from USA. You converse about your favorite series on Skype in English.
NNS example:
Question 19. You have a friend from Italy. You converse about your favorite series on Skype in English.
The communication situations would describe different situations where different factors would vary. All situations but three (which were a triad) were structured into dyads where the only difference between two situations would be the mother tongue or the nationality of the interlocutor (see Table 1 in bold). In this way we were able to compare the effect of communicating with a NS of English and a NNS of English, which was found a valid variable in previous research (see Neeley et al., 2012; Beyene, 2007; Shehadeh, 1999).
Table 2. Questions where familiarity in relation to the participants’ experiences can be compared and contrasted (translated excerpt from the questionnaire).
Familiar situation example:
Question 21. You have a friend from Italy. You are writing in the Facebook chat about your favorite bands in English.
Unfamiliar situation example:
Question 29. You have gotten a job here in Sweden at a company that sometimes conducts business internationally. You have a client from Italy and your boss gives you the task to take care of the deal. You and the client converse in English.
The different dyads could also be compared and contrasted depending on the formality of the situations described (see table 2) and depending on the familiarity in relation to the learners (see table 3). For example, one question from a dyad would describe a more formal situation which could then be contrasted with a question from another dyad that
23
would describe a more informal situation, as can be seen in table 2. The same process was done for questions describing more familiar and more unfamiliar situations (see table 3).
Table 3. Questions where formality of a situation can be compared and contrasted (translated excerpt from the questionnaire).
Informal example:
Question 12. A friend from USA is visiting you. One night, you and the friend from USA are hanging out with one of your friends from Sweden. You are telling your friend from Sweden about how you met your friend from USA. Only you and your friend from Sweden know Swedish, so in order for everyone to understand, you speak in English.
Formal example:
Question 6. When you are finished with your upper secondary education, you travel to
USA to study for an occupational degree. You and your classmate from USA are doing a
group work. You speak in English while you work.
Returning to Nunan, our questionnaire can be described using the model “Parameters in research design”-table (figure 1), a modification by Nunan of the
original model by Van Lier (in Nunan, 1992, pp. 5-6). Our questionnaire would position itself in the upper right quadrant of the model as a “measuring” approach (see figure 1 below). The questionnaire would be very selective in the sense that we defined the situations and parameters. The questionnaire would, however, be less interventionist since we would describe various situations for the participant to imagine rather than explicitly asking about a specific factor’s impact on their confidence.
24 Figure 1. Parameters in Research Design
It is, however, important to note that while our approach tries to emancipate itself from opinion-based answers and instead aim to measure reaction to various situations, the participants are still asked to record self-perceived confidence. Hence, there is still an element of opinion-based answers, but the degree has been reduced with the utilization of communication situations. The next step towards making this less opinion-based would be to actually observe real situations instead of asking about perceived confidence level, but that is something we leave for future research.
4.5.2 Familiarity and formality
Since familiarity and formality are two important factors in our analysis, we find it of significance to define the two terms. The Oxford dictionary (2016) defines "familiar" as follows: "Well known from long or close association" (Familiar, 2016) and "Often
encountered or experienced; common" (Familiar, 2016).We further nuance the
definition of a familiar situation as a situation which the participant has some previous experience of, a situation that the participant feels confident being in, and a situation in which the participant has a good understanding of the conventions and expectations that apply.
Defining formality is not an easy task. Many attempts have been made; for example, Meiners and Miller (2004), who assert that in business situations “formality is indicated by the presence or absence of structure shaping the interaction” (p. 306 (pdf:
25
p. 6)) and that “informal interactions are likely more unstructured, spontaneous, and off-the-record than formal ones” (p. 306 (pdf: p. 6)). While definitions like these may suffice in certain situations, we found that for our purposes the definition was non-conducive to our categorization.
Instead, we chose to turn to Maslow’s (1987) Hierarchy of Needs for our
definition of formality. In the hierarchy, Maslow ranks the various needs a human being has starting with the Physiological Needs (e.g. eating, breathing, and sleeping) followed by the Safety Needs (e.g. financial safety, a place to live, and “laws and limits” (p. 18)) as the bottom two and most fundamental needs (p. 15-18). We identify situations that would mainly affect any of these two levels as more formal situations. This means that a job interview would normally be classified as more formal, since it would affect one’s financial security substantially. Maslow continues his hierarchy with the following three upper needs in order: the Belongingness and Love Needs (“relations with people in general” (p. 20), e.g. friendship, family, and a romantic partner), the Esteem Needs (e.g. confidence, achievement, self-respect, being respected by others, and holding a good reputation), and the Self-actualization Need (fulfilling one’s personal desires, e.g. “artists must paint [and] poets must write if they are to be ultimately at peace with themselves” (p. 22))). Conversely, we define situations that would mainly affect any of these three needs as more informal situations. Concretizing this means that conversing with a friend would normally be informal, since it mainly affects the three upper levels. We chose this approach in defining formality since it allows us to categorize our
communication situations more clearly and with fewer situations falling into gray areas; using definitions like the one of Meiners and Miller (2004) above forced us to leave more situations unclassified, as they would fit both the definition of more formal and more informal.
4.5.3 Likert scale
The questions in the second part of the questionnaire were answered on a Likert scale (you indicate your level of confidence on a scale from 1 to 4). We chose the Likert scale since we wanted to look at the broad structures, not the small nuances in the
participants’ confidence level; that is to say we wanted to see if they had a strong or weak reaction and if it was positive or negative. Joshi, Kale, Chandel, and Pal claim that “Likert scale was devised in order to measure ‘attitude’ in a scientifically accepted and
26
validated manner in 1932” (Joshi, Kale, Chandel & Pal, 2015, p. 397). Using an even number of possible answers is called an asymmetric scale, since it offers less choices on one side of neutrality. It is used when the researcher perceives no value in a neutral response (Joshi et al., 2015, pp. 397-398)
The questionnaire had two kinds of Likert scales. There was one question that asked the participants how much they anticipated they would use English after finishing upper secondary school. This Likert scale ranged from “very seldom”, “quite seldom”, “quite often” to “very often”. The remaining 29 questions all described plausible future scenarios where the participant would use English and gave them the option to answer how confident they would be in their use of English in that scenario. The Likert scale for these questions ranged from “very unconfident”, “somewhat unconfident”, “quite confident”, to “very confident”.
The questionnaire contained quite a bit of reading, the scenarios were quite detailed and some were similar, with only small but crucial changes which were bolded. To help with clarifying the details, we decided to create the whole questionnaire entirely in Swedish, since the study takes place in Sweden and the native language of the
majority of the participants is Swedish. The pairing of the dyads and bolding of certain words was also used for this purpose.
4.6 Data Analysis
In this section, we present the different parts of the data analysis conducted on the collected data. This includes omissions, software employed, and necessary data conversion,
4.6.1 Omissions
Some questionnaires had to be removed before analysis. Five of the participants taking their second year of studies were found to be underage; since we only had oral consent from the participants and not their guardians, those questionnaires filled out by
underage participants were removed. Four additional questionnaires were removed before analysis. The first questionnaire was removed because the participant recorded language knowledge that would interfere with the results; the participant reported knowledge of Italian, which was a language playing a major role in our questions (no other participant reported any skills in Italian). The second questionnaire was removed
27
because the participant had not completed the questionnaire to a satisfactory degree. The third questionnaire was removed because the participant had not completed any of the mandatory English courses in upper secondary school. The fourth was removed because it recorded an F in their only taken course, meaning the school had not deemed the participant proficient in English. After removing questionnaires not meeting our demands, we were left with 36 questionnaires to analyze.
In the data analysis, four of the 29 questions from the questionnaire described one-way communication and were therefore deemed to be less comparable with the other questions which all targeted two- or multi-way communication. When creating and piloting the questionnaire, we failed to recognize this imbalance. Ultimately, we decided that this would simply add another layer of possible reasons for divergence in the results. For us to draw valid conclusions, it was important to keep the number of possible reasons for divergence to a minimum; hence, we completely omitted those four questions from the analysis.
4.6.2 Software employed
We used two software when analyzing our data. Our data was collected from the physical questionnaires and then processed digitally in Microsoft Excel. It was then converted into graphs and tables for the sake of clarity and analysis. We then used IBM SPSS Statistics 23, a statistical analysis program by IBM, to check for correlations in our data.
When presenting our data, we normally indicate the mean and sometimes the median and mode. The mean is just the average score in a given data set and gives you a general value and overview of that set of data. Because the mean can be heavily
influenced by a minority of extreme scores, either positive or negative, we also use the median. The median is simply the value in the middle of the data when ordered after magnitude (numerical order) and is less affected by extreme scores. The mode is the score that appears most frequently in a set of data and tells you the majority score (Field, 2009, pp. 21-23).
Microsoft Excel was used to gather all the data collected and organize it. It allowed us to calculate means, median, and mode and create graphs and charts to help visualize the results. The table format of Excel greatly expedited data conversion to SPSS as well.
28
We used SPSS as the digital platform and Spearman’s Rho, one of the SPSS tools to analyze correlations between our data sets. Using these, we can see if there is a positive correlation (or negative) between any chosen variables of factors, how strong that correlation is, and if any such correlation is statistically significant. If a correlation is statistically significant it means that there is a 5 % or less probability of the
correlation to be pure chance; if it’s very significant it means there is a 1 % or less probability to be pure chance (Field, 2009, pp. 52-53).
4.6.3 Necessary data conversion
There were two specific factors which required additional preparation and conversion of data: the grade factor and the formality and familiarity factor. First, in order to correlate grade data with the confidence data we had to convert the grade data into numbers from the letter system used in Swedish school. The five grades of A, B, C, D, and E were converted into 5,4,3,2, and 1. The failing grade of F was omitted since it indicates that the participant has not completed the mandatory English course and is not deemed proficient in English by the Swedish school.
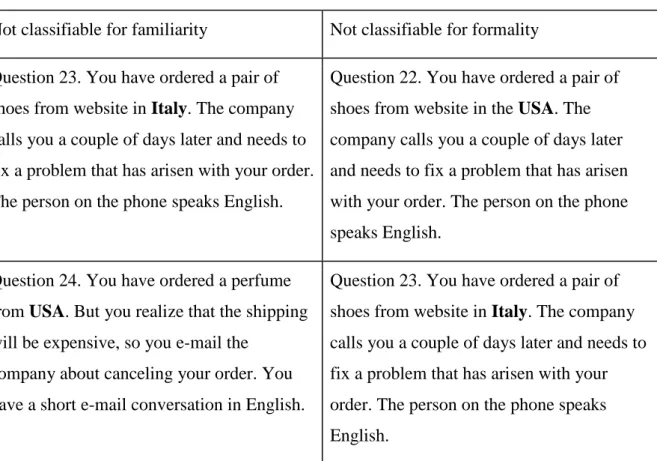
Second, we could not check for correlation between familiarity and formality in SPSS, since there was only one rank of data; familiarity and formality was a binary trait rather than a rank. We therefore sorted the questions based on the mean CCL, then classified each question as formal or informal and as familiar and unfamiliar. Four of the questions (question 22-25) (all questions from two dyads) regarded online shopping; we were not certain whether our participants had any experience of online shopping, especially since most of them had just turned 18 (the age at which online shopping becomes legal in Sweden). Therefore, we decided to omit questions 22-25 from our familiarity analysis. Two of the questions (question 22 and 23) (both of the same dyad) regarded a conversation solving an issue during online shopping, but failed to mention the nature of the issue; hence, with our definition of formality using Maslow’s
hierarchy, we could not determine whether the issue was of a fiscal nature or an aesthetic nature. We were therefore forced to omit these questions in our formality analysis. Additionally, questions one to three were ambiguous in their nature in terms of formality. These questions considered taking English courses at a Swedish university, which could be done with the purpose of attaining a job or just for the sake of personal growth; thus, returning to Maslow’s hierarchy, these questions could be either more
29
formal or more informal. However, the Eurobarometer (TNS Opinion & Social, 2012) found that the purpose for learning English in Sweden was for 65% of the participants to work abroad, for 70% of the participants to work in general, and for 48% of the participants to achieve more personal satisfaction (p. 65). Therefore, we conclude that it seems more common to study English in Sweden with the purpose of getting a job, which, returning to Maslow’s hierarchy, mainly affects the bottom two needs; question one to three were therefore classified as more formal.
Table 4. Examples of communication situations not classifiable for familiarity and/or formality
Not classifiable for familiarity Not classifiable for formality
Question 23. You have ordered a pair of shoes from website in Italy. The company calls you a couple of days later and needs to fix a problem that has arisen with your order. The person on the phone speaks English.
Question 22. You have ordered a pair of shoes from website in the USA. The company calls you a couple of days later and needs to fix a problem that has arisen with your order. The person on the phone speaks English.
Question 24. You have ordered a perfume from USA. But you realize that the shipping will be expensive, so you e-mail the
company about canceling your order. You have a short e-mail conversation in English.
Question 23. You have ordered a pair of shoes from website in Italy. The company calls you a couple of days later and needs to fix a problem that has arisen with your order. The person on the phone speaks English.
When we had classified all questions, we looked at the spread of formality and familiarity across the rank of mean CCL. We counted the number of times a question classified as formal would appear above and below the mean CCL for all participants; then we repeated the process for each factor. We chose to identify the center based on the mean CCL of the participants, because it showed us in what situations participants would feel more confident than average or less confident than average.
30
5. Results
In this chapter, we present our findings. The results are divided into the following categories: Average Communicative Confidence Level (CCL) and Uniformity;
Academic Achievement, Linguistic Background, and Usage Expectation;Non-Native
Speaking or Native Speaking interlocutors;Communication Situation’s Formality and
Familiarity; and Summary of Results. Our research question was as follows:
Do any of the following four factors affect the reported communicative confidence level of learners of English from a Swedish upper secondary program and if so, in what way? - Academic achievement
- Linguistic background of the learner and of the other interlocutor(s) - Expected degree of English usage
- Communication situation’s formality and familiarity
5.1 Average CCL and Uniformity
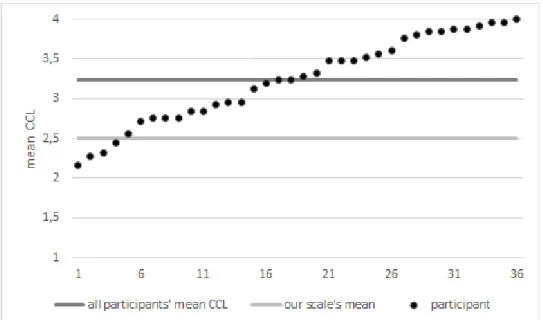
Our results show that only two participants recorded a mean CCL at about 2,5. This was the mean of our scale (1-4). The first participant measured at 2,44 and the second at 2,56; other participants deviated from this number by more than 0,10. Further, only four participants recorded a mean CCL below 2,5; a large majority of 86 % (31 out of the 36) of participants recorded a mean CCL above 2,5. The total mean CCL for all
participants was 3,24. This means that our participants are slightly more confident than what we expected. If we were to translate this into the terminology used in the
questionnaire, the average participant records a mean CCL of slightly more than “pretty confident”.
31
Figure 7. Participants’ Mean CCL in Comparison to Mean CCL on Our Scale.
Additionally, we found a correlation between most of the questions when comparing them to each other; 25 questions compared to each other means a total of 300 different possible comparisons ((25*25-25)/2=300). Of the 300 comparisons, twelve were insignificant, 31 were significant, and 257 were very significant. Of the 288 significant correlations, seven were significant to a degree of 0,8 or more; as mentioned earlier, the closer a value is to 1,0 or -1,0 the closer it is complete correlation.
Table 5. Correlations Between Questionnaire Communication Situations
What this means is that participants would display a high degree of uniformity in their CCL; a participant with a high CCL in one question would have a high CCL in almost every other question, and vice versa for participants with other levels of communicative confidence (see table 5 and appendix 1).
32
5.2 Academic Achievement, Linguistic Background, and
Usage Expectation
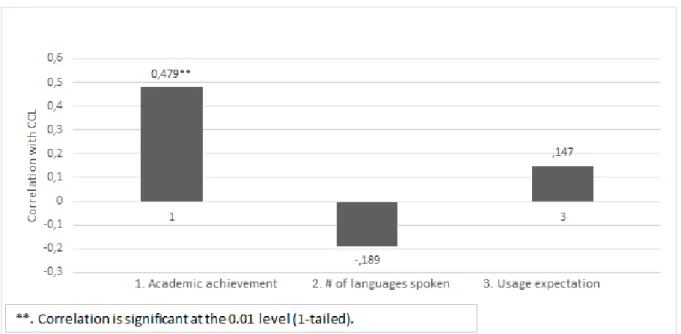
As can be seen in figure 8, the mean communicative confidence level (CCL) is compared to three factors: academic achievement, linguistic background, and usage expectation. A positive value means that when confidence increases the other factor also increases; the opposite relation applies to a negative value.
Figure 8. How Do Factors Correlate with Communicative Confidence?
A value closer to 1,0 or -1,0 means more correlation, where 1,0 means total positive correlation; e.g. when communicative confidence increases, the other factor increases an amount equal to the change in confidence. -1,0 means total negative correlation; e.g. when communicative confidence increases, the other factor decreases an amount equal to the change in confidence.
33
Figure 9. Grade Distribution in Relation to Mean CCL
As can be seen in Figure 9, there are three participants with an A or a B respectively, nine participants with a C, twelve with a D and another nine with an E. When looking at the correlation between the CCL of the participants and their grade in English we find a positive correlation to a very significant degree (0,479). What this means is basically that high grades and high CCL are connected, and low grades and low CCL are connected (see figure 8).
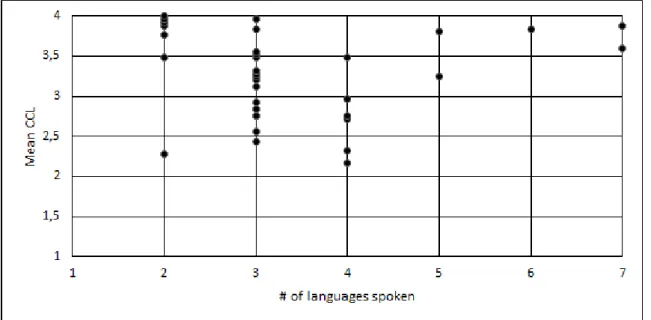
34
Figure 10 shows the distribution of number of languages spoken between participants in relation to their mean CCL. Each dot is one participant and shows the number of languages they speak and their mean CCL. When looking at the correlation between the CCL and the number of languages the participants are proficient in we can see a small negative change to the number of languages known when CCL increases; however, the correlation is not significant (-0,189) and can just as well be attributed to chance. There is no correlation to any significant degree between the participants’ language proficiencies and CCL (see figure 8).
Figure 11. Spread of Usage Expectation in Relation to Mean CCL
In figure 11, the spread of usage expectation of English can be seen. Nine participants expected to use English “quite seldom”, 21 reported “quite often”, and six reported “very often”; no participant reported the lowest expectation “very seldom”. When looking at the correlation between the CCL of the participants and their expected usage of English you can see a very small positive change to the expected usage of English as CCL increases; however, the correlation is not significant (0,147) and can just as well be attributed to chance. There is no correlation to any significant degree between the expected usage of English and CCL (see figure 8).
35
5.3 NNS or NS Interlocutors
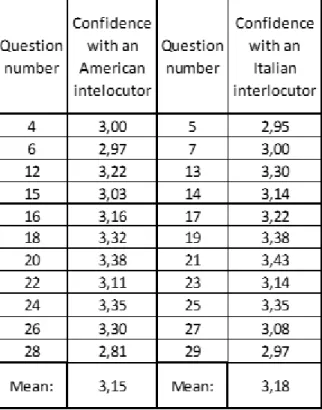
Looking at table 6, we find information about confidence among students comparing NNS (non-native speaker) and NS (native speaker) related communication. 11 of the questions were communication within an Italian context (NNS English) and 11 were with an American context (NS English), these were all in dyads of context, except questions 1,2, and 3 that were a triad and omitted here because of irrelevance (see questionnaire in Appendix 1 for examples of dyads in Swedish, e.g. 4 and 5 or 18 and 19, or see the method section titled 4.1.1 Communication Situations for an English example).
Table 6. Mean CCL in Relation to Interlocutor Linguistic Background
Looking at all the questions where the communication was with an NS yielded a mean average of 3,15 CCL. Looking at all the questions where the communication was with an NNS yielded a mean average of 3,18. (see table 6). When analyzing correlation, we found a strong positive correlation (0,870), meaning that when a participant recorded high CCL with an NNS interlocutor they also recorded high CCL with an NS
interlocutor, and the opposite can be said for participants with a lower CCL (see table 7). The most significant correlations were always between two questions within a dyad
36
(see Appendix 1). This means that, to the participants' CCL seems to have little effect whether the interlocutor is an NS or NNS.
Table 7. Correlation Between Mean CCL with a Speaker from USA and Italy
5.4 Communication Situations' Formality and Familiarity
In this section, we present our results regarding the formality and familiarity of the communication situations. Tables 8 and 9 contrast, for example, familiarity and formality; these tables can also be found in the method section titled Necessary Data Conversion (see also Appendix 1 for the full questionnaire with the numbered questions).
Table 8. Example of Contrasting Familiar and Unfamiliar Communication Situations Familiar situation example:
Question 21. You have a friend from Italy. You are writing in the Facebook chat about your favorite bands in English.
Unfamiliar situation example:
Question 29. You have gotten a job here in Sweden at a company that sometimes conducts business internationally. You have a client from Italy and your boss gives you the task to take care of the deal. You and the client converse in English.
Let us first look at familiarity (see table 10). All questions classified as
unfamiliar situations (questions 2-7, 16-17, and 28-29) ended up below the mean CCL of all participants; further, the seven situations ranked with the lowest CCL were unfamiliar situations.
37
Table 9. Example of Contrasting Informal and Formal Communication Situations Informal example:
Question 12. A friend from USA is visiting you. One night, you and the friend from USA are hanging out with one of your friends from Sweden. Du are telling your friend from Sweden about how you met your friend from USA. Only you and your friend from Sweden know Swedish, so in order for everyone to understand, you speak in English.
Formal example:
Question 6. When you are finished with your upper secondary education, you travel to USA to study for an occupational degree. You and your classmate from USA are doing a group work. You speak in English while you work.
For familiar situations (questions 1, 12-15, and 18-21), however, the spread is more equal, where 56% ended up above the mean CCL for all participants and 44% below the mean CCL for all participants; the five situations ranked with the highest CCL (ignoring unclassifiable situations) were all familiar situations. This means that a more familiar situation does not necessarily affect the CCL of the participants; however, a more unfamiliar situation seems to, quite convincingly, be related with lower CCL.
38 Table 10. Familiarity in Relation to Mean CCL
Moving on to formality (see table 11), a majority (82%) of the questions
(questions 1-7 and 28-29) classified as formal situations ended up below the mean CCL of all participants; the seven situations ranked with the lowest CCL were formal. As in the previous case the opposing counterpart did show a more balanced spread: in fact, the split was perfectly even, and 50% of the situations classified as informal ended up above the mean CCL (and vice versa); the three situations ranked with the highest CCL were informal situations. This seems to indicate that a more informal situation does not affect the CCL; a more formal situation, on the other hand, seems to be associated with lower CCL. 3,43 f 3,38 f 3,38 f 3,35 x 3,35 x 3,32 f 3,30 f 3,30 f 3,22 f 3,22 u 3,19 u 3,16 u 3,14 f 3,14 x 3,11 f 3,11 x 3,08 f 3,03 f 3,00 u 3,00 u 2,97 u Key: 2,97 u f = familiar 2,95 u u = unfamiliar 2,92 u x = unclassified 2,81 u Mean CCL Familiarit y Center based on mean CCL (3,24) Unfamili ar (%) 55% (6/11) 0% (0/10) 45% (5/11) 100% (10/10) Familiar (%) 50% (2/4) Unclassifi ed (%) 50% (2/4)
39 Table 11. Formality in Relation to Mean CCL
However, despite the indication of these patterns, the actual difference in CCL between the highest and the lowest is not very significant. On our scale of 1-4, the lowest mean confidence level recorded was 2,81 and the highest 3,43; the difference being a mean score of 0,62. This means that although the correlation seems to suggest that the CCL is higher in a more familiar situation and/or in a more informal situation, the strength of that correlation may not be sufficient. Further research into this area is needed before a more definite claim can be made.
3,43 i 3,38 i 3,38 i 3,35 f 3,35 f 3,32 i 3,30 i 3,30 i 3,22 i 3,22 i 3,19 f 3,16 i 3,14 i 3,14 x 3,11 f 3,11 x 3,08 i 3,03 i 3,00 f 3,00 f 2,97 f Key: 2,97 f f = formal 2,95 f i = informal 2,92 f x = unclassified 2,81 f Informal (%) Formal (%) Mean CCL Formality Center based on mean CCL (3,24) 100% (2/2) Unclassifi ed (%) 0% (0/2) 50% (6/12) 18% (2/11) 50% (6/12) 82% (9/11)
40
5.5 Summary of Results
Our results show that the mean CCL among participants was somewhat higher than the median on our scale, which means that they report a fairly high CCL. In addition, we found that participants seemed to record a quite uniform CCL, where a participant who recorded a high CCL on one question would mostly record a high CCL on every other question (and vice versa). Our findings also showed a very strong positive correlation between academic achievement and CCL, thus our findings show that a participant reporting a higher CCL also has a higher final grade in English. On the other hand, the following three factors considered did not correlate with CCL: usage expectation of English after finishing their secondary education, the number of languages spoken, and interlocutors speaking English either as a mother tongue or as a second or foreign language. We found a significant correlation when comparing reported CCL for communication with an NS and communication with an NNS. That is, students rated their CCL high or low regardless of the interlocutor’s language background. Finally, our data showed a connection between formal communication situations and a lower CCL, while informal communication situations had no such connection. This means that formal settings seems to affect student’s CCL negatively, while informal settings have no bearing on CCL. When it comes to familiar communication settings, we found a similar pattern; unfamiliar situations were associated with lower CCL, while familiar situations seemed to have no connection.
41
6. Discussion
In this section we discuss our findings from the results section and relate them to the previous research presented in the literature section. We then discuss our results in relation to the classrooms. This is finally followed by critical considerations regarding our study and suggestions for further research.
6.1 Problematization of Our Results
This section is divided into seven sections, based on the categories from the results section.
6.1.1 Communicative confidence level average
Our results showed that the mean CCL (communicative confidence level) of our participants was above the scale’s mean of 2,5 at 3,4, meaning the average participant reported their CCL at somewhere between “pretty confident” and “very confident”. In the Eurobarometer (TNS Opinion & Social., 2012), Sweden ranks just around the Europe average of 25% at English listening (24%), reading (28%), and online communication (30%) skills (pp. 28-39). If we compare the Eurobarometer with our results we can possibly deduce that while skills might be average, confidence levels are above that. This is in opposition to previous research, which shows a positive
correlation between confidence and academic achievement (See Park, Lawson, and Williams (2012) and Stankov, Lee, Luo, and Hogan (2012) in the Literature Review). The Eurobarometer; however, does not measure oral communicative skills maybe because of difficulties to make such a test reliable, and our questionnaire and data collection focused on that to a larger extent. Perhaps, Swedes would have shown higher skill levels if tested on oral, communicative confidence. The Eurobarometer also
collects data from all ages, while our data was collected from people aged 18-21, and looking at an average 18-21-year-old Swede’s skill in English might better corroborate our findings. While it is good news that CCL average is higher than expected, because of the aforementioned correlation between confidence and academic achievement, we must look into the rest of the results to find further causes for these levels of CCL.
42
6.1.2 Academic achievement
Academic achievement was the only variable we found with a positive correlation, or any kind of correlation, with CCL among the participants. That means that participants with a high grade report a high CCL. It is, however, hard to tell what influence what; does having a high grade increase your confidence, or does a high CCL help you achieve higher grades? There might be a synergy of the two factors influencing each other as well. Our findings corroborate what Park, Lawson, and Williams (2012) and Stankov, Lee, Luo, and Hogan (2012) suggest: that greater confidence could predict higher academic achievement. However, it is worth remembering that grade is just an indicator of the skills acquired in school and decided by the curriculum, and perceived confidence is not necessarily the actual confidence you exhibit in a particular
communication situation. This line of thinking is corroborated by Hennebry, Yi Lo, and Macaro (2012), whose study claimed that the English as an L2 (second language) education skills acquired were not enough for students, with good grades, when they started studying in an Anglophone setting in international schools. Thus, consulting our results and the findings of Park et al. and Stankov et al, a possible conclusion could be that increased CCL or even increased perceived CCL can be conducive for English learning.
6.1.3 Communicative confidence level uniformity
Another finding in the results was the uniformity of the participant’s CCL. In 96 % (288 out of 300) of the cases there was a significant, positive correlation between the
reported answers on the communication situations in the questionnaire. That means that no matter the context of the situation we presented to the participant, in a vast majority of cases, a person would self-report about the same CCL consistently throughout the questionnaire. This is further corroborated by the results connected to the number of languages the participant reported proficiency in, the usage expectation of English from the participant, and the mother tongue of the communication situation, discussed below. We found no previous studies corroborating or contradicting this, meaning this could be an interesting topic for further studies.
43
6.1.4 Number of languages spoken
Our results showed that there was no correlation between the number of languages a participant recorded proficiency in and their self-perceived CCL. Bialystok (2001) provides evidence which suggests that attaining proficiency in a second language (becoming bilingual) may positively affect academic achievement. Relating this to the correlation between academic achievement and confidence, mentioned above, suggests that learning a second language may increase the level of confidence. This is further nuanced by Beyene (2007), who argued that speaking more languages may increase one’s willingness to communicate with an NS of one of those languages, which, when related to the assumption that increased motivation increases confidence (see the following section titled Usage Expectations), suggests that speaking more languages should increase one’s confidence towards situations including native speakers (NS) of those languages. Altogether, these findings seem to suggest a tendency where knowing more languages increases one’s communicative confidence; our results, however, show that the number of languages spoken does not seem to have any effect. Further, there are not a lot of studies done on multilingual students with more than two languages, and our findings are not substantial enough to make a strong claim. We therefore have to leave any definitive conclusions to future research.
6.1.5 Usage expectations
Lightbown and Spada discuss motivation in relation to the learner’s position or attitude towards the target language and its communities. They divide motivation for learning a language into two categories, the first of which is relevant for our purposes. The first category, “instrumental motivation” (Gardner & Lambert, 1972), asserts that
[i]f learners need to speak the second language in a wider range of social situations or to fulfil professional ambitions, they will perceive the communicative value of the second language and are therefore likely to be motivated to acquire proficiency in it. (as cited in Lightbown & Spada, p. 87).
This suggests that increased perceived need for a language increases motivation to learning that language, which does not necessarily mean that learning actually occurs, but does mean that learning is more likely to occur than if the learner had not felt motivated. This is further supported by Tella (2007), who found that increased