VTI rapport 604A Published 2007
www.vti.se/publications
Intelligent Transport Systems (ITS) in passenger
cars and methods for assessment of traffic safety
impact
A literature review
Astrid Linder Albert Kircher Anna Vadeby Sara NygårdhsPublisher: Publication:
VTI report 604A
Published: 2007 Project code: 20364 Dnr: 2006/0707-10
SE-581 95 Linköping Sweden Project:
ITS – Literature overview and methods for evaluation
Author: Sponsor:
Astrid Linder, Albert Kircher, Anna Vadeby and Sara Nygårdhs
Road Traffic Inspectorate
Title:
Intelligent Transport Systems (ITS) in passenger cars and methods for assessment of traffic safety impact. A literature review
Abstract (background, aim, method, result) max 200 words:
The background for this study is that many Intelligent Transport Systems (ITS) are currently introduced in passenger vehicles aiming at providing increased traffic safety. This provides a need to assess the traffic safety effects from these systems. The question that this report highlights is how these systems are designed and how the effects are evaluated.
The review resulted in identification of 300 references of which the most relevant are found in this report. The report contains a description of the background of why and how 20 systems or groups of systems have been developed, in which vehicles they can be found, a short technical description of how they work, publication of traffic safety effects and future development plans. Regarding statistical methods, an overview of how they work and the results when using these methods on ITS are described. In addition, the report contains a summary of ways of assessing safety effects from areas such as food, nuclear power and pharmaceutical industries.
The conclusion is that there are currently many different ways of supporting the driver in the task of driving the vehicle. Regarding the impact on traffic safety ofthese systems it is still an open question which evaluation methods to use.
Keywords:
Intelligent Transport Systems, ITS, active safety, traffic safety, statistical methods
ISSN: Language: No. of pages:
Utgivare: Publikation:
VTI rapport 604A
Utgivningsår: 2007 Projektnummer: 20364 Dnr: 2006/0707-10 581 95 Linköping Projektnamn:
ITS – Kunskapsöversikt och utvärderings-metoder
Författare: Uppdragsgivare:
Astrid Linder, Albert Kircher, Anna Vadeby och Sara Nygårdhs
Vägtrafikinspektionen
Titel:
Intelligenta transportsystem (ITS) i passagerarbilar och metoder för utvärdering av dess inverkan på trafiksäkerheten – en literaturgenomgång
Referat (bakgrund, syfte, metod, resultat) max 200 ord:
Bakgrunden till studien är att många olika så kallade ”intelligenta transportsystem” (ITS) utvecklas och finns idag i fordon för att öka trafiksäkerheten. Därmed finns det ett behov av att uppskatta trafiksäker-hetseffekten av dessa system. Frågor som den här rapporten belyser är hur dessa system är utformade och hur trafiksäkerhetseffekterna av systemen utvärderas.
Litteratursökningen resulterade i 300 referenser varav de mest relevanta finns i rapporten. Rapporten innehåller en beskrivning av bakgrund till varför och hur 20 system eller grupper av system utvecklades, vilka bilar det finns i, en kort teknisk beskrivning av hur systemet fungerar, publikationer om trafiksäker-hetseffekter då sådana har identifierats i litteratursökningen samt beskrivning av framtida vidareutveck-lingar och utvecklingsprojekt. Med avseende på statistiska metoder finns de som publicerats beskrivna samt resultatet av dessa. Dessutom finns ett avsnitt om hur säkerhet beaktas i andra branscher så som livsmedel, kärnkraft och läkemedel.
Slutsatserna är att många intelligenta transportsystem som syftar till att stödja föraren i att på ett säkert sätt framföra fordonet har utvecklats och många fler är på gång. Med avseende på erhållna trafiksäker-hetseffekter av dessa system är det fortfarande en öppen fråga vilka utvärderingsmetoder som skall användas.
Nyckelord:
Intelligenta transportsystem, ITS, aktiv säkerhet, trafiksäkerhet, statistiska metoder
Preface
The present study has been initiated and funded by the Swedish Road Traffic Inspecto-rate (Vägtrafikinspektionen). Project owner at the Road Traffic InspectoInspecto-rate has been Peter Larson assisted by Örjan Ellström. The study has been conducted in order to create a basis within the area of assessment of traffic safety effect of Intelligent Transport Systems (ITS), such as Electronic Stability Control (ESC) and Adaptive Cruise Control (ACC), in passenger vehicles. In this report we have aimed at
highlighting the methods that are in use and identifying specific needs associated with evaluation of traffic safety effects of active safety systems.
The authors are all associated with VTI. Astrid Linder’s research area is biomechanics and crash safety, Anna Vadeby’s research area is traffic safety and statistical evaluation, Albert Kircher’s research area has a focus on human-machine interaction and traffic simulators and Sara Nygårdhs’ research area is mainly night-time traffic.
The authors are grateful for the support of Claes Eriksson regarding the literature search, Tania Dukic and Selina Mårdh for their support to the chapter on driver behaviour and Tarja Magnusson for the support on the wording in English of the content of this report. For copyrighted material a written consent by the copyright owner had to be obtained in order to print it in the report. We express our gratitude to the companies and authors for being allowed to use their material.
Göteborg, December 2007
Quality review
External peer review was performed on 27 September 2007 by Chris Patten at the Swedish Road Administration. Astrid Linder has made alterations to the final
manuscript of the report. The research director of the project manager Pontus Matstoms examined and approved the report for publication on 30 November 2007.
Kvalitetsgranskning
Extern peer review har genomförts 27 september 2007 av Chris Patten, Vägverket. Astrid Linder har genomfört justeringar av slutligt rapportmanus. Projektledarens närmaste chef, Pontus Matstoms, har därefter granskat och godkänt rapporten för publicering 30 november 2007.
Table of Content
Summary ... 5
Sammanfattning ... 7
List of acronyms and abbreviations ... 9
1 Introduction ... 11
2 Aim of the study ... 13
3 Material and method ... 14
4 ITS in passenger vehicles... 16
4.1 What is ITS? ... 16
4.2 Classification of ITS ... 17
4.3 ITS focus areas... 21
4.4 ITS road map ... 21
4.5 Conclusions ... 24
5 ITS available in series-produced passenger cars ... 25
5.1 Driver monitoring ... 26
5.2 Night vision systems ... 28
5.3 Workload management systems... 31
5.4 Emergency steering assist... 31
5.5 Brake force display ... 32
5.6 Adaptive headlights ... 33
5.7 Lane departure warning ... 35
5.8 Adaptive cruise control... 36
5.9 Counter-steering assistance ... 38
5.10 Hill descent control ... 39
5.11 Electronic stability control ... 39
5.12 Blind Spot Detection Systems... 42
5.13 Pre-collision, collision avoidance and obstacle detection systems ... 43
5.14 Emergency braking assist... 49
5.15 Systems acting on a range of vehicle dynamics ... 51
5.16 Active whiplash injury risk reduction ... 52
5.17 Airbags... 52
5.18 Pedestrian impact mitigating... 53
5.19 Post-crash systems and eCall ... 54
5.20 Other systems... 55
5.21 Overview American market... 57
5.22 Development of ITS in Japan, US, and Europe ... 59
5.23 The effects of ITS on traffic safety ... 59
5.24 Classification of systems as convenience or safety systems ... 60
5.25 Driver behaviour ... 61
5.26 Methods for estimation, evaluation and verification of traffic safety impact ... 63
6 Statistical methods using accident data to estimate the safety effects
of ITS ... 65
6.1 Background... 65
6.2 Different approaches to estimate safety improvements ... 67
6.3 Estimated safety effects on the number of accidents... 72
6.4 Are expected savings overestimated? ... 75
6.5 An approach to combine expert judgements with accident data ... 75
6.6 How to obtain a database ... 76
7 Estimating expected effect... 78
7.1 Evaluation guidelines for ITS ... 78
7.2 The pharmaceutical industry... 80
7.3 The Food industry ... 82
7.4 Security equipment and alarms ... 85
7.5 The nuclear power industry... 87
7.6 The aircraft industry ... 90
7.7 Forensic equipment ... 92
7.8 Conclusions ... 94
8 General conclusions and recommendations for future studies ... 95
References ... 97
Appendices
Appendix 1 Companies developing obstacle detection systems Appendix 2 Companies developing night vision systems
Appendix 3 List of terms used for the literature search Appendix 4 Double pair comparison method
Appendix 5 Information from STRADA (in Swedish) Appendix 6 Vehicle information in STRADA (in Swedish)
Intelligent Transport Systems (ITS) in passenger cars and methods for assessment of traffic safety impact. A literature review
by Astrid Linder, Albert Kircher, Anna Vadeby and Sara Nygårdhs VTI (Swedish National Road and Transport Research Institute) SE-581 95 Linköping Sweden
Summary
The background of this study is that many so called Intelligent Transport Systems (ITS) are currently developed and introduced in passenger vehicles aiming at providing increased traffic safety. This provides a need to assess and evaluate the traffic safety effect of these systems. This report highlights how the effects of these systems on the traffic safety are evaluated and gives a review of some ITS that currently (2007) can be found in the car fleet. The method that has been used in the literature review consisted of a literature search in bibliographic databases resulting in identification of 300 references of which the most relevant are found in this report. In addition, discussions with researchers in the transport sector were carried out and searches were done using the Internet. The technical systems described in the report were selected on the basis of that they should be “technically complicated” meaning that they have a potential to improve traffic safety by reducing the number of crashes or by reducing the crash severity when a crash occurs and also be available in the production of vehicles. In the report 20 systems or groups of systems are described. The report contains a description of the background of why and how the systems have been developed, in which vehicles they can be found as well as details about suppliers when applicable, a short technical description about how the system works, publication of traffic safety effects when such have been found in the literature and future development plans. On the topic of statistical methods an overview of how they work and the results that have been published using these methods on ITS are described. In addition, the report contains a chapter consisting of a summary of ways of assessing safety effects of new products or methods from other areas such as food, nuclear power and pharmaceutical industries.
The conclusion of the review is that many intelligent systems that aim at supporting the driver in driving in a safe way have been developed and more will be developed. Many systems that could improve traffic safety are labelled as comfort or driver support systems. There are currently many different ways of supporting the driver in the task of driving the vehicle without becoming involved in a crash. Regarding the estimated and achieved impact on traffic safety from these systems it is still in many respects an open question which evaluation methods to use.
Intelligenta transportsystem (ITS) i passagerarbilar och metoder för utvärdering av dess inverkan på trafiksäkerheten – en literaturgenomgång
av Astrid Linder, Albert Kircher, Anna Vadeby och Sara Nygårdhs VTI
581 95 Linköping
Sammanfattning
Bakgrunden till studien är att många olika så kallade ”intelligenta transportsystem” (ITS) utvecklas och finns idag i fordon bland annat för att öka trafiksäkerheten. Därmed finns det ett behov av att uppskatta/verifiera trafiksäkerhetseffekten av dessa system. Frågor som den här rapporten belyser är hur trafiksäkerhetseffekterna av sådana system utvärderas samt vilka är de tekniska system som redan nu (2007) finns i personbilar. Metoden som använts för litteratursökning i studien har bestått av litteratursökning i biblioteksdatabaser som resulterade i 300 referenser varav de mest relevanta finns i rapporten. Även diskussioner med forskare främst inom transportbranschen i Sverige och sökningar via Internet har genomförts. Urvalskriterierna för vilka tekniska system som skulle ingå i rapporten var att de förutom att vara tekniskt komplexa med potential att åstadkomma ökad trafiksäkerhet även skulle finnas i personbilar i produktion. I rapporten beskrivs 20 system eller grupper av system som finns i personbilar idag. Rapporten innehåller en beskrivning av bakgrund till varför och hur systemet utveckla-des, vilka bilar det finns i och uppgifter om eventuella underleverantörer, en kort teknisk beskrivning om hur systemet fungerar, publikationer om trafiksäkerhetseffekter då sådana har identifierats i litteratursökningen samt beskrivning av framtida
vidareutvecklingar och utvecklingsprojekt. Med avseende på statistiska metoder finns de som publicerats beskrivna samt resultatet av dessa. Dessutom finns ett avsnitt om hur säkerhet beaktas i andra branscher såsom livsmedel, kärnkraft och läkemedel.
Slutsatserna från litteraturgenomgången är att många intelligenta transportsystem som syftar till att stödja föraren att på ett säkert sätt framföra fordonet har utvecklats och många fler är på gång. Ett stort antal av systemen som kan ha en trafiksäkerhetshöjande effekt betecknas som komfortsystem eller förarstödssystem. Om denna skillnad i beteckning innebär att metoder för att utvärdera och följa upp trafiksäkerhetseffekter inte utvecklas kan det innebära en begränsning med avseende på den kunskap som erhålls om systemen. Tack vara satsningen på utvecklandet av tekniska komponenter finns idag stora möjligheter att ge föraren ökat stöd för framförandet av fordonet på ett säkert sätt. Med avseende på erhållna trafiksäkerhetseffekter av dessa system är det fortfarande en i många avseenden öppen fråga vilka utvärderingsmetoder som skall användas.
List of acronyms and abbreviations
ABS Anti-lock braking systemACC Automatic cruise control or adaptive cruise control ADAS Advanced driver assistance systems
BAS Brake assist system
BMW Bayerische Motoren Werke, German car manufacturer
eCall Emergency call
ESC Electronic stability control ESP Electronic stability program VSC Vehicle stability control
FIR Far infrared
GPS Global positioning system
ITRD International transport research documentation
ITS Intelligent traffic system or intelligent transportation systems IVS Intelligent vehicle systems
IVIS In-vehicle information systems IVSS In-vehicle safety system
LDW Lane departure warning LED Light emitting diode
NHTSA National highway traffic safety administration
NIR Near infrared
SAE Society of automotive engineering TRIS Transport research information service VDOT Virginia department of transportation
VT Virginia tech
VTI Swedish national road and transport research institute VTRC Virginia transportation research council
FARS Fatality analysis reporting system GES General estimates system
1 Introduction
New technical solutions that aim at increasing traffic safety are introduced with increasing speed in passenger vehicles. This development intensifies the need for evaluation of achived improvements. Confirmation of traffic safety improvements is usually obtained from accident statistics.
Technical development of Intelligent Transport Systems (ITS) is associated with high expectations of its potential to increase traffic safety. Intelligent in this context represents some kind of interactive process often including the driver of the vehicle. Another
terminology that includes these systems is actice safety, in contrary of non-active safety then is passive safety such as deformation zones and airbags with fixed deployment rate. Active traffic safety systems that interact with the driver and that provide protection in accordance to the result of such interaction cannot be evaluated with methods developed for passive safety such as crash tests. Therefore there is a need to map the knowledge available and the needs in the area of the evaluation/assessment of traffic safety effects of new ITS in motor vehicles.
New safety systems are often introduced in a limited number of vehicles before becoming a part of standard equipment. While new systems only are introduced in specific models traffic safety effects can be assessed by comparing vehicles with and without the studied system (Lie et al., 2004; IIHS, 2006). Such comparisons have been able to quantify increased traffic safety by ESC (Electronic Stability Control).
The need of evaluation/assessment of traffic safety effects of new ITS in motor vehicles exists at many levels of the society: at national level, from a consumer perspective and from the vehicle industry and its suppliers. Not only is there a need to indentify the effect of different types of systems but also a need to identify, if present, differences in various systems that have the same aim as for example different technical ways of designing ESC. Such evaluation will make it possible to identify “Best Practice” and by that highlight the current most promising technical solution to a specific scenario.
Intelligent Transport Systems (ITS) have a potential to make traffic safer, and the large number of research projects on ITS solutions in transport supports this. Further technical development can increase traffic safety. Farmer and Lund (2006) have studied trends over time in driver death and what would have happened if vehicle design had not been improved (Farmer & Lund, 2006). The study was based on data from the Fatality Analysis Reporting System (FARS) in the US and shows that without improvements in vehicle design the declining trend in driver fatality risk in the US would have ended in 1993. Farmer and Lund conclude that improved vehicle design has saved thousands of lives. It is reasonable to assume that the same development that has been seen in the past, and maybe even more, can be achieved in the future.
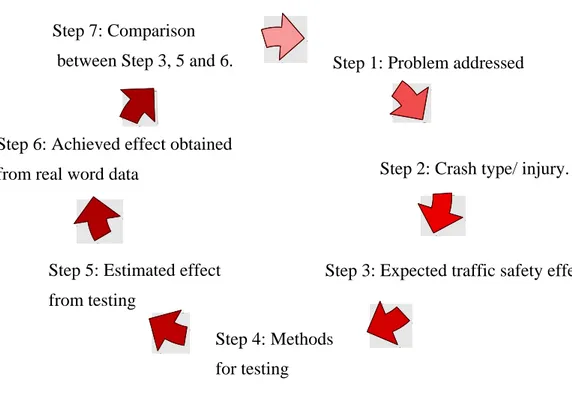
Initial emphasis is put into the development of technology and methods needed to evaluate the developed systems will be a part of the maturity of a product. Confirmed traffic safety benefits of the systems, impact on the driver and the driver environment, real versus expected (or advertised) benefits, and long term effects are all part of this maturity. The variety of different systems, and their constant development, challenge the efforts of the development of evaluation/assessment methods to scrutinize effects of ITS. The evaluation is envisaged as a method consisting of 7 steps in a loop from identifica-tion of the extent of the type of crashes that the systems aims at reduce or avoid towards the last step which contains a comparison between expected, estimated and achieved traffic safety effect, Figure 1.1.
Step 7: Comparison
between Step 3, 5 and 6. Step 1: Problem addressed
Figure 1.1 The loop with 7 steps from identification of problem to evaluation of achieved effects and comparison of these to expected and estimated traffic safety effects of
intelligent transport systems.
The steps can be described with the examples as follows:
Step 1: Problem that the system aims at dealing with is for example the risk of skid or
run off the road or loosing control in a steering manoeuvre in order to avoid an obstacle.
Step 2: Crash type/injury that a system aims at reduces for examples ESC (Electronic
Stability Control) which aim at reduce the amount of roll over and run of the road crashes.
Step 3: Expected traffic safety effect achieved by the system for example X% reduction
of the number of roll over crashes.
Step 4: Methods for testing of the effect of the system for example a steering manoeuvre
in order to avoid an obstacle.
Step 5: Estimated effect by the system from testing for example ESC will provide a Y%
reduce run off crashes.
Step 6: Achieved effect obtained from real world data by for example usage of the
statistical method “paired comparison” (Lie et al., 2004).
Step 7: Comparison between expected, estimated and achieved traffic safety effect.
Step 3: Expected traffic safety effect
Step 4: Methods Step 6: Achieved effect obtained
Step 2: Crash type/ injury. from real word data
Step 5: Estimated effect from testing
2
Aim of the study
The aim of this study was to provide an overview of in-vehicle techniques which, in an interactive manner with the driver, have the potential to increase traffic safety and to show how these systems are evaluated when they are present in the car fleet.
The report consists of three parts. First a description of Intelligent Transport Systems (ITS) that are currently available in passenger cars, secondly a review of the statistical methods used to evaluate the traffic safety benefits of ITS and thirdly an overview of how effects of new products and systems are dealt with in other industrial areas.
Due to the focus of the study, this literature review of in-vehicle systems does not cover entertainment systems and nor are inter-vehicle and vehicle-to-environment communi-cation systems included. Furthermore, the study does not include any assessment of the role of different organisations and governmental agencies in the evaluation of the influence on traffic safety concerning technical development of ITS.
3 Material
and
method
The literature presented in this report was collected from several sources, including bibliographic databases, Internet, specialized magazines, company press releases and reports as well as personal communication with experts from the car manufacturing and safety research sector. Table 3.1 below lists some of these sources of information.
Bibliographic database search was performed by the VTI Library and Information Centre (BIC) and by the authors.
Table 3.1 Sources of information for the literature overview.
Literature review
Literature review by VTI’s Library and Information Centre (BIC) Databases: • Scopus • Compendex • Inspec • ITRD • TRIS • TRAX • SAE • PsycInfo • MathSciNet
Literature review by author (traditional and electronic media) Consultation
of specialized literature
Available at VTI (BIC).
Vehicle and traffic publications and specialized journals. Examples:
• Inside ITS
• Intelligent Highway
• International Journal on Injury Control and Safety Promotion • International Journal on Vehicle Information and Communication • ITS international
• Journal of Safety Research Review of
relevant projects
For example NCAP+, TRACE, ADASE, 100-Car Study, IVSS projects, etc.
Contact car manufacturers
Research departments of mainly Nordic car manufacturers.
Internet Company web pages and any other information of interest.
Description of the databases used in the literature search “Transport databases”
TRAX – library catalogue at VTI. The database started 1979 and contains more than
120,000 references to publications from 1920s and onwards. The annual growth is approximately 6,000 references per year.
ITRD (International Transport Research Documentation) – an international database
and is a part of OECD’s transport research program. It contains more than 350,000 references.
TRIS (Transport Research Information Service) – is run by the American TRB
(Transportation Research Board) and aim at distribute information about transport research. It contains more than 600,000 references to transport related literature and ongoing research.
SAE (Society of Automobile Engineering) – contains information on worldwide
litera-ture on technologies for self-propelled vehicles for land, sea, air, and space. Topics include engines, materials, fuels and lubricants and design manufacturing. It contains approximately 140,000 references to transport related literature and ongoing research.
“Technical databases”
Compendex – is also named or part of EI Compendex or Engineering Index Compendex
or Engineering Village2. Its focus is a broad engineering research perspective. It contains more than 8 million references.
Inspec – "... provides a comprehensive index to the literature in physics,
electri-cal/electronic engineering, computing, control engineering, information technology, production, manufacturing and mechanical engineering. It also has significant coverage in areas such as materials science, oceanography, nuclear engineering, geophysics, bio-medical engineering and biophysics". It contains more than 8 million references (May 2006). Produced by the Institution of Engineering and Technology, a non-profit organisation registered as a charity in the UK.
Other databases
Scopus – a biographic reference database containing more than 28 million abstracts and
245 million references added to the abstracts. Scopus covers broadly health and life sciences i.e. technology, social science, psychology, economy, environment etc. Scopus is produced by Elsevier.
PsycInfo – covers broadly behaviour science such as: behaviour psychology and related
behavioural and social sciences, including psychiatry, sociology, anthropology, educa-tion, pharmacology, and linguistics. It contains approximately 2,200,000 references.
MathSci (also called MathSciNet) – "produced by the American Mathematical Society
(AMS), provides comprehensive coverage of the world's literature on mathematics, statistics, computer science and their applications in a wide range of disciplines, including operations research, econometrics, engineering, physics, biology, and many other related fields. Coverage is international, with nearly one third of the documents indexed originally published in languages other than English."
Comment: The large database Medline is not part of the list above since all journals that are found in Medline are indexed in Scopus for the time frame that this search covers. A list of search words used in the literature search is found in Appendix 3. More than 300 articles and reports were found and scrutinized. Those most relevant are included in the reference list of this report.
4
ITS in passenger vehicles
This chapter introduces intelligent transportation systems from a theoretical point of view, starting with a general definition and then describing different ways of classifying ITS. The scope is to summarize ITS from a traffic safety point of view, without technical descriptions of systems. Much research is ongoing around ITS, a number of focus areas targeted by researchers is presented in subchapter “ITS focus areas” on page 21.
Prospects for ITS introduction dates and possible traffic safety potential are summarized in subchapter “ITS road map” on page 21. Technical system descriptions and research findings are presented in the Chapter “ITS available in series-produced passenger cars”) starting on page 25. The groups of the systems described in Chapter 5 follows loosely the ITS classification in Figure 4.2 on page 19.
4.1
What is ITS?
ITS is an acronym for Intelligent Transportation Systems or Intelligent Transport Systems. ITS is generally road based, vehicle based, vehicle to road based or vehicle to vehicle based technologies supporting the driver and/or the management of traffic in a transport system. On the vehicle side of ITS often two major subdivision are found: in-vehicle information and communication systems (IVIS) and advanced driver assistance systems (ADAS). IVIS and ADAS can then be subdivided into active and passive safety systems. The term ”intelligent” is often used for user interfaces (Riecken, 1997), and there are parallels here: An ITS should adapt to the actual situation, anticipate the needs and take initiative and possibly be explanative. This leads to the exclusion of passive safety systems in our context. A distinction between passive and ”intelligent” safety system is for example a standard safety belt, which is considered to be a passive system, whereas an intelligent safety system could be a safety belt that automatically tensions when an impact is considered imminent and adapts the tension to the crash severity and the mass of the driver. This example illustrates the usage of ”intelligent” in relation to safety systems and traffic systems in this report. Figure 4.1 shows the focus of this report which is mainly “intelligent” (advanced) in-vehicle systems for passenger cars related to safety, thus more focus is put on active than on passive safety systems. For the scope of this report Figure 4.1 denotes what systems are reviewed here and where they are placed in the ITS context.
Traffic systems Intelligent Traffic Systems Passive Traffic systems ….
Comfort Communication Safety Navigation Logistics…
… Motorbike Truck Passenger car
Road systems
In-car systems
Figure 4.1 ITS in the context of this report which is “intelligent” in-car systems related to safety in passenger cars. Other areas showed in the figure are not included, except if of relevance.
Between-car systems
4.2
Classification of ITS
There are different manners of classifying ITS and its two major subdivisions: IVIS and ADAS. No international standards for classification are present to our knowledge, and different authors have different understanding of the acronyms. Generally IVIS is related to information provided to the driver (for example route guidance and various
vocal/visual information messages); while ADAS relates to assistance systems for the primary driving task, for example collision avoidance, vision enhancement, etc. Lane departure warning systems (without any corrective steering action) are an interesting example of this sometimes loose delineation of system association: even if lane departure warning systems only provide information to the driver, they are classified as ADAS in a number of reports (see Floudas et al., 2004 for example). One definition of ADAS is found the documentation from the PReVENT project (PReVENT, 2007): “Driver Assistance Systems are supporting the driver in their primary driving task. They inform and warn the driver, provide feedback on driver actions, increase comfort and reduce the workload by actively stabilizing or manoeuvring the car. They are assisting (compared to taking over) due to the fact that the responsibility remains always with the driver. ADAS are a subset of the driver assistance systems. ADAS are characterised by all of the following properties:
• support the driver in the primary driving task • provide warnings or active support
• detect and evaluate the vehicle environment • use complex signal processing
A classification of a large number of systems into ADAS or not ADAS is found on page 94 of the report of PReVENT (2007).
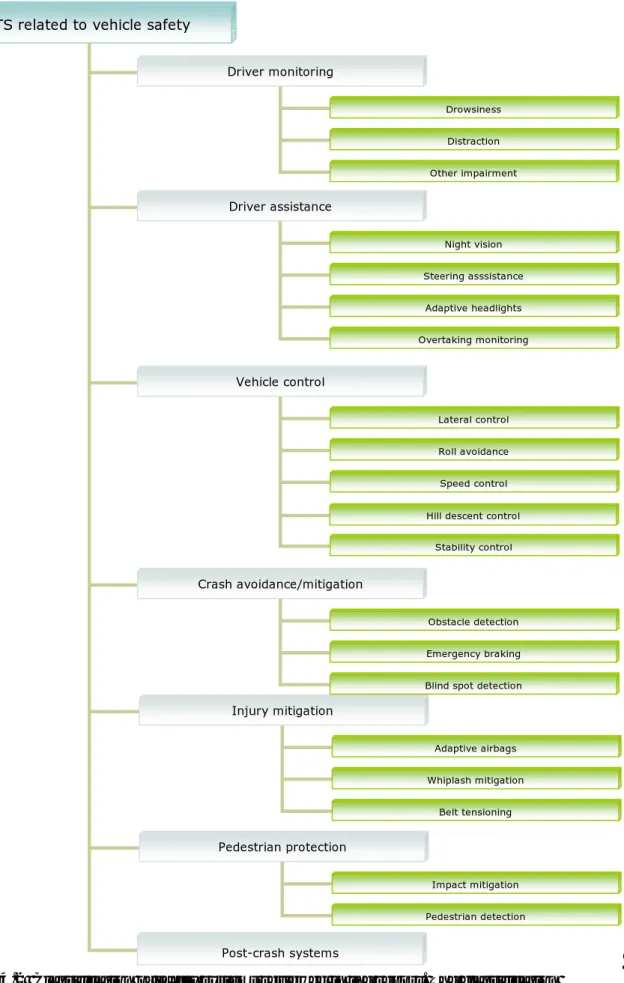
Passive safety systems protect vehicle occupants when a collision occurs while active safety systems act before the crash. Figure 4.1shows the general classification of in-vehicle ITS related to safety used in this report.
It loosely follows the timeline from normal driving to critical situation, imminent crash, crash phase and finally post-crash, and has the following main areas: driver monitoring, driver assistance, vehicle control, crash avoidance-mitigation, injury mitigation,
pedestrian protection, and finally post-crash systems.
ITS related to vehicle safety Driver monitoring Drowsiness Distraction Other impairment Driver assistance Night vision Steering asssistance Adaptive headlights Overtaking monitoring Vehicle control Lateral control Roll avoidance Speed control Hill descent control
Stability control Crash avoidance/mitigation
Obstacle detection Emergency braking
Figure 4.2 Classification of safety systems reviewed in the report. The classification loosely follows the timeline from normal driving to critical situation, imminent crash, crash phase and post-crash.
Blind spot detection Injury mitigation Adaptive airbags Whiplash mitigation Belt tensioning Pedestrian protection Impact mitigation Pedestrian detection Post-crash systems
A strict division into the classes in Figure 4.2 is not possible. For example, a system that is acting on the lateral stability of the vehicle will be classified as “vehicle control” but also as “crash avoidance”. This should not be seen as a dilemma, but rather elucidates the variety and complexity of today’s technology.
Another way of classify systems is based on the occurrence in the chain of events during normal driving, incoming hazardous situation, imminent crash situation, crash impact mitigation, and finally post-crash systems. Yet another classification strategy considers systems only warning the driver or acting autonomously (for example by braking). A classification based on active and passive systems is more difficult given the complexity of a modern system and the interaction between different systems.
There is an important note here: often car manufacturers tend to classify systems as “comfort improving” or “convenience systems” even if they have the potential to improve safety. If the reason for this are legislative issues is not known. In this report focus is on systems with “potential” to increase traffic safety (even if the systems are classified as “systems to improve comfort”). Please consult chapter 5.24 on page 60 for a discussion on this issue.
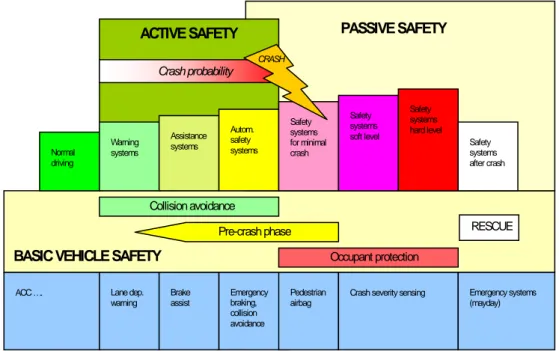
The ADASE EU project (within the fifth framework programme ADASE Consortium, 2004b) proposed another classification, based on active versus passive safety, and pre- versus post-crash phase: The actions (systems) in each area, for example rescue, collision avoidance and occupant protection are shown in Figur 4.3. Active versus passive safety systems are classified based on pre- and post crash phase, and it is shown which systems are aimed at collision avoidance and which are aimed at occupant protection. In
Figure 4.3 systems to protect pedestrians and also systems for driver monitoring and for distraction or drowsiness are excluded.
Figure 4.3 Holistic view on safety, adapted from ADASE Consortium (2004b). Active and passive systems, as well as timeline and crash probability are found in the figure.
ACC …. Lane dep.
warning Brake assist Emergency braking, collision avoidance
Pedestrian
airbag Crash severity sensing Emergency systems (mayday)
PASSIVE SAFETY ACTIVE SAFETY Normal driving Warning systems Assistance systems Autom. safety systems Safety systems for minimal crash CRASH Crash probability Safety systems hard level Safety systems
soft level Safety systems after crash
Collision avoidance
RESCUE Pre-crash phase
4.3
ITS focus areas
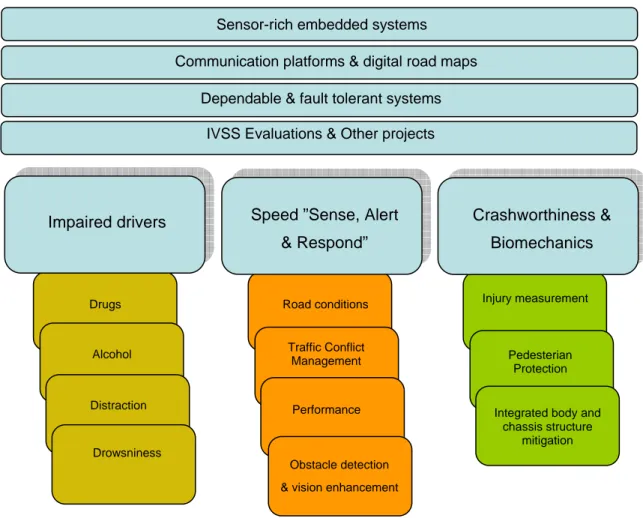
As described in chapter 4.2, ITS can be used both in the assistance of the driver task and in order to improve traffic safety. Focus areas of ITS can be based on drivers, situations and systems. Figure 4.4, adapted from Bishop (2007), illustrates the main focus areas and the issues addressed in each area. The main areas are systems (embedded, fault tolerant, dependable), communication platforms (encompassing digital maps) and evaluation. Focus is on drivers, speed dictated situations, and biomechanics related to impact. The focus areas require quite different approaches: there are the technical challenges in developing systems, human factors aspects, medical aspects in injury measurement and driver impairment, traffic management and the infrastructure matters, and always legislative requirements when introducing systems on the market.
Sensor-rich embedded systems
Figure 4.4 ITS focus areas (adapted from Bishop (2007)). Main areas are systems (embedded, fault tolerant, dependable), communication platforms (encompassing digital maps) and evaluation. Focus is on drivers, speed dictated situations, and biomechanics related to impact.
4.4
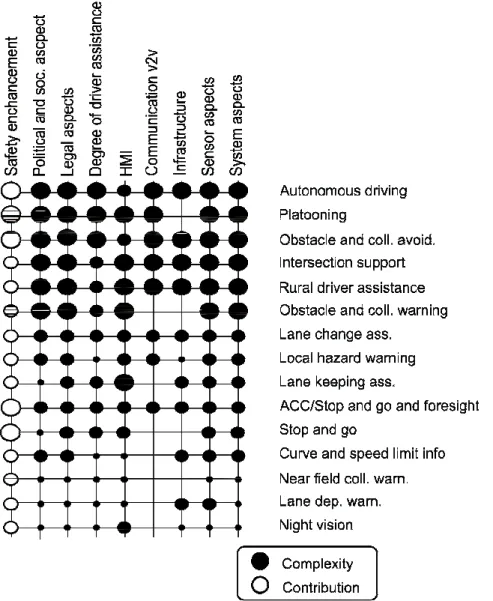
ITS road map
There are attempts in marketing studies and by researchers to describe and predict the contribution to traffic safety, future development and introduction date of new ITS. Of interest here is the ADASE2 roadmap for complexity and contribution to safety for different ITS (ADASE Consortium, 2004a). The complexity of a system often correlates positively with its development time, and thus with the introduction date. Figure 4.5
Communication platforms & digital road maps
Dependable & fault tolerant systems IVSS Evaluations & Other projects
Road conditions Injury measurement
Pedesterian Protection
Speed ”Sense, Alert Crashworthiness &
Impaired drivers
& Respond” Biomechanics
Drugs
Traffic Conflict Management Alcohol
Distraction Performance
Integrated body and chassis structure
mitigation Drowsniness
Obstacle detection & vision enhancement
shows the safety contribution and complexity of driver assistance systems; some of the systems are already found in cars today, other are in development phase. The size of the circle in Figure 4.5 (white for “contribution to safety” and black for “system complexi-ty”) indicates relative impact for the named system (or action by the system). It is inte-resting to see that stop and go cruise control systems are thought to have high safety enhancement potential (although these are classified as convenience systems by car manufacturers), while obstacle and collision warning is given a lower safety enhance-ment property.
Figure 4.5 ADASE2 roadmap for advanced driver assistance systems in Europe (ADASE Consortium, 2004a). The size of the circle (white for “contribution to safety”, and black for “system complexity”) indicates effect magnitude.
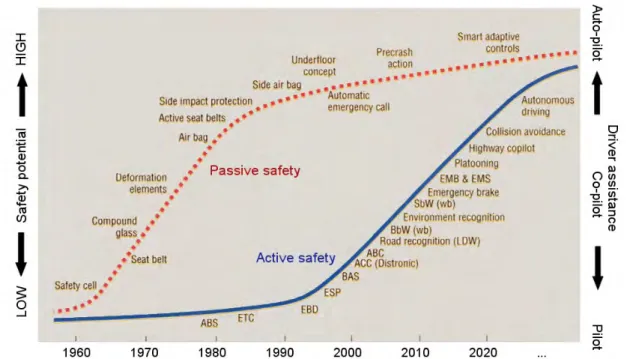
Leen and Heffernan provided an estimation of the introduction date of different vehicle safety systems, dividing into active and passive safety systems and technology imple-mentation (Leen & Heffernan, 2002). In Figure 4.6 safety potential and level of driver assistance follow the y-axis, while adoption year is represented on the x-axis. It is
interesting to note that in the article, (which is from 2002), the authors estimated collision avoidance systems to be introduced by 2020; but in fact the systems start to appear
already now. This shows how difficult it is to predict the future development of ITS, and may as well be related to which systems are getting most attention by the car
manufacturers. Both in Figure 4.5 and Figure 4.6 autonomous driving is considered the “final” development, which gives the highest contribution to traffic safety. In a way this implies that the driver is the most critical factor for unsafe traffic.
Figure 4.6 Past and future vehicle safety system from (Leen & Heffernan, 2002). Safety potential and level of driver assistance rises on the y-axis, while adoption year rises on the x-axis.
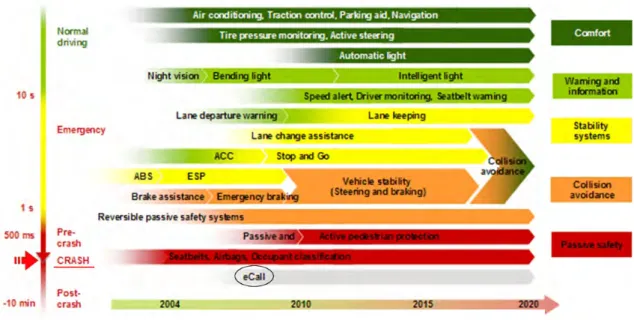
In the final SEiSS report (Abele et al., 2005) another interesting view of ITS is presented. Here systems are classified by timing (pre-post crash), introduction date, and function as shown in Figure 4.7. Timeline raises on the x-axis, while driving situation and systems purpose are colour coded, with red colour signifying crash situations, yellow meaning emergency situations, and green colour normal driving situations. This classification lists eCall as well, which is not often found in other categorizations. Again, here collision avoidance systems were not expected in the next couple of years.
Figure 4.7 ITS roadmap adapted from Abele et al. (2005). Timeline raises on the x-axis, while driving situation is colour coded on the vertical line, with red colour signifying crash situations, yellow meaning emergency situations, and green colour normal driving situations. The colour coding denotation is reflected in the system function.
It should be mentioned that there are an increasing number of major research projects aimed at developing and evaluating innovative ITS. The European Union, National Highway Traffic Safety Administration, and many more are concentrating efforts in this area. Just to name a few: in Europe PReVENT, AKTIV in Germany, in Japan Smartway (intersection collision avoidance, blind curve monitoring, etc), in the US IVBSS and CICAS. Furthermore cooperation between research institutions, government bodies and industry gains weight. An overview of relevant ITS related EC projects is found in the appendix B of (Rekveldt & Labibes, 2003).
4.5 Conclusions
This chapter presented a theoretical framework around the ITS area. Different classi-fication options showed the complexity of ITS, and the focus areas together with the road map gave insight into ongoing traffic safety research. Differences in opinion about introduction date of ITS (see road map in Figure 4.7 and Figure 4.6) from show that forecasting ITS development is challenging. Focus areas and road maps serve to under-stand where safety focus was in the past, and how this could change in the future. The following main chapter will abandon theoretical frameworks and instead describe real systems found already nowadays in vehicles, citing relevant scientific findings
5
ITS available in series-produced passenger cars
This chapter is a technical review intended to give an outline of the present state of ITS in passenger vehicles. The criteria for choosing the ITS reviewed here are: a) only in-car systems, excluding ITS on infrastructure and roads; b) systems that have a potential to increase traffic safety; c) systems that are technically “advanced” and able for example to adapt to the needs or anticipate situations or take initiative; d) systems available in series-produced passenger car.
Each subchapter describes a certain system, and gives references to studies evaluating its safety aspects (if present). A short summary concludes each subchapter. Ordering of the subchapters follows loosely the ITS classification in Figure 4.2. A short description of other safety systems such as tyre pressure monitoring and traffic sign recognition summarizes systems not present as main chapters in the report, but worth mentioning. The systems presented are all available in series-produced cars; systems in development phase are mentioned in short form if they are likely to be found on series-produced cars soon.
The following systems are described in this chapter (name and page number):
• Driver monitoring 26
• Night vision systems 28
• Workload management systems 31
• Emergency steering assist 31
• Brake force display 32
• Adaptive headlights 33
• Lane departure warning 35
• Lane keeping assistance 36
• Adaptive cruise control 36
• Counter-steering assistance 38
• Hill descent control 39
• Electronic stability control 39
• Blind Spot Detection Systems 42
• Pre-collision, collision avoidance and obstacle detection systems 43
• Emergency braking assist 49
• Systems acting on a range of vehicle dynamics 51
• Active whiplash injury risk reduction 52
• Airbags 52
• Pedestrian impact mitigating 53
• Post-crash systems and eCall 54
5.1 Driver
monitoring
Driver monitoring is a wide field. From passenger detection for seat belts reminder to be activated to airbag activation depending on the present passenger, advanced systems try to monitor driver state in relation to impaired driving performance. Seat belt reminder has showed to substantially increase the seat belt wearing rate (Lie et al., 2007) with a 97.5% seat belt use in cars with seat belt reminder compared to 85.8% in cars without seat belt reminders. These observations were the average of the findings from seven European countries (Lie et al., 2007). Systems aimed at detecting driver impairment are under development. A driver which is tired, distracted, under influence of drugs or alcohol, or any other condition which endangers his or her role as traffic participant, can be classified as impaired driver. Much effort has been aimed on detecting drowsiness or other impairment in drivers, and here only a few publications are named: (Törnros et al., 2000; Englund, 1982; Eriksson & Papanikolopoulos, 1997; Grace et al., 2001; Singh & Papanikolopoulos, 1999; Wierwille et al., 1995; Dinges et al., 1998; and several more). A comprehensive list of references on drowsy driving is found in the National Highway Traffic Safety Administration (US) homepage (NHTSA, 1998). Methods to detect impairment include physiological measurements (such as electrooculogram), scanning of eye lid closure, scanning of facial features, steering characteristics, etc. The vast interest which impaired driving has received from the research community and the governments shows its importance in the traffic safety area. The references above are related to research on impaired driving, and do not review vehicles which already have such systems. The patterns for “impaired driving behaviour” are difficult to subjectively quantify, and this might be the reason why in the last years manufacturers have had limited success in developing systems to recognize impaired driving.
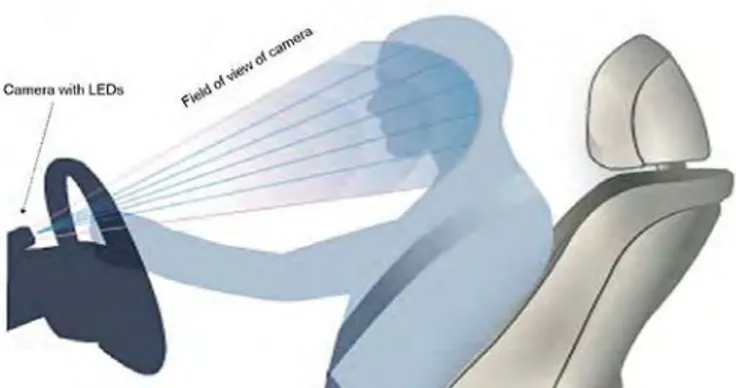
Examples of cars with driver impairment detection systems are presented below. In the Lexus car model (LS 600h model) the driver’s head is monitored by a camera mounted on top of the steering column (see Figure 5.1a and b). Infrared LEDs does allow the camera be used both at day and night time.
Figure 5.1a Driver distraction monitoring as found in the Lexus LS 600h (figure adapted from www.lexus-europe.com). A camera monitors the driver and detects distraction. Warning and according actions are performed when a driver looks away from the road for too long while an obstacle is detected in front of the car.
Figure 5.1b Device with camera and LEDs in the Lexus LS 600h to monitor the drive (figure adapted from www.autospies.com).
The system monitors facial features, and is able to determine if the driver looks away from the road. If the driver turns his or her head away from the road at an angle of more than 15 degrees whilst the vehicle is in motion and an obstacle is detected in front, the system will warn the driver by an alarm sound and a quick activation of the brakes. If this still fails to elicit action from the driver, the system engages emergency braking
preparation and front seatbelt pre-tensioning (AutoMotoPortal, 2006).
Saab and Mercedes are working on driver impairment monitoring systems, and the first cars with such systems are expected in the near future. Volvo is working on a sleep and distraction detection system (which is not on the market yet). The system is said to monitor driver state by measuring vehicle path and distance to cars ahead. A camera monitors the road ahead, not the driver. If the vehicle is moving in an uncontrolled way, the system will alert the driver with an audible warning and a message on the car’s information display. Siemens VDO plans to introduce a drowsy driver detection system, integrated with ACC and lane departure warning at the end of the decade (InsideITS, 2006). A prototype vehicle was already demonstrated in 2006. The system will use infrared cameras to monitor the driver’s face and eye blink behaviour. Ford has too a drowsy driver detection system patented (Ford Global Technologies, 2003), but not yet introduced.
Generally, driver monitoring systems to come might apply camera technology to scan the driver’s face and possibly body, and integrate with information from vehicle dynamics and infrastructure in the future. It is less likely that systems will use biosignal measure-ment (for example measuring electrocardiogram, electro-encephalogram, or electromyo-gram), even though there is a lot on ongoing research in this area. It seems that biosignal measurement is less promising, because of high inter-individual differences and
measurement issues.
The influence of driver distraction on traffic safety was shown in the 100-car study from the US Department of Transportation (study sponsored by NHTSA, VDOT, VTRC and VT). One main conclusion of the study was that “Nearly 80 percent of crashes and 65 percent of near-crashes involved some form of driver inattention within three seconds before the event. Primary causes of driver inattention are distracting activities, such as cell phone use, and drowsiness”. Note that the data is based on 82 crashes, 761 near-crashes, and 8,295 critical incidents (situations requiring an evasive manoeuvre). For more information on the 100-car study please consult (US Department of Transportation, 2006a) and for an overview of the study (US Department of Transportation, 2006b). ITS developers are well aware that fatigue is recognized as an important factor in traffic accidents, and thus have high expectations in terms of increased safety of driver
monitoring systems able to detect fatigue. Vincent et al. (1998) found no positive effects of a fatigue warning system in a field study with 32 drivers. The authors write: “…the FWS (Fatigue Warning System) had no impact on objective and subjective driver fatigue, on driving time, on the number of breaks or on break duration. Results also demonstrate that 30 minute breaks are an ineffective drowsiness countermeasure. These findings suggest that an FWS as currently conceived may not contribute to reduce fatigue induced collisions” and the authors summarize: ”… Future research needs to address what
mechanism induces subjects to take breaks and ignore warning signals. One hypothesis is that drivers consider the signal redundant” (Vincent et al., 1998).
Summarizing driver monitoring and ITS, the importance of behaviour monitoring (in terms of drowsiness and distraction) is well recognized by research community and industry. The first cars with functioning driver monitoring systems are already on the
market, and more car manufacturers are expected to release similar systems on the market in the near future. This can be deducted from the intense research effort to develop these systems, which companies such as Volvo undertake. Further research is needed to evaluate the safety advantage cars with such systems already implemented have.
5.2
Night vision systems
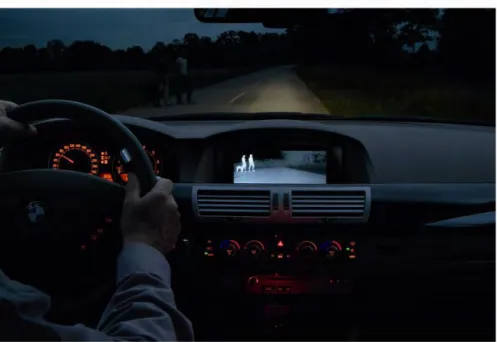
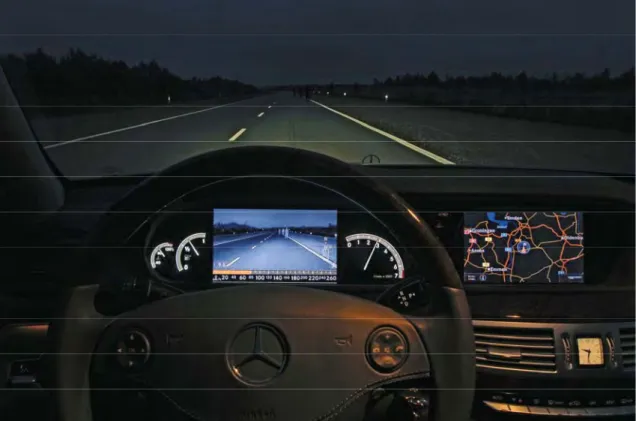
Night vision systems use different technologies to aid drivers in seeing the road during dark hours. Technology usually uses infrared light detection with special cameras; there are passive and active systems. An infrared camera pointing in driving direction can detect obstacles or pedestrians located at a longer distance than what the driver is able to see, allowing early reaction. GM launched a car with this technology in early 2000, but without success in marketing terms. The Cadillac DeVille night vision system was reportedly discontinued after 2005 after disappointing customer experiences (the system suffered from glitches and poor resolution according to unofficial sources) (Peirce & Lappin, 2006). Toyota developed also a system in early 2000, then BMW and Mercedes introduced the system in series-produced cars (ABI-Research, 2007). Honda and Lexus have an ”intelligent night vision system” but the Honda system is only commercialized in Japan. An obstacle towards mass-market production of night vision systems is the high cost which the systems still have. If demand from customers’ raises, car manufacturers could introduce more night vision systems, and systems developers such as Bosch, Autoliv, Hella, Siemens, and Valeo will experience strong demand, the costs might drop. In Europe BMW and Mercedes are the main car manufacturers with night vision systems. A list of other companies and manufacturers developing night vision systems is presented in Appendix 2. BMW’s night vision system is shown in Figure 5.2 and Figure 5.3 below. The figures show the range of the system, and its placement inside the car (monitor) and outside the car (radar). A picture from an actual image produced by the night vision systems is seen in Figure 5.3. The screen of the night vision system found in Mercedes cars is shown in Figure 5.4. Here the screen is located in the centre console. The BMW's system scans up to 984 feet in front of the car at a 12 to 18 degree angle.
The BMW system is based on far-infrared sensors (FIR) using a sensor to process the images the heat emitted by objects outside the car. The warmer the object is, the brighter the image becomes. A far-infrared system thus depends on the heat radiated by an object. A thermal imaging camera directly registers the heat radiated by objects and human beings, making a separate light source from the vehicle superfluous. Cold objects or objects with the same temperature as their surroundings, such as obstacles in the road or dead animals cannot be picked up by a far-infrared system.
While the BMW system is based on far-infrared sensors the Mercedes system is based on near-infrared sensors. With near-infrared systems (NIR), the illumination is not
dependent on environmental conditions and objects are therefore significantly more visible. Near Infrared (NIR) light beams an infrared light source into the area in front of the vehicle.
Night vision systems can be integrated with obstacle detection systems, providing the driver with specific warnings on oncoming hazards.
Figure 5.2 Night vision system of BMW (BMW press archive). Range of the system, monitor placement and activation command (arrow to the left of the steering wheel) are shown.
Figure 5.3 Detail of the night vision display (BMW press archive). The monitor (in greyscale) shows the pedestrians with a dog that would otherwise be more difficult to detect by the driver when only looking through the windscreen.
Figure 5.4 Night vision system in Mercedes cars showing the screen with image produced by the night vision system in the centre line of the sight (near tachometer) as seen by the driver through the steering wheel.
The night vision system by Honda (available for Legend models only in Japan) has similar functionality as described above, with the addition that it is able to detect pedestrians and their movements. It uses two far-infrared cameras to detect pedestrians approaching the vehicle's path and provides the driver visual and auditory cautions to help to prevent accidents involving pedestrians. The camera obtains a visual image based on the heat emitted by humans and other objects. Since it uses far-infrared radiation, it is capable of obtaining a viable image without the use of a light source, as is required by visible-light or "near-infrared" cameras. The warning has the form of a visual
enhancement frame around the pedestrian image in a head up display, together with audio-warnings. The shape of objects in the camera range is calculated to detect pedestrians, and their path is calculated too. The system provides warnings that inform the driver of the presence of pedestrians that are on the road or about to cross the road. Research available for night vision systems shows positive effects on traffic safety. In a simulator study by Hollnagel & Kallhammer (2003) night vision systems were found to have positive effects on safety: “…subjects using an NVES (Night Vision Enhancement System) gained time to assess the situation and choose an appropriate response, which was seen in terms of better control of braking and swerving. Altogether the experiments confirmed that an NVES leads to an indisputable improvement in the drivers' anticipatory control, and hence has considerable safety potential…” (Hollnagel & Kallhammer, 2003). Sullivan et al. (2004) conducted a driving study on a test track with young and older drivers in 2004. An infrared night vision systems was used. Their conclusion is that :” … Night vision systems increased target detection distance for both young and old drivers, with noticeably more benefit for younger drivers. Workload measures did not differ between the unassisted visual detection task and the detection tasks assisted by
night vision systems, suggesting that the added workload imposed by the night vision system in this study is small” (Sullivan et al., 2004).
Night vision systems are already on the market in a number of car models, mostly upper segment cars. Preliminary research results show promising positive effects on traffic safety. The systems are still expensive, and this factor may compromise large scale introduction. Integration of night vision with obstacle detection and warning systems may be a promising approach.
5.3
Workload management systems
Drivers are supported by an increasing number of complex systems inside cars, and it may become difficult to keep track of all possible warnings and alerts. For instance, there is a rise in the use of mobile phone, navigation systems, in-car entertainment, and other new features in the automobile interior. There is a possible risk of overloading the driver with information with result of possible distraction and difficulty to filter the important information. “Workload managers“ are designed to address this problem by filtering and prioritizing the information made available to the driver. They work by using a
"workload estimator", which uses information from vehicle sensors (such as speed, braking, and headlight and windshield wiper usage) to assess the potential difficulty of the driving situation. Additional information on workload estimators can be found in the references (Trent Victor – Volvo Technology, 2003; Engström et al., 2006). When challenging situations are detected, the workload manager postpones or cancels certain messages or situations, such as non-urgent vehicle warnings or mobile telephone calls. Manufactures have addressed the problem with driver overload in different ways as by optimizing user interfaces and by ergonomics. Since 2003, most Saab 9-3 and 9-5 models have had a rudimentary form of workload manager called a "dialogue manager," which suppresses certain information displays during demanding driving conditions. For example, the system "will postpone a reminder for the 30,000-mile check-up that
otherwise might be presented while driving in a torrential downpour, an inopportune time to distract a driver." (Peirce & Lappin, 2006) A similar system, called the Intelligent Driver Information System (IDIS), is available on Volvo S40s and V40s sold in Europe (Volvo Car Corporation, 2007). IDIS blocks telephone calls and text messages during times when the driver is turning, changing lanes or conducting similar manoeuvres. The Volvo S80 model has an updated workload management system, aimed at considering the actual workload of the driver and presenting information accordingly.
FIAT, Daimler Chrysler, BMW, and Toyota are working on implementation of workload management systems, too. No other cars, in which an “intelligent” workload monitoring is used, are known (as a note it should be mentioned that in the military avionics field this area has been explored much more thoroughly). The human factor community can and does greatly contribute to adapting user interfaces and presentations of information for passenger car drivers.
5.4
Emergency steering assist
Emergency steering assistance is a system which detects if the driver performs a rapid evasive manoeuvre. In this case the system reduces the steering gear ratio (which is variable) to provide more direct steering and a faster response to driver inputs. Further-more the suspension adopts a stiffer damper setting to minimise body roll. According to Lexus (which offer a car model with this system) emergency steering assist substantially
improves the car’s response to the driver’s steering input in the likelihood of a collision, increasing the chance of avoiding the obstacle (Lexus, 2007). In the literature search no scientific articles were found to support this.
Emergency steering assist systems are still rare in series-produced cars, which make collection of data to investigate the effects on traffic safety difficult.
5.5
Brake force display
Brake force display is, in comparison with other ITS in this chapter, a rather simple technique that has recently been developed. It displays brake force in a dual-stage brake light system. When applying the brakes in a normal manner, the main brake light element is illuminated, while if the brakes are applied harder the entire brake light glows red. The system uses acceleration sensors in addition to brake pedal pressure, to detect hard applied brakes. It is found in middle and high range BMW vehicles. The company states: ”BMW hopes the adoption of Brake Force Display will lead to a reduction in avoidable rear-end collisions…” (BMW, 2006).
Figure 5.5 shows the two-stage brake light. On the left without applying the brakes (only lights on), in the middle when the brakes are applied normally and on the right when the brakes are applied hard. The intensity of the brake lights is higher in the right car, signalizing stronger deceleration.
Figure 5.5 Brake force display (BMW press archive). Left car: without allying the brakes (only lights on), middle car: applying the brakes normally, right car: allying the brakes hard. The intensity of the brake lights is higher in the right car, signalizing stronger deceleration.
In the Mercedes system there are supplementary light emitting diodes (LED) inside the braking lights, which flash at 5.5 Hz in case of applying the brakes hard. Volvo has a similar system in the new model range: if a hard deceleration is detected, the brake lights automatically flash, warning drivers to the rear. In the Citroen C4 even the hazard
warning lights activate in case of applying the brakes hard. The concept is similar to the BMW system, but from the human factors point of view flashing brake lights should be more attention-catching than the BMW two-stage brake light. Volvo warns that "it
should be noted that flashing brake lights are still forbidden by law in many countries." (Web Publications Pty Limited, 2007).
Summarizing, brake force display is a relatively simple system with potential to increase awareness of unforeseen situations on the road. A number of manufacturers offer similar systems, but little research on the impact was found in this literature overview.
5.6 Adaptive
headlights
Adaptive headlights follow the road curvature actively, illuminating not only in straight forward direction but turning the light beam in road direction when the car is in a curve. This allows for better range of vision, and may improve traffic safety. Figure 5.6 shows the principle of adaptive headlights. The headlamps are motorized and the horizontal angle of the headlights is dependent of speed, gyro and steering wheel angle. In Figure 5.6 the car performs a right turn (seen from above), and the headlights turn accordingly to follow the road curvature (BMW, 2007a). The maximal angle adjustment of the headlights is usually up to 15 degrees, but there are systems which activate an additional headlight in case of 90 degrees turns (see Figure 5.7), which are available for some Opel, Audi, Volkswagen, and other models. The car detects the 90 degrees turn by steering wheel angle and vehicle dynamics. Such headlights are often called cornering headlights.
Figure 5.6 Adaptive headlights, car seen from above in a right turn (BMW press archive). The headlights turn to the right, illuminating the road and following its curvature.
Figure 5.7 Adaptive headlights for 90 degrees turn while car is approaching a turn. The illumination by normal (white), adaptive (light blue) and cornering (light red) headlights is shown.
Adaptive headlights can have an additional feature: the system can switch from high beam to low beam as soon as it detects oncoming traffic or adequate street lighting. A camera integrated in the rear-view mirror monitors ambient brightness and traffic condi-tions, and can detect approaching traffic up to one kilometre away. When the road ahead is clear again, the system automatically switches up to high beam again (BMW, 2007b). There are several car manufacturers offering adaptive headlight systems, some only in the higher price segment cars. According to marketing research company “ABI
Research”, the market in Europe seems to be more interested in this technology than the American market. American automakers are reported to have relatively little interest in adaptive lighting systems at present. While this may change as consumers gain exposure to them and understand their benefits, current projections are that only about 1½ percent of North American vehicles sold in 2010 would be equipped with them (ABI Research (Vehicle Safety Systems Report), 2005). In Europe many car manufacturers offer this system. Volvo has a similar system in preparation: here the shape and intensity of the light beam is adjusted according to speed and steering. When driving at high speed the light beam can be given a longer reach, while at low speeds (for example in urban traffic) the light beam can be made shorter and broader to light up a larger area close to the car. When the driver steers the car into a curve, the beam can be directed along the track of the curve to light up the entire road as the car changes direction. This system was presented in a concept car and it is not known if series-production is planned. The simpler system with adaptive headlights (following the road curvature) is currently available by Volvo. Other manufactures add features such as turning the headlight on and off automatically in relation to light conditions (for example Mercedes Benz S-class).
On the topic influence on traffic safety by increased visibility in darkness one study was found on the influence of increased visibility due to reflector posts (Kallberg, 1991). The experimental study by Kallberg (1991) indicated that reflector posts on narrow, curvy and hilly roads can significant increase speed and accidents in darkness.
In short, adaptive headlights are offered by an increasing number of car manufacturers, and there is a chance that they might become a standard or largely available option in
most cars in Europe. The positive effects of the system are not yet indubitable, as drivers may react differently to the system.
5.7
Lane departure warning
Lane departure warning (LDW) systems monitor the road ahead with vehicle-mounted cameras and image processing software to recognize lanes and detect if a lane departure is imminent. Figure 5.8 shows an example of lane departure warning. In Figure 5.8 the forward facing camera monitors the road marking of the road, and the system alarms the driver if road departure is likely or imminent. The driver is warned by auditory, visual, or other signals. Usually the road is monitored by camera, and clear road markings are necessary. Day or night time does not pose a problem to the system, but unclear road markings, snow, rain, etc, can compromise the functionality. The system might have a potential to reduce the number of accidents related to inattentive driving and drowsiness (single vehicle accidents).
Figure 5.8 Lane departure warning system (figure adapted from
www.lexus-europe.com). The road markings are monitored by the forward facing camera, an alarm is given to the driver if the car shows signs of road departure.
Originally LDW systems were developed for heavy trucks and found later their way into passenger vehicles, too. An overview of the heavy truck lane departure warning systems and their effect on crash number reduction can be found in (Inside ITS, 2001).
LDW systems started to appear in series-produced cars in early 2002 in Japan, around 2004 in Europe and in 2005 in America. Nowadays Nissan, Honda, Lexus, Toyota, Infinity, Peugeot, Citroen, Audi, BMW and Mercedes offer such systems, mainly in the high price segment as optional. In Europe Citroën first offered LDW systems on their 2005 C4 and C5 models, and now also on their C6. This system uses infrared sensors under the front bumper to monitor lane markings on the road surface. A vibration mechanism in the seat alerts the driver of deviations. The first production LDW system available in North America was the system jointly developed by Valeo and Iteris for Nissan Motors and fitted to their 2005 Infiniti FX and 2006 M45 vehicles. In this system, cameras mounted on the outside mirrors monitor the striping on highways. A vibrating